Analysis Summary
Notes:
- 1) No attempt has been made to eliminate the non-significant decimal places.
- 2) This batgrbproduct analysis is done using the HEASARC data.
- 3) This batgrbproduct analysis is using the flight position for the mask-weighting calculation.
======================================================================
                  BAT GRB EVENT DATA PROCESSING REPORT
    Process Script Ver: batgrbproduct v2.46
    Process Start Time: Fri Jan 17 17:59:46 EST 2014
             Host Name: batevent1
   Current Working Dir: /local/data/batevent/batevent_reproc/trigger424998
======================================================================

  Trigger: 00424998      Segment: 000

  BAT Trigger Time: 298599673.152   [s; MET]
      Trigger Stop: 298599673.408   [s; MET]
               UTC: 2010-06-19T00:21:07.246620    [includes UTCF correction]
       Where From?: TDRSS position message

  BAT
    RA: 84.6155727820155   Dec: -27.000942273695  [deg; J2000]

     Catalogged Source?: NO
     Point Source?:      YES
     GRB Indicated?:     YES    [ by BAT flight software ]
     Image S/N Ratio:    7.94
     Image Trigger?:     NO
     Rate S/N Ratio:     16.4924225024706  [ if not an image trigger ]
     Image S/N Ratio:    7.94

  Analysis Position:   [ source = BAT ]
    RA: 84.6155727820155   Dec: -27.000942273695  [deg; J2000]

  Refined Position:   [ source = BAT pre-slew burst ]
    RA: 84.6176583901286   Dec: -27.0119445672717  [deg; J2000]
        { 05h 38m 28.2s , -27d 00' 43.0" }
         +/- 1.00501703786266 [arcmin] (estimated 90% radius based on SNR)
         +/- 0.33989339844573 [arcmin] (formal 1-sigma fit error)
    SNR: 30.2004551390375

  Angular difference between the analysis and refined position is 0.669486 arcmin

  Partial Coding Fraction: 0.7578125    [ including projection effects ]

  Duration
     T90: 97.6999999880791 +/- 1.62414775065874
        Measured from: 0.283999979496002
                   to: 97.9839999675751     [s; relative to TRIGTIME]
     T50: 81.5919999480247 +/- 0.429958165968188
        Measured from: 7.58799999952316
                   to: 89.1799999475479     [s; relative to TRIGTIME]


  Fluence
     Peak Flux  (peak 1 second)
        Measured from: 87.0879999995232
                   to: 88.0879999995232     [s; relative to TRIGTIME]
     Total Fluence
        Measured from: -2.94800001382828
                   to: 106.536000013351     [s; relative to TRIGTIME]

             Band 1     Band 2     Band 3     Band 4
              15-25      25-50     50-100    100-350     keV
 Total     2.655715   3.001123   1.896164   0.368262
           0.063418   0.066092   0.058389   0.051028 [error]
 Peak      0.181533   0.217342   0.139429   0.026788
           0.007880   0.008497   0.007368   0.005082 [error]

     [ fluence units of on-axis counts / fully illuminated detector ]

======================================================================


====== Table of the duration information =============================

        Value   tstart    tstop
T100  109.484   -2.948  106.536
T90    97.700    0.284   97.984
T50    81.592    7.588   89.180
Peak    1.000   87.088   88.088


====== Spectral Analysis Summary =====================================

Model      : spectral model: simple power-law (PL) and cutoff power-law (CPL)
Ph_index   : photon index: E^{Ph_index}
Ph_90err   : 90% error of the photon index
Epeak      : Epeak in keV
Epeak_90err: 90% error of Epeak
Norm       : normalization at 50 keV in both the PL model and CPL model
Nomr_90err : 90% error of the normalization
chi2       : Chi-Squared
dof        : degree of freedo

=== Time-averaged spectral analysis ===
(Best model with acceptable fit: PL)

Model Ph_index Ph_90err_low Ph_90err_hi  Epeak  Epeak_90err_low  Epeak_90err_hi  Norm       Nomr_90err_low    Norm_90err_hi    chi2    dof
PL      -1.780    -0.060      0.060       -           -               -         4.37e-03     -1.34e-04          1.33e-04      43.410   57
CPL     -1.741    -0.094      0.232      337.676    -290.950      -337.676      4.56e-03     -5.67e-04          1.32e-03      43.330   56


=== 1-s peak spectral analysis ===
(Best model with acceptable fit: PL)

Model Ph_index Ph_90err_low Ph_90err_hi  Epeak  Epeak_90err_low  Epeak_90err_hi  Norm       Nomr_90err_low    Norm_90err_hi    chi2    dof
PL      -1.714     -0.088     0.087       -           -               -         3.39e-02     -1.69e-03          1.68e-03      46.720   57
CPL     -1.662     -0.135     0.282      320.500      N/A           N/A         3.60e-02        N/A               N/A         46.770   56


=== Fluence/Peak Flux Summary ===

              Model    Band1     Band2     Band3     Band4     Band5     Total
                       15-25     25-50    50-100    100-350    15-150    15-350    keV
Fluence         PL   7.95e-07  1.23e-06  1.43e-06  3.22e-06  4.41e-06  6.68e-06   erg/cm2
      90%_error_low -4.41e-08 -3.88e-08 -6.02e-08 -2.93e-07 -1.38e-07 -3.33e-07   erg/cm2
      90%_error_hi   4.51e-08  3.87e-08  6.01e-08  3.14e-07  1.39e-07  3.49e-07   erg/cm2
Peak flux       PL   1.71e+00  1.52e+00  9.27e-01  8.55e-01  4.53e+00  5.02e+00   ph/cm2/s
      90%_error_low -1.37e-01 -7.42e-02 -6.03e-02 -1.09e-01 -2.18e-01 -2.33e-01   ph/cm2/s
      90%_error_hi   1.41e-01  7.40e-02  5.99e-02  1.18e-01  2.19e-01  2.33e-01   ph/cm2/s

Fluence        CPL   7.88e-07  1.23e-06  1.44e-06  3.03e-06  4.39e-06  6.49e-06   erg/cm2
      90%_error_low -5.65e-08 -4.12e-08 -6.15e-08 -8.75e-07 -1.65e-07 -8.97e-07   erg/cm2
      90%_error_hi   4.29e-08  4.31e-08  6.21e-08  2.47e-07  1.51e-07  5.15e-07   erg/cm2
Peak flux      CPL   1.73e+00  1.52e+00  9.27e-01  8.39e-01  4.52e+00  5.00e+00   ph/cm2/s
      90%_error_low -1.82e-01 -7.69e-02 -4.68e-02 -2.69e-01 -2.31e-01 -3.76e-01   ph/cm2/s
      90%_error_hi   1.02e-01  8.33e-02  6.42e-02  2.01e-01  2.20e-01  2.46e-01   ph/cm2/s

======================================================================
Image
Pre-slew 15.0-350.0 keV image (Event data)
#   RAcent    DECcent   POSerr    Theta     Phi              Peak Cts       SNR   Name
   84.6177   -27.0119   0.0064    31.5605   177.9704         2.5168302     30.200 TRIG_00424998

Foreground time interval of the image:
 -2.948  10.949 (delta_t =  13.897 [sec])
Background time interval of the image:
-11.051  -2.948 (delta_t =   8.103 [sec])
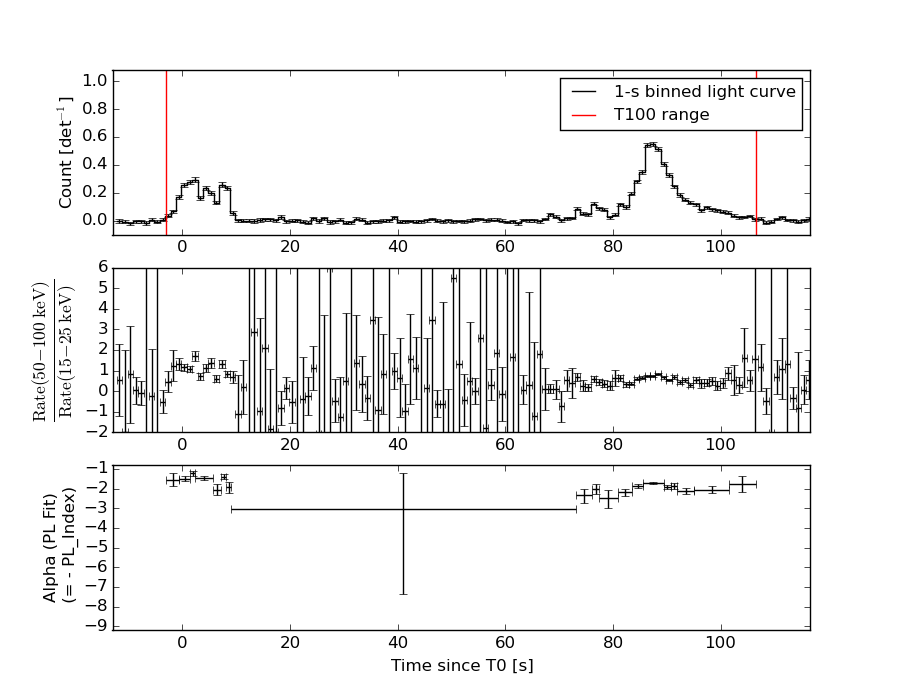
Light Curves
Note: The mask-weighted lightcurves have units of either count/det or counts/sec/det, where a det is 0.4 x 0.4 = 0.16 sq cm.
Full-time range; 1 s binning
Other quick-look light curves:
- 64 ms binning (zoomed)
- 16 ms binning (zoomed)
- 8 ms binning (zoomed)
- 2 ms binning (zoomed)
- SN=5 or 10 s binning (full-time range)
- Raw light curve
Spectra
- 64 ms binning (zoomed)
- 16 ms binning (zoomed)
- 8 ms binning (zoomed)
- 2 ms binning (zoomed)
- SN=5 or 10 s binning (full-time range)
- Raw light curve
Spectra
Notes:
- 1) The fitting includes the systematic errors.
- 2) When the burst includes telescope slew time periods, the fitting uses an average response file made from multiple 5-s response files through out the slew time plus single time preiod for the non-slew times, and weighted by the total counts in the corresponding time period using addrmf. An average response file is needed becuase a spectral fit using the pre-slew DRM will introduce some errors in both a spectral shape and a normalization if the PHA file contains a lot of the slew/post-slew time interval.
- 3) For fits to more complicated models (e.g. a power-law over a cutoff power-law), the BAT team has decided to require a chi-square improvement of more than 6 for each extra dof.
Time averaged spectrum fit using the average DRM
Power-law model
Time interval is from   -2.948 sec. to  106.536 sec.

Spectral model in power-law:
------------------------------------------------------------
Parameters  : value       lower 90%   higher 90%
Photon index: -1.78025     ( -0.0602214   0.0598146 )
Norm@50keV  : 4.36609E-03    ( -0.000133822   0.000133293 )
------------------------------------------------------------
#Fit statistic : Chi-Squared =          43.41 using 59 PHA bins.
# Reduced chi-squared =         0.7617 for     57 degrees of freedom
# Null hypothesis probability =   9.076673e-01

Photon flux (15-150 keV)    in 109.5 sec: 0.597123 ( -0.019362  0.019442 ) ph/cm2/s
Energy fluence (15-150 keV)             : 4.40538e-06 ( -1.38171e-07  1.38678e-07 ) ergs/cm2
Cutoff power-law model
Time interval is from   -2.948 sec. to  106.536 sec.
Spectral model in the cutoff power-law:
------------------------------------------------------------
Parameters  : value       lower 90%   higher 90%
Photon index: -1.74146     ( -0.0944412   0.232485 )
Epeak [keV] : 337.676      ( -290.977 -337.703 )
Norm@50keV  : 4.56097E-03    ( -0.000566482   0.0013229 )
------------------------------------------------------------
#Fit statistic : Chi-Squared =          43.33 using 59 PHA bins.
# Reduced chi-squared =         0.7737 for     56 degrees of freedom
# Null hypothesis probability =   8.920501e-01

Photon flux (15-150 keV)    in 109.5 sec: 0.595136 ( -0.022305  0.020961 ) ph/cm2/s
Energy fluence (15-150 keV)             : 4.38949e-06 ( -1.65394e-07  1.50906e-07 ) ergs/cm2
1-s peak spectrum fit
Power-law model
Time interval is from   87.088 sec. to   88.088 sec.

Spectral model in power-law:
------------------------------------------------------------
Parameters  : value       lower 90%   higher 90%
Photon index: -1.71435     ( -0.0877074   0.0865982 )
Norm@50keV  : 3.39026E-02    ( -0.00168576   0.00167608 )
------------------------------------------------------------
#Fit statistic : Chi-Squared =          46.72 using 59 PHA bins.
# Reduced chi-squared =         0.8196 for     57 degrees of freedom
# Null hypothesis probability =   8.326569e-01

Photon flux (15-150 keV)    in 1 sec: 4.52565 ( -0.21816  0.21863 ) ph/cm2/s
Energy fluence (15-150 keV)             : 3.13603e-07 ( -1.63064e-08  1.63864e-08 ) ergs/cm2
Cutoff power-law model
Time interval is from   87.088 sec. to   88.088 sec.
Spectral model in the cutoff power-law:
------------------------------------------------------------
Parameters  : value       lower 90%   higher 90%
Photon index: -1.66236     ( -0.131324   0.285562 )
Epeak [keV] : 320.500      (   )
Norm@50keV  : 3.60452E-02    (     )
------------------------------------------------------------
#Fit statistic : Chi-Squared =          46.76 using 59 PHA bins.
# Reduced chi-squared =         0.8349 for     56 degrees of freedom
# Null hypothesis probability =   8.058455e-01

Photon flux (15-150 keV)    in 1 sec: 4.52369 ( -0.23126  0.22002 ) ph/cm2/s
Energy fluence (15-150 keV)             : 3.1317e-07 ( -1.78791e-08  1.66675e-08 ) ergs/cm2
Time-resolved spectra
Distribution
T90 vs. Hardness ratio plot
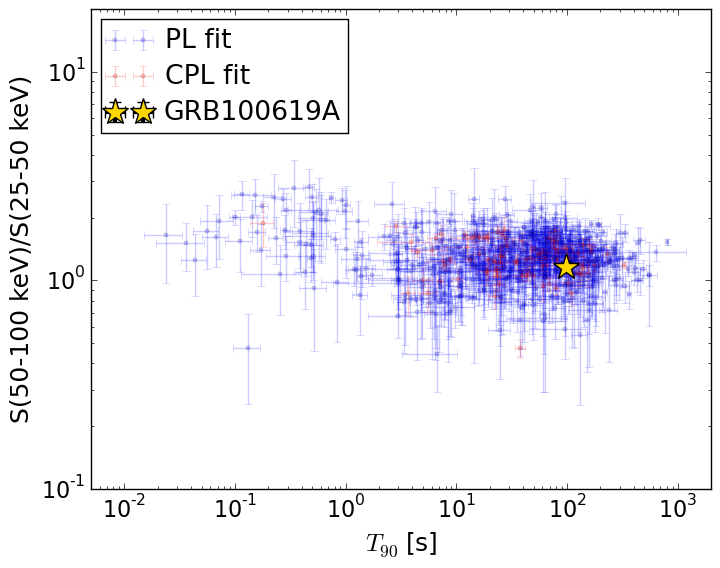
T90                                   = 97.7 sec.
Hardness ratio (energy fluence ratio) = 1.16458119453
S(15-50 keV) vs. S(50-150 keV) plot
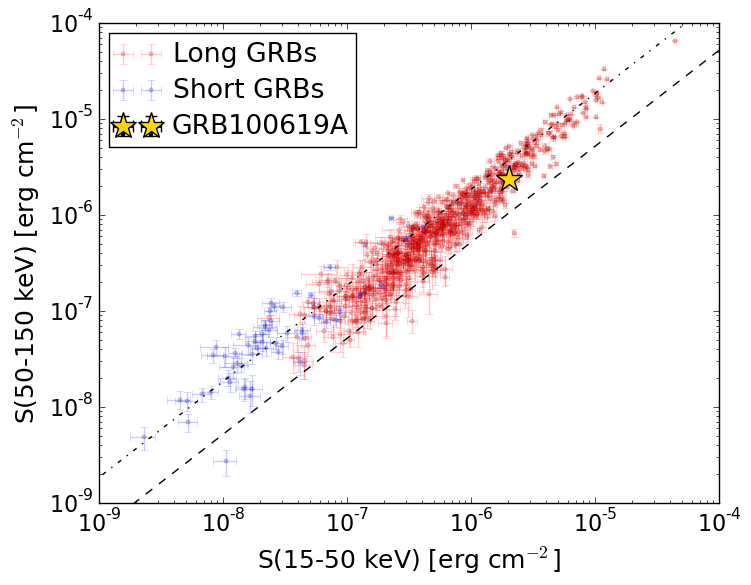
S(15-50 keV)  = 2.0258628e-06
S(50-150 keV) = 2.3795744e-06
The dash-dotted line and the dashed line traces the fluences calculated from the Band function with Epeak = 15 and 150 keV, respectively. Both lines assume a canonical values of alpha = -1 and beta = -2.5.
Mask shadow pattern
IMX = -6.138684640147498E-01, IMY = -2.175451350063735E-02
Spacecraft aspect plot
Bright source in the pre-burst/pre-slew/post-slew images
Pre-burst image of 15-350 keV band
Time interval of the image:
-11.051400 -2.948000

# RAcent  DECcent POSerr Theta    Phi  PeakCts   SNR AngSep     Name
#  [deg]    [deg]    ['] [deg]  [deg]                   [']
135.6770 -40.5569    8.6  29.5   83.3   0.0673   1.3    6.8	Vela X-1
 81.8756 -57.6726    2.3  48.9  137.5   0.7317   5.1 ------	UNKNOWN
161.1026 -32.6147    2.4  43.4   54.3   0.6483   4.8 ------	UNKNOWN
152.6768  20.1203    2.0  50.7  -20.7   0.4084   5.6 ------	UNKNOWN
 79.2753  -5.5602    2.9  38.1 -144.4   0.1655   3.9 ------	UNKNOWN
Pre-slew background subtracted image of 15-350 keV band
Time interval of the image:
-2.948000 10.948590

# RAcent  DECcent POSerr Theta    Phi  PeakCts   SNR AngSep     Name
#  [deg]    [deg]    ['] [deg]  [deg]                   [']
135.5892 -40.5432    5.8  29.5   83.4   0.2353   2.0    2.9	Vela X-1
 59.9041 -42.7913    2.3  54.8  162.2   1.9801   5.1 ------	UNKNOWN
158.6146 -12.8933    2.5  40.7   24.8   0.6508   4.6 ------	UNKNOWN
 91.8397 -38.3786    2.2  31.1  153.1   0.4817   5.1 ------	UNKNOWN
 55.7131 -30.3470    2.0  57.1  177.5   2.3629   5.8 ------	UNKNOWN
 84.6177 -27.0119    0.4  31.6  178.0   2.5168  30.2 ------	UNKNOWN
Post-slew image of 15-350 keV band
Time interval of the image:
65.548600 962.918100

# RAcent  DECcent POSerr Theta    Phi  PeakCts   SNR AngSep     Name
#  [deg]    [deg]    ['] [deg]  [deg]                   [']
135.5251 -40.5526    1.3  43.8   28.4  10.5149   9.1    0.2	Vela X-1
 27.5524 -15.2249    4.7  54.1  177.1   5.2862   2.5 ------	UNKNOWN
 55.7579 -26.1100    2.9  25.8  172.2   2.0768   4.0 ------	UNKNOWN
 84.6149 -27.0037    1.0   0.0 -152.6   6.0982  11.6 ------	UNKNOWN
133.5455   3.6573    4.8  56.3  -28.4   7.9200   2.4 ------	UNKNOWN