Analysis Summary
Notes:
- 1) No attempt has been made to eliminate the non-significant decimal places.
- 2) This batgrbproduct analysis is done using the HEASARC data.
- 3) This batgrbproduct analysis is using the flight position for the mask-weighting calculation.
======================================================================
                  BAT GRB EVENT DATA PROCESSING REPORT
    Process Script Ver: batgrbproduct v2.46
    Process Start Time: Fri Jan 17 17:56:21 EST 2014
             Host Name: batevent1
   Current Working Dir: /local/data/batevent/batevent_reproc/trigger425151
======================================================================

  Trigger: 00425151      Segment: 000

  BAT Trigger Time: 298782218.752   [s; MET]
      Trigger Stop: 298782219.776   [s; MET]
               UTC: 2010-06-21T03:03:32.840140    [includes UTCF correction]
       Where From?: TDRSS position message

  BAT
    RA: 315.308020107616   Dec: -51.0864237917052  [deg; J2000]

     Catalogged Source?: NO
     Point Source?:      YES
     GRB Indicated?:     YES    [ by BAT flight software ]
     Image S/N Ratio:    18.67
     Image Trigger?:     NO
     Rate S/N Ratio:     58.7537232862735  [ if not an image trigger ]
     Image S/N Ratio:    18.67

  Analysis Position:   [ source = BAT ]
    RA: 315.308020107616   Dec: -51.0864237917052  [deg; J2000]

  Refined Position:   [ source = BAT pre-slew burst ]
    RA: 315.309092390252   Dec: -51.1023517510873  [deg; J2000]
        { 21h 01m 14.2s , -51d 06' 08.5" }
         +/- 0.503316638038972 [arcmin] (estimated 90% radius based on SNR)
         +/- 0.112951456530024 [arcmin] (formal 1-sigma fit error)
    SNR: 81.1071980715528

  Angular difference between the analysis and refined position is 0.956531 arcmin

  Partial Coding Fraction: 0.9765625    [ including projection effects ]

  Duration
     T90: 63.5519999265671 +/- 1.7075502970681
        Measured from: 1.216000020504
                   to: 64.7679999470711     [s; relative to TRIGTIME]
     T50: 25.7599999904633 +/- 0.703659018375438
        Measured from: 17.9160000085831
                   to: 43.6759999990463     [s; relative to TRIGTIME]


  Fluence
     Peak Flux  (peak 1 second)
        Measured from: 24.4640000462532
                   to: 25.4640000462532     [s; relative to TRIGTIME]
     Total Fluence
        Measured from: -6.09999996423721
                   to: 204.284000039101     [s; relative to TRIGTIME]

             Band 1     Band 2     Band 3     Band 4
              15-25      25-50     50-100    100-350     keV
 Total    14.200694  14.645488   8.395227   1.628453
           0.093607   0.095211   0.081402   0.064791 [error]
 Peak      0.438457   0.633156   0.450316   0.071301
           0.010801   0.012574   0.011135   0.006423 [error]

     [ fluence units of on-axis counts / fully illuminated detector ]

======================================================================


====== Table of the duration information =============================

        Value   tstart    tstop
T100  210.384   -6.100  204.284
T90    63.552    1.216   64.768
T50    25.760   17.916   43.676
Peak    1.000   24.464   25.464


====== Spectral Analysis Summary =====================================

Model      : spectral model: simple power-law (PL) and cutoff power-law (CPL)
Ph_index   : photon index: E^{Ph_index}
Ph_90err   : 90% error of the photon index
Epeak      : Epeak in keV
Epeak_90err: 90% error of Epeak
Norm       : normalization at 50 keV in both the PL model and CPL model
Nomr_90err : 90% error of the normalization
chi2       : Chi-Squared
dof        : degree of freedo

=== Time-averaged spectral analysis ===
(Best model with acceptable fit: PL)

Model Ph_index Ph_90err_low Ph_90err_hi  Epeak  Epeak_90err_low  Epeak_90err_hi  Norm       Nomr_90err_low    Norm_90err_hi    chi2    dof
PL      -1.896    -0.030      0.030       -           -               -         1.06e-02     -1.55e-04          1.55e-04      46.460   57
CPL     -1.812    -0.101      0.123      129.012     -44.238      -129.012      1.15e-02     -1.01e-03          1.45e-03      45.050   56


=== 1-s peak spectral analysis ===
(Best model with acceptable fit: CPL)

Model Ph_index Ph_90err_low Ph_90err_hi  Epeak  Epeak_90err_low  Epeak_90err_hi  Norm       Nomr_90err_low    Norm_90err_hi    chi2    dof
PL      -1.574     -0.047     0.047       -           -               -         1.03e-01     -2.71e-03          2.71e-03      71.210   57
CPL     -0.946     -0.205     0.214       90.632     -10.613        18.579      2.02e-01     -3.91e-02          5.12e-02      41.400   56


=== Fluence/Peak Flux Summary ===

              Model    Band1     Band2     Band3     Band4     Band5     Total
                       15-25     25-50    50-100    100-350    15-150    15-350    keV
Fluence         PL   4.15e-06  5.99e-06  6.44e-06  1.29e-05  2.06e-05  2.94e-05   erg/cm2
      90%_error_low -1.37e-07 -1.12e-07 -1.10e-07 -5.21e-07 -3.00e-07 -5.52e-07   erg/cm2
      90%_error_hi   1.39e-07  1.12e-07  1.10e-07  5.36e-07  3.00e-07  5.60e-07   erg/cm2
Peak flux       PL   4.55e+00  4.38e+00  2.94e+00  3.09e+00  1.31e+01  1.50e+01   ph/cm2/s
      90%_error_low -2.24e-01 -1.31e-01 -9.38e-02 -2.01e-01 -3.74e-01 -3.93e-01   ph/cm2/s
      90%_error_hi   2.28e-01  1.31e-01  9.35e-02  2.10e-01  3.75e-01  3.93e-01   ph/cm2/s

Fluence        CPL   4.04e-06  6.00e-06  6.48e-06  1.17e-05  2.04e-05  2.82e-05   erg/cm2
      90%_error_low -1.97e-07 -1.13e-07 -1.26e-07 -1.49e-06 -3.56e-07 -1.58e-06   erg/cm2
      90%_error_hi   2.00e-07  1.13e-07  1.27e-07  1.35e-06  3.56e-07  1.49e-06   erg/cm2
Peak flux      CPL   3.91e+00  4.53e+00  3.12e+00  1.76e+00  1.26e+01  1.33e+01   ph/cm2/s
      90%_error_low -2.85e-01 -1.45e-01 -1.12e-01 -2.78e-01 -4.02e-01 -5.15e-01   ph/cm2/s
      90%_error_hi   2.91e-01  1.46e-01  1.13e-01  3.35e-01  4.04e-01  5.45e-01   ph/cm2/s

======================================================================
Image
Pre-slew 15.0-350.0 keV image (Event data)
#   RAcent    DECcent   POSerr    Theta     Phi              Peak Cts       SNR   Name
  315.3091   -51.1024   0.0024    17.0519  -145.1946         6.6285699     81.107 TRIG_00425151

Foreground time interval of the image:
 -6.100  12.349 (delta_t =  18.449 [sec])
Background time interval of the image:
-43.051  -6.100 (delta_t =  36.951 [sec])
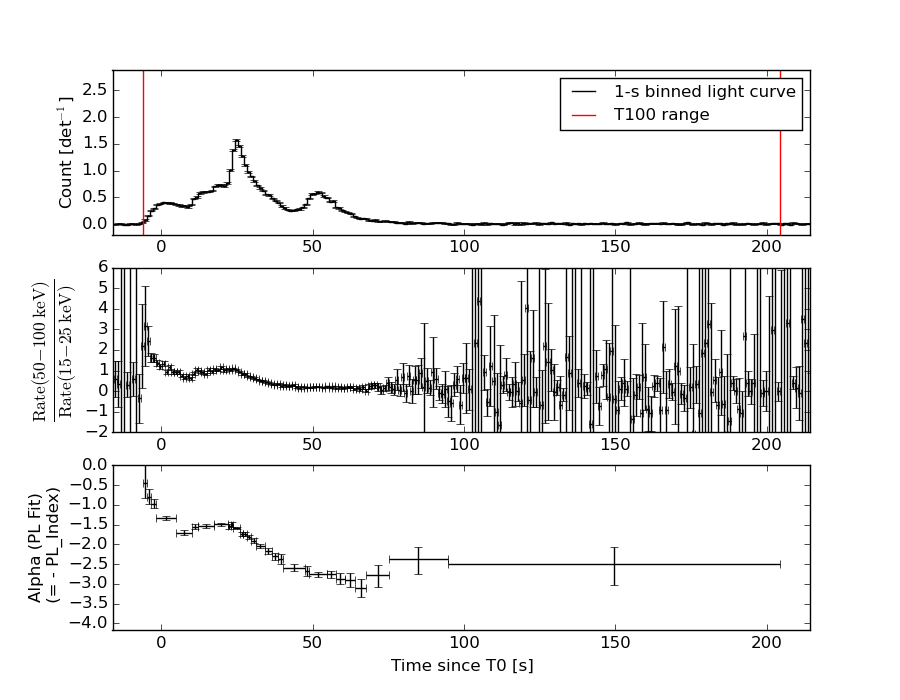
Light Curves
Note: The mask-weighted lightcurves have units of either count/det or counts/sec/det, where a det is 0.4 x 0.4 = 0.16 sq cm.
Full-time range; 1 s binning
Other quick-look light curves:
- 64 ms binning (zoomed)
- 16 ms binning (zoomed)
- 8 ms binning (zoomed)
- 2 ms binning (zoomed)
- SN=5 or 10 s binning (full-time range)
- Raw light curve
Spectra
- 64 ms binning (zoomed)
- 16 ms binning (zoomed)
- 8 ms binning (zoomed)
- 2 ms binning (zoomed)
- SN=5 or 10 s binning (full-time range)
- Raw light curve
Spectra
Notes:
- 1) The fitting includes the systematic errors.
- 2) When the burst includes telescope slew time periods, the fitting uses an average response file made from multiple 5-s response files through out the slew time plus single time preiod for the non-slew times, and weighted by the total counts in the corresponding time period using addrmf. An average response file is needed becuase a spectral fit using the pre-slew DRM will introduce some errors in both a spectral shape and a normalization if the PHA file contains a lot of the slew/post-slew time interval.
- 3) For fits to more complicated models (e.g. a power-law over a cutoff power-law), the BAT team has decided to require a chi-square improvement of more than 6 for each extra dof.
Time averaged spectrum fit using the average DRM
Power-law model
Time interval is from   -6.100 sec. to  204.284 sec.

Spectral model in power-law:
------------------------------------------------------------
Parameters  : value       lower 90%   higher 90%
Photon index: -1.89639     ( -0.0299899   0.0299908 )
Norm@50keV  : 1.06253E-02    ( -0.000155008   0.000154966 )
------------------------------------------------------------
#Fit statistic : Chi-Squared =          46.46 using 59 PHA bins.
# Reduced chi-squared =         0.8151 for     57 degrees of freedom
# Null hypothesis probability =   8.394287e-01

Photon flux (15-150 keV)    in 210.4 sec: 1.52261 ( -0.03086  0.03107 ) ph/cm2/s
Energy fluence (15-150 keV)             : 2.05559e-05 ( -3.00241e-07  3.00357e-07 ) ergs/cm2
Cutoff power-law model
Time interval is from   -6.100 sec. to  204.284 sec.
Spectral model in the cutoff power-law:
------------------------------------------------------------
Parameters  : value       lower 90%   higher 90%
Photon index: -1.81205     ( -0.101087   0.123363 )
Epeak [keV] : 129.012      ( -44.2383 -129.012 )
Norm@50keV  : 1.15437E-02    ( -0.00101035   0.00145056 )
------------------------------------------------------------
#Fit statistic : Chi-Squared =          45.05 using 59 PHA bins.
# Reduced chi-squared =         0.8045 for     56 degrees of freedom
# Null hypothesis probability =   8.524033e-01

Photon flux (15-150 keV)    in 210.4 sec: 1.55375 ( -0.03996  0.02646 ) ph/cm2/s
Energy fluence (15-150 keV)             : 2.04186e-05 ( -3.55591e-07  3.55685e-07 ) ergs/cm2
1-s peak spectrum fit
Power-law model
Time interval is from   24.464 sec. to   25.464 sec.

Spectral model in power-law:
------------------------------------------------------------
Parameters  : value       lower 90%   higher 90%
Photon index: -1.57351     ( -0.0469984   0.0468215 )
Norm@50keV  : 0.102938    ( -0.00271548   0.00271466 )
------------------------------------------------------------
#Fit statistic : Chi-Squared =          71.21 using 59 PHA bins.
# Reduced chi-squared =          1.249 for     57 degrees of freedom
# Null hypothesis probability =   9.760124e-02

Photon flux (15-150 keV)    in 1 sec: 13.1222 ( -0.3739  0.3747 ) ph/cm2/s
Energy fluence (15-150 keV)             : 9.66073e-07 ( -2.67823e-08  2.68144e-08 ) ergs/cm2
Cutoff power-law model
Time interval is from   24.464 sec. to   25.464 sec.
Spectral model in the cutoff power-law:
------------------------------------------------------------
Parameters  : value       lower 90%   higher 90%
Photon index: -0.945834     ( -0.204878   0.214484 )
Epeak [keV] : 90.6319      ( -10.6126 18.5793 )
Norm@50keV  : 0.202246    ( -0.0391478   0.0512324 )
------------------------------------------------------------
#Fit statistic : Chi-Squared =          41.40 using 59 PHA bins.
# Reduced chi-squared =         0.7394 for     56 degrees of freedom
# Null hypothesis probability =   9.274075e-01

Photon flux (15-150 keV)    in 1 sec: 12.6050 ( -0.4021  0.4043 ) ph/cm2/s
Energy fluence (15-150 keV)             : 9.31816e-07 ( -2.92894e-08  2.91986e-08 ) ergs/cm2
Time-resolved spectra
Distribution
T90 vs. Hardness ratio plot
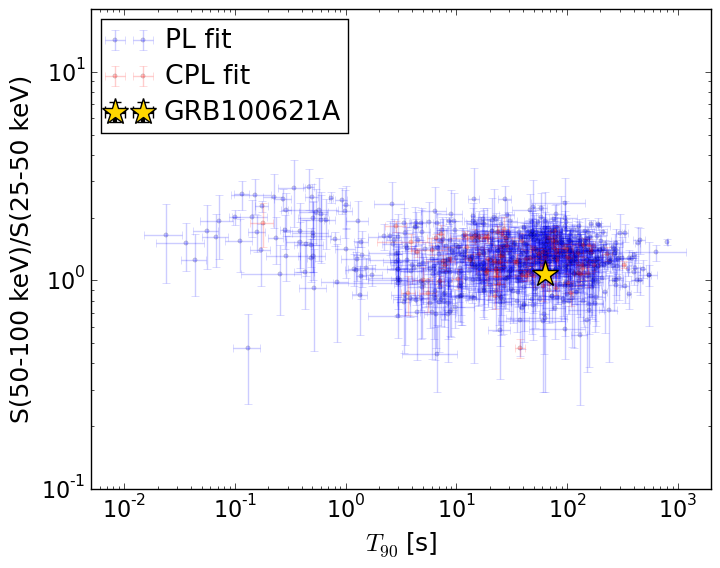
T90                                   = 63.552 sec.
Hardness ratio (energy fluence ratio) = 1.07448439257
S(15-50 keV) vs. S(50-150 keV) plot
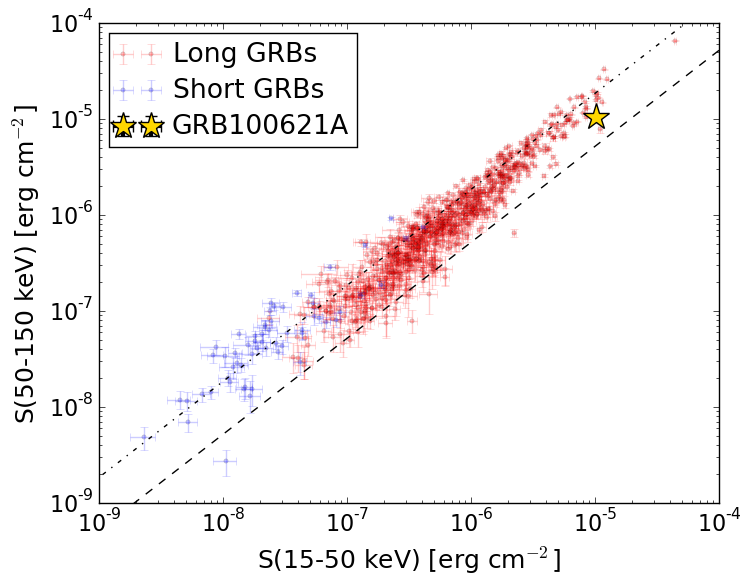
S(15-50 keV)  = 1.0136216e-05
S(50-150 keV) = 1.0419646e-05
The dash-dotted line and the dashed line traces the fluences calculated from the Band function with Epeak = 15 and 150 keV, respectively. Both lines assume a canonical values of alpha = -1 and beta = -2.5.
Mask shadow pattern
IMX = -2.518474948484013E-01, IMY = 1.750738530211234E-01
Spacecraft aspect plot
Bright source in the pre-burst/pre-slew/post-slew images
Pre-burst image of 15-350 keV band
Time interval of the image:
-43.051390 -6.100000

# RAcent  DECcent POSerr Theta    Phi  PeakCts   SNR AngSep     Name
#  [deg]    [deg]    ['] [deg]  [deg]                   [']
186.6832 -62.6059    7.8  51.5  -33.7  -0.3464  -1.5    9.9	GX 301-2
255.7977 -37.8981  242.0  26.1   36.6  -0.0039  -0.0    9.5	4U 1700-377
256.3994 -36.3947    3.8  26.7   39.9   0.2568   3.1    2.4	GX 349+2
262.9742 -24.7572   11.1  32.1   64.1   0.1295   1.0    2.0	GX 1+4
264.6606 -44.5707   72.9  16.9   31.4  -0.0107  -0.2    8.1	4U 1735-44
270.2652 -25.0132    4.1  28.8   75.5   0.3079   2.8    4.1	GX 5-1
270.1462 -25.6992    5.5  28.2   74.7   0.2195   2.1    8.8	GRS 1758-258
274.1444 -14.1568   47.1  37.8   88.4  -0.0603  -0.2   10.8	GX 17+2
276.0760 -30.3107    2.6  21.9   81.8   0.3890   4.5    8.5	H1820-303
285.0242 -24.8772   11.3  25.4  104.2   0.0935   1.0    2.7	HT1900.1-2455
262.8182 -33.8046    4.1  24.8   52.7   0.2392   2.8    8.7	GX 354-0
283.9196 -82.0349    2.0  31.9  -67.7   0.5578   5.6 ------	UNKNOWN
 54.7357 -86.7996    2.4  41.8  -72.7   1.2500   4.8 ------	UNKNOWN
  6.2481 -53.0505    1.9  46.0 -123.6   1.8578   5.9 ------	UNKNOWN
 13.3795 -74.7917    3.8  40.9  -92.3   0.8903   3.1 ------	UNKNOWN
Pre-slew background subtracted image of 15-350 keV band
Time interval of the image:
-6.100000 12.348610

# RAcent  DECcent POSerr Theta    Phi  PeakCts   SNR AngSep     Name
#  [deg]    [deg]    ['] [deg]  [deg]                   [']
186.6586 -62.8635   13.1  51.4  -33.9   0.2441   0.9    5.6	GX 301-2
256.0841 -37.8955   15.1  25.9   37.0   0.0827   0.8    5.6	4U 1700-377
256.3177 -36.2856   46.1  26.8   40.0  -0.0284  -0.3   10.0	GX 349+2
263.0833 -24.5874    7.6  32.2   64.5   0.2523   1.5   10.3	GX 1+4
264.5604 -44.4512    9.8  17.0   31.6   0.1029   1.2    7.8	4U 1735-44
270.1404 -25.1068   15.6  28.7   75.2   0.1075   0.7    8.0	GX 5-1
270.4704 -25.8590    7.8  27.9   75.1  -0.2027  -1.5   11.4	GRS 1758-258
273.8844 -14.0516    6.4  38.0   88.0   0.5805   1.8    7.1	GX 17+2
276.1191 -30.4781    6.8  21.7   81.7  -0.1844  -1.7   12.1	H1820-303
284.9503 -25.1022    0.0  25.2  104.0  -0.0640  -0.5   11.9	HT1900.1-2455
262.8222 -33.9779    7.0  24.7   52.4  -0.1847  -1.6   12.0	GX 354-0
317.7454 -23.5382    2.5  35.1  162.8   0.5715   4.6 ------	UNKNOWN
334.6154 -23.0413    2.1  44.9 -178.4   0.8459   5.6 ------	UNKNOWN
315.3091 -51.1024    0.1  17.1 -145.2   6.6287  81.1 ------	UNKNOWN
344.7023 -25.2943    2.5  49.6 -167.2   0.8454   4.6 ------	UNKNOWN
Post-slew image of 15-350 keV band
Time interval of the image:
63.948600 962.310700

# RAcent  DECcent POSerr Theta    Phi  PeakCts   SNR AngSep     Name
#  [deg]    [deg]    ['] [deg]  [deg]                   [']
264.6830 -44.6548   68.4  33.9   60.1  -0.1574  -0.2   12.6	4U 1735-44
275.8095 -30.4206    3.3  35.7   89.5   4.7770   3.4    6.8	H1820-303
285.2624 -24.9164    0.0  34.8  106.8  -0.5373  -0.4   12.3	HT1900.1-2455
318.3813   3.1903    2.4  54.3  163.2  11.7935   4.8 ------	UNKNOWN
321.5875   2.9018    3.1  54.3  167.2   9.3490   3.7 ------	UNKNOWN
276.0790 -57.9690    3.2  23.4   37.1   1.8813   3.6 ------	UNKNOWN
315.2469 -51.0764    1.8   0.0   95.1   3.1830   6.5 ------	UNKNOWN
321.9823 -37.6805    3.8  14.2 -178.6   1.4319   3.1 ------	UNKNOWN
339.1104 -24.6826    4.1  32.1 -156.9   1.6938   2.8 ------	UNKNOWN
113.9639 -71.6828    3.7  56.3  -28.5  11.3463   3.2 ------	UNKNOWN