Analysis Summary
Notes:
- 1) No attempt has been made to eliminate the non-significant decimal places.
- 2) This batgrbproduct analysis is done using the HEASARC data.
- 3) This batgrbproduct analysis is using the flight position for the mask-weighting calculation.
======================================================================
BAT GRB EVENT DATA PROCESSING REPORT
Process Script Ver: batgrbproduct v2.46
Process Start Time: Thu Sep 11 11:14:43 EDT 2014
Host Name: batevent1
Current Working Dir: /local/data/batevent/batevent_reproc/trigger425647
======================================================================
Trigger: 00425647 Segment: 000
BAT Trigger Time: 299183554.304 [s; MET]
Trigger Stop: 299183554.56 [s; MET]
UTC: 2010-06-25T18:32:28.377940 [includes UTCF correction]
Where From?: TDRSS position message
BAT
RA: 15.7708589285121 Dec: -39.0829393330905 [deg; J2000]
Catalogged Source?: NO
Point Source?: YES
GRB Indicated?: YES [ by BAT flight software ]
Image S/N Ratio: 15.27
Image Trigger?: NO
Rate S/N Ratio: 93.2469838654313 [ if not an image trigger ]
Image S/N Ratio: 15.27
Analysis Position: [ source = BAT ]
RA: 15.7708589285121 Dec: -39.0829393330905 [deg; J2000]
Refined Position: [ source = BAT pre-slew burst ]
RA: 15.7953236747917 Dec: -39.09191298843 [deg; J2000]
{ 01h 03m 10.9s , -39d 05' 30.9" }
+/- 1.05073147786973 [arcmin] (estimated 90% radius based on SNR)
+/- 0.303704918290393 [arcmin] (formal 1-sigma fit error)
SNR: 28.3410469731656
Angular difference between the analysis and refined position is 1.260164 arcmin
Partial Coding Fraction: 1 [ including projection effects ]
Duration
T90: 0.331999957561493 +/- 0.0368781685195268
Measured from: -0.0480000376701355
to: 0.283999919891357 [s; relative to TRIGTIME]
T50: 0.167999982833862 +/- 0.0178885001041659
Measured from: 0.0399999618530273
to: 0.20799994468689 [s; relative to TRIGTIME]
Fluence
Peak Flux (peak 1 second)
Measured from: -0.368000030517578
to: 0.631999969482422 [s; relative to TRIGTIME]
Total Fluence
Measured from: -0.0680000185966492
to: 0.328000009059906 [s; relative to TRIGTIME]
Band 1 Band 2 Band 3 Band 4
15-25 25-50 50-100 100-350 keV
Total 0.055112 0.105774 0.116167 0.042381
0.005317 0.005656 0.006141 0.005017 [error]
Peak 0.052671 0.125188 0.120020 0.041731
0.007473 0.007231 0.007278 0.006096 [error]
[ fluence units of on-axis counts / fully illuminated detector ]
======================================================================
====== Table of the duration information =============================
Value tstart tstop
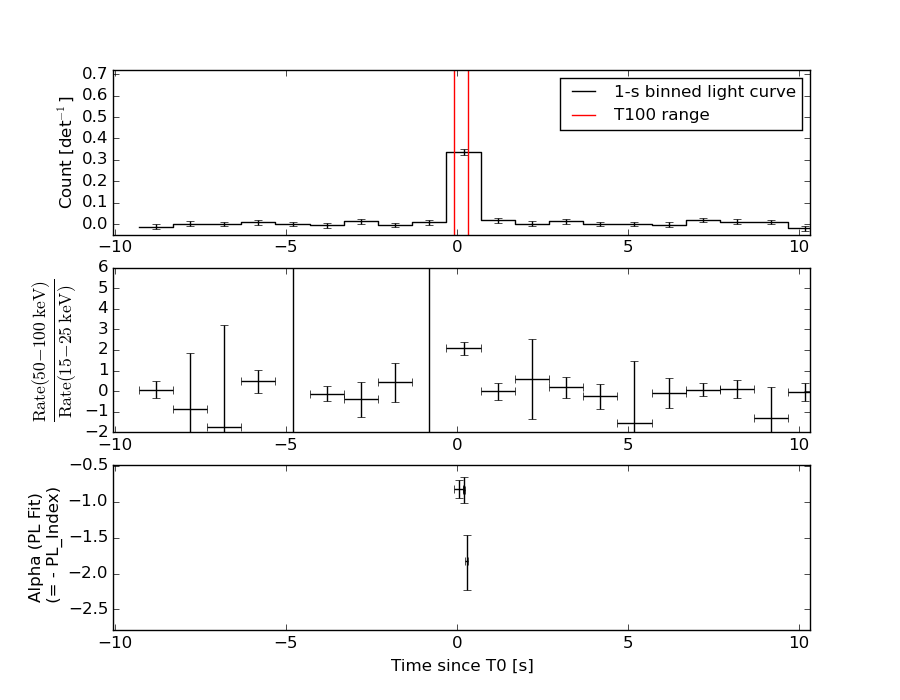
T100 0.396 -0.068 0.328
T90 0.332 -0.048 0.284
T50 0.168 0.040 0.208
Peak 1.000 -0.368 0.632
====== Spectral Analysis Summary =====================================
Model : spectral model: simple power-law (PL) and cutoff power-law (CPL)
Ph_index : photon index: E^{Ph_index}
Ph_90err : 90% error of the photon index
Epeak : Epeak in keV
Epeak_90err: 90% error of Epeak
Norm : normalization at 50 keV in both the PL model and CPL model
Nomr_90err : 90% error of the normalization
chi2 : Chi-Squared
dof : degree of freedo
=== Time-averaged spectral analysis ===
(Best model with acceptable fit: N/A)
Model Ph_index Ph_90err_low Ph_90err_hi Epeak Epeak_90err_low Epeak_90err_hi Norm Nomr_90err_low Norm_90err_hi chi2 dof
PL -0.889 -0.102 0.103 - - - 5.24e-02 -2.99e-03 2.99e-03 73.710 57
CPL -0.724 -0.211 0.427 446.613 -446.613 -446.613 6.20e-02 -1.19e-02 3.26e-02 73.210 56
=== 1-s peak spectral analysis ===
(Best model with acceptable fit: N/A)
Model Ph_index Ph_90err_low Ph_90err_hi Epeak Epeak_90err_low Epeak_90err_hi Norm Nomr_90err_low Norm_90err_hi chi2 dof
PL -0.922 -0.118 0.120 - - - 2.24e-02 -1.47e-03 1.47e-03 80.540 57
CPL -0.736 -0.241 0.486 391.375 -391.375 -391.375 2.70e-02 -5.81e-03 1.65e-02 80.030 56
=== Fluence/Peak Flux Summary ===
Model Band1 Band2 Band3 Band4 Band5 Total
15-25 25-50 50-100 100-350 15-150 15-350 keV
Fluence PL 1.50e-08 4.02e-08 8.67e-08 4.88e-07 2.34e-07 6.30e-07 erg/cm2
90%_error_low -1.73e-09 -2.79e-09 -5.58e-09 -6.99e-08 -1.50e-08 -7.32e-08 erg/cm2
90%_error_hi 1.81e-09 2.76e-09 5.55e-09 7.80e-08 1.51e-08 8.04e-08 erg/cm2
Peak flux PL 5.31e-01 7.54e-01 7.96e-01 1.55e+00 2.57e+00 3.63e+00 ph/cm2/s
90%_error_low -7.33e-02 -6.41e-02 -5.57e-02 -2.31e-01 -1.70e-01 -2.66e-01 ph/cm2/s
90%_error_hi 7.74e-02 6.36e-02 5.54e-02 2.59e-01 1.70e-01 2.74e-01 ph/cm2/s
Fluence CPL 1.44e-08 4.06e-08 8.83e-08 3.88e-07 2.32e-07 5.31e-07 erg/cm2
90%_error_low -2.21e-09 -2.82e-09 -6.56e-09 -1.60e-07 -1.60e-08 -1.59e-07 erg/cm2
90%_error_hi 1.83e-09 3.03e-09 6.72e-09 1.76e-07 1.54e-08 1.20e-07 erg/cm2
Peak flux CPL 5.04e-01 7.61e-01 8.13e-01 1.27e+00 2.54e+00 3.35e+00 ph/cm2/s
90%_error_low -9.36e-02 -6.65e-02 -6.55e-02 -4.69e-01 -1.78e-01 -5.07e-01 ph/cm2/s
90%_error_hi 8.10e-02 6.72e-02 6.87e-02 3.51e-01 1.78e-01 4.44e-01 ph/cm2/s
======================================================================
Image
Pre-slew 15.0-350.0 keV image (Event data)
#   RAcent    DECcent   POSerr    Theta     Phi              Peak Cts       SNR   Name
   15.7953   -39.0919   0.0068     2.0795   -17.4411         0.3202201     28.341 TRIG_00425647

Foreground time interval of the image:
 -0.068   0.328 (delta_t =   0.396 [sec])
Background time interval of the image:
-239.304  -0.068 (delta_t = 239.236 [sec])
Light Curves
Note: The mask-weighted lightcurves have units of either count/det or counts/sec/det, where a det is 0.4 x 0.4 = 0.16 sq cm.
Full-time range; 1 s binning
Other quick-look light curves:
- 64 ms binning (zoomed)
- 16 ms binning (zoomed)
- 8 ms binning (zoomed)
- 2 ms binning (zoomed)
- SN=5 or 10 s binning (full-time range)
- Raw light curve
Spectra
- 64 ms binning (zoomed)
- 16 ms binning (zoomed)
- 8 ms binning (zoomed)
- 2 ms binning (zoomed)
- SN=5 or 10 s binning (full-time range)
- Raw light curve
Spectra
Notes:
- 1) The fitting includes the systematic errors.
- 2) When the burst includes telescope slew time periods, the fitting uses an average response file made from multiple 5-s response files through out the slew time plus single time preiod for the non-slew times, and weighted by the total counts in the corresponding time period using addrmf. An average response file is needed becuase a spectral fit using the pre-slew DRM will introduce some errors in both a spectral shape and a normalization if the PHA file contains a lot of the slew/post-slew time interval.
- 3) For fits to more complicated models (e.g. a power-law over a cutoff power-law), the BAT team has decided to require a chi-square improvement of more than 6 for each extra dof.
Time averaged spectrum fit using the average DRM
Power-law model
Time interval is from   -0.068 sec. to    0.328 sec.

Spectral model in power-law:
------------------------------------------------------------
Parameters  : value       lower 90%   higher 90%
Photon index: -0.889202     ( -0.101956   0.103162 )
Norm@50keV  : 5.23686E-02    ( -0.00299319   0.00298501 )
------------------------------------------------------------
#Fit statistic : Chi-Squared =          73.71 using 59 PHA bins.
# Reduced chi-squared =          1.293 for     57 degrees of freedom
# Null hypothesis probability =   6.745055e-02

Photon flux (15-150 keV)    in 0.396 sec: 0.348156 (    ) ph/cm2/s
Energy fluence (15-150 keV)             : 2.33741e-07 ( -1.49673e-08  1.50503e-08 ) ergs/cm2
Cutoff power-law model
Time interval is from   -0.068 sec. to    0.328 sec.
Spectral model in the cutoff power-law:
------------------------------------------------------------
Parameters  : value       lower 90%   higher 90%
Photon index: -0.724474     ( -0.211146   0.427077 )
Epeak [keV] : 446.613      ( -446.622 -446.622 )
Norm@50keV  : 6.19740E-02    ( -0.0119018   0.0326322 )
------------------------------------------------------------
#Fit statistic : Chi-Squared =          73.21 using 59 PHA bins.
# Reduced chi-squared =          1.307 for     56 degrees of freedom
# Null hypothesis probability =   6.105317e-02

Photon flux (15-150 keV)    in 0.396 sec: 5.96930 ( -0.35718  0.35611 ) ph/cm2/s
Energy fluence (15-150 keV)             : 2.3163e-07 ( -1.6037e-08  1.54427e-08 ) ergs/cm2
1-s peak spectrum fit
Power-law model
Time interval is from   -0.368 sec. to    0.632 sec.

Spectral model in power-law:
------------------------------------------------------------
Parameters  : value       lower 90%   higher 90%
Photon index: -0.922313     ( -0.11804   0.120325 )
Norm@50keV  : 2.23604E-02    ( -0.00147295   0.00146815 )
------------------------------------------------------------
#Fit statistic : Chi-Squared =          80.54 using 59 PHA bins.
# Reduced chi-squared =          1.413 for     57 degrees of freedom
# Null hypothesis probability =   2.175967e-02

Photon flux (15-150 keV)    in 1 sec: 2.56723 ( -0.16997  0.17025 ) ph/cm2/s
Energy fluence (15-150 keV)             : 2.48828e-07 ( -1.76694e-08  1.77658e-08 ) ergs/cm2
Cutoff power-law model
Time interval is from   -0.368 sec. to    0.632 sec.
Spectral model in the cutoff power-law:
------------------------------------------------------------
Parameters  : value       lower 90%   higher 90%
Photon index: -0.735541     ( -0.241188   0.486472 )
Epeak [keV] : 391.375      ( -391.396 -391.396 )
Norm@50keV  : 2.70216E-02    ( -0.00581058   0.0164712 )
------------------------------------------------------------
#Fit statistic : Chi-Squared =          80.03 using 59 PHA bins.
# Reduced chi-squared =          1.429 for     56 degrees of freedom
# Null hypothesis probability =   1.923312e-02

Photon flux (15-150 keV)    in 1 sec: 2.54430 ( -0.17826  0.17824 ) ph/cm2/s
Energy fluence (15-150 keV)             : 2.46122e-07 ( -1.91042e-08  1.85207e-08 ) ergs/cm2
Time-resolved spectra
Distribution
T90 vs. Hardness ratio plot
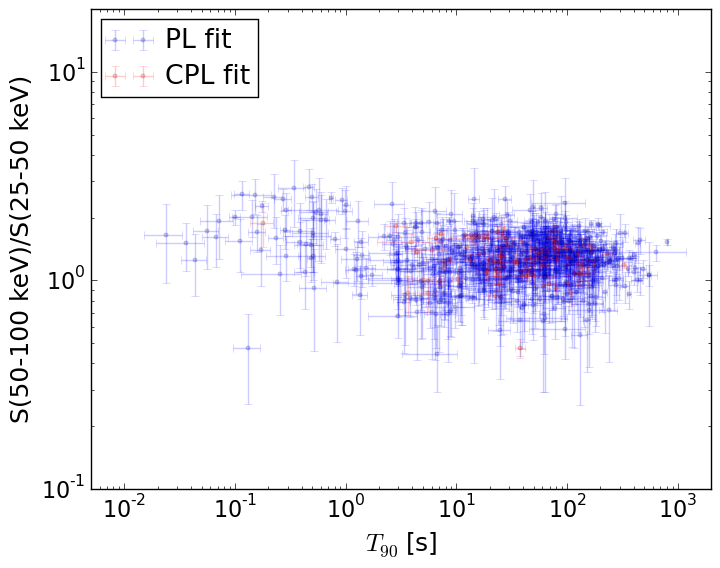
T90                                   = N/A sec.
Hardness ratio (energy fluence ratio) = N/A
S(15-50 keV) vs. S(50-150 keV) plot
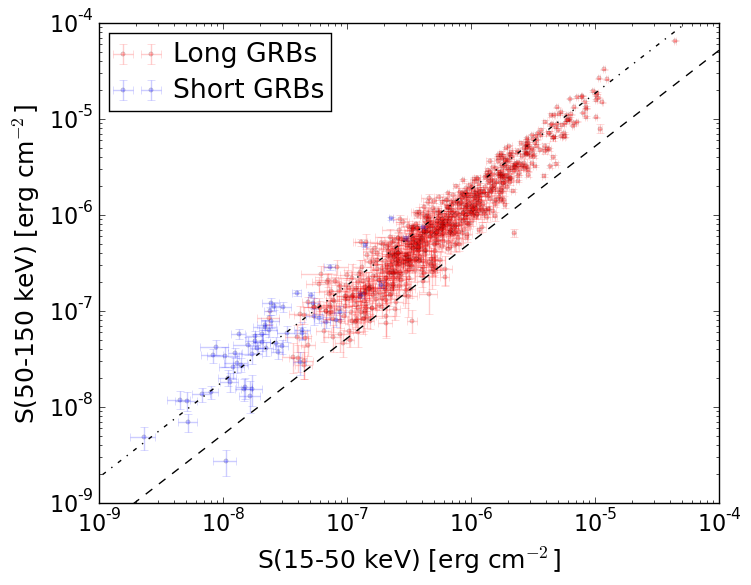
S(15-50 keV)  = N/A
S(50-150 keV) = N/A
The dash-dotted line and the dashed line traces the fluences calculated from the Band function with Epeak = 15 and 150 keV, respectively. Both lines assume a canonical values of alpha = -1 and beta = -2.5.
Mask shadow pattern
IMX = 3.464113287164557E-02, IMY = 1.088317170812843E-02
Spacecraft aspect plot
Bright source in the pre-burst/pre-slew/post-slew images
Pre-burst image of 15-350 keV band
Time interval of the image:
-239.304000 -0.068000

# RAcent  DECcent POSerr Theta    Phi  PeakCts   SNR AngSep     Name
#  [deg]    [deg]    ['] [deg]  [deg]                   [']
 17.5768 -35.6480    2.4   3.7  -92.6   1.0123   4.8 ------	UNKNOWN
Pre-slew background subtracted image of 15-350 keV band
Time interval of the image:
-0.068000 0.328000

# RAcent  DECcent POSerr Theta    Phi  PeakCts   SNR AngSep     Name
#  [deg]    [deg]    ['] [deg]  [deg]                   [']
 15.7953 -39.0919    0.4   2.1  -17.4   0.3202  28.3 ------	UNKNOWN
 45.6624  -8.7600    2.2  40.8  -96.4   0.2425   5.3 ------	UNKNOWN
Post-slew image of 15-350 keV band
Time interval of the image:
32.596600 722.966000

# RAcent  DECcent POSerr Theta    Phi  PeakCts   SNR AngSep     Name
#  [deg]    [deg]    ['] [deg]  [deg]                   [']
331.8588 -33.3268    3.2  35.6  110.7   2.7331   3.6 ------	UNKNOWN
346.1289 -71.5044    2.0  35.7   40.9   3.0860   5.7 ------	UNKNOWN
  5.4003  19.1346    3.7  59.0 -166.2   6.9233   3.1 ------	UNKNOWN
 24.1353  15.6601    5.0  55.3 -144.9   4.7895   2.3 ------	UNKNOWN