Analysis Summary
Notes:
- 1) No attempt has been made to eliminate the non-significant decimal places.
- 2) This batgrbproduct analysis is done using the HEASARC data.
- 3) This batgrbproduct analysis is using the flight position for the mask-weighting calculation.
======================================================================
                  BAT GRB EVENT DATA PROCESSING REPORT
    Process Script Ver: batgrbproduct v2.46
    Process Start Time: Fri Jan 17 17:38:52 EST 2014
             Host Name: batevent1
   Current Working Dir: /local/data/batevent/batevent_reproc/trigger426722
======================================================================

  Trigger: 00426722      Segment: 000

  BAT Trigger Time: 299907314.688   [s; MET]
      Trigger Stop: 299907315.712   [s; MET]
               UTC: 2010-07-04T03:35:08.736120    [includes UTCF correction]
       Where From?: TDRSS position message

  BAT
    RA: 133.636084668684   Dec: -24.215664518349  [deg; J2000]

     Catalogged Source?: NO
     Point Source?:      YES
     GRB Indicated?:     YES    [ by BAT flight software ]
     Image S/N Ratio:    19.73
     Image Trigger?:     NO
     Rate S/N Ratio:     65.1229606206597  [ if not an image trigger ]
     Image S/N Ratio:    19.73

  Analysis Position:   [ source = BAT ]
    RA: 133.636084668684   Dec: -24.215664518349  [deg; J2000]

  Refined Position:   [ source = BAT pre-slew burst ]
    RA: 133.638896150471   Dec: -24.2020599517235  [deg; J2000]
        { 08h 54m 33.3s , -24d 12' 07.4" }
         +/- 0.749354311143117 [arcmin] (estimated 90% radius based on SNR)
         +/- 0.243220178932577 [arcmin] (formal 1-sigma fit error)
    SNR: 45.9342522601641

  Angular difference between the analysis and refined position is 0.830647 arcmin

  Partial Coding Fraction: 0.8515625    [ including projection effects ]

  Duration
     T90: 196.879999935627 +/- 23.3820091959079
        Measured from: -15.2919999957085
                   to: 181.587999939919     [s; relative to TRIGTIME]
     T50: 147.767999947071 +/- 2.15029298909376
        Measured from: 0.635999977588654
                   to: 148.40399992466     [s; relative to TRIGTIME]


  Fluence
     Peak Flux  (peak 1 second)
        Measured from: 0.755999982357025
                   to: 1.75599998235703     [s; relative to TRIGTIME]
     Total Fluence
        Measured from: -62.3360000252724
                   to: 202.303999960423     [s; relative to TRIGTIME]

             Band 1     Band 2     Band 3     Band 4
              15-25      25-50     50-100    100-350     keV
 Total     3.146032   3.852070   2.474684   0.578185
           0.091496   0.094037   0.082058   0.070167 [error]
 Peak      0.094021   0.179907   0.203786   0.053360
           0.007437   0.008828   0.009070   0.006420 [error]

     [ fluence units of on-axis counts / fully illuminated detector ]

======================================================================


====== Table of the duration information =============================

        Value   tstart    tstop
T100  264.640  -62.336  202.304
T90   196.880  -15.292  181.588
T50   147.768    0.636  148.404
Peak    1.000    0.756    1.756


====== Spectral Analysis Summary =====================================

Model      : spectral model: simple power-law (PL) and cutoff power-law (CPL)
Ph_index   : photon index: E^{Ph_index}
Ph_90err   : 90% error of the photon index
Epeak      : Epeak in keV
Epeak_90err: 90% error of Epeak
Norm       : normalization at 50 keV in both the PL model and CPL model
Nomr_90err : 90% error of the normalization
chi2       : Chi-Squared
dof        : degree of freedo

=== Time-averaged spectral analysis ===
(Best model with acceptable fit: PL)

Model Ph_index Ph_90err_low Ph_90err_hi  Epeak  Epeak_90err_low  Epeak_90err_hi  Norm       Nomr_90err_low    Norm_90err_hi    chi2    dof
PL      -1.701    -0.063      0.062       -           -               -         2.39e-03     -7.74e-05          7.71e-05      59.550   57
CPL     -1.655    -0.077      0.248      381.753    -381.731      -381.753      2.51e-03     -1.98e-04          7.87e-04      59.440   56


=== 1-s peak spectral analysis ===
(Best model with acceptable fit: PL)

Model Ph_index Ph_90err_low Ph_90err_hi  Epeak  Epeak_90err_low  Epeak_90err_hi  Norm       Nomr_90err_low    Norm_90err_hi    chi2    dof
PL      -0.995     -0.084     0.085       -           -               -         3.73e-02     -1.87e-03          1.87e-03      64.240   57
CPL     -0.565     -0.346     0.375      194.067     -64.174       483.021      5.79e-02     -1.69e-02          2.59e-02      59.670   56


=== Fluence/Peak Flux Summary ===

              Model    Band1     Band2     Band3     Band4     Band5     Total
                       15-25     25-50    50-100    100-350    15-150    15-350    keV
Fluence         PL   9.73e-07  1.58e-06  1.95e-06  4.73e-06  5.85e-06  9.23e-06   erg/cm2
      90%_error_low -5.79e-08 -5.42e-08 -8.47e-08 -4.46e-07 -1.98e-07 -5.02e-07   erg/cm2
      90%_error_hi   5.92e-08  5.40e-08  8.45e-08  4.78e-07  1.98e-07  5.27e-07   erg/cm2
Peak flux       PL   9.49e-01  1.29e+00  1.30e+00  2.35e+00  4.30e+00  5.89e+00   ph/cm2/s
      90%_error_low -9.45e-02 -8.05e-02 -6.98e-02 -2.60e-01 -2.19e-01 -3.20e-01   ph/cm2/s
      90%_error_hi   9.81e-02  8.00e-02  6.95e-02  2.80e-01  2.19e-01  3.25e-01   ph/cm2/s

Fluence        CPL   9.64e-07  1.59e-06  1.95e-06  4.40e-06  5.82e-06  8.91e-06   erg/cm2
      90%_error_low -7.34e-08 -5.82e-08 -8.74e-08 -1.34e-06 -2.33e-07 -1.36e-06   erg/cm2
      90%_error_hi   5.83e-08  6.10e-08  8.83e-08  4.18e-07  2.16e-07  7.19e-07   erg/cm2
Peak flux      CPL   8.47e-01  1.32e+00  1.37e+00  1.57e+00  4.23e+00  5.10e+00   ph/cm2/s
      90%_error_low -1.20e-01 -8.68e-02 -9.01e-02 -4.16e-01 -2.25e-01 -4.75e-01   ph/cm2/s
      90%_error_hi   1.24e-01  8.76e-02  9.12e-02  6.08e-01  2.25e-01  6.30e-01   ph/cm2/s

======================================================================
Image
Pre-slew 15.0-350.0 keV image (Event data)
#   RAcent    DECcent   POSerr    Theta     Phi              Peak Cts       SNR   Name
  133.6389   -24.2021   0.0042    29.9478  -157.5173         5.5867027     45.934 TRIG_00426722

Foreground time interval of the image:
-62.336  13.813 (delta_t =  76.149 [sec])
Background time interval of the image:
-487.487 -481.569 (delta_t =   5.919 [sec])
-239.688 -62.336 (delta_t = 177.352 [sec])
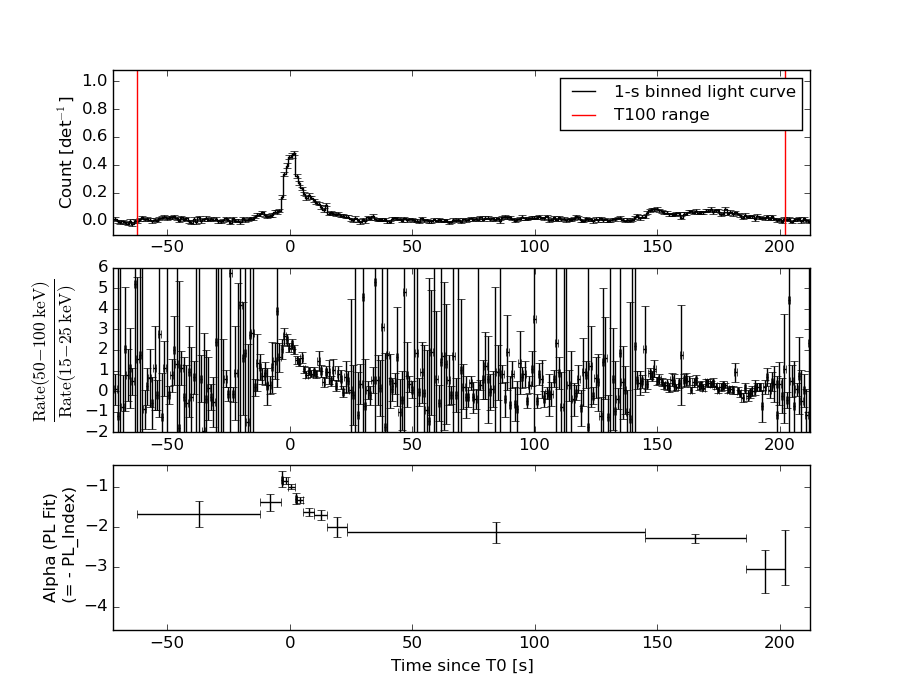
Light Curves
Note: The mask-weighted lightcurves have units of either count/det or counts/sec/det, where a det is 0.4 x 0.4 = 0.16 sq cm.
Full-time range; 1 s binning
Other quick-look light curves:
- 64 ms binning (zoomed)
- 16 ms binning (zoomed)
- 8 ms binning (zoomed)
- 2 ms binning (zoomed)
- SN=5 or 10 s binning (full-time range)
- Raw light curve
Spectra
- 64 ms binning (zoomed)
- 16 ms binning (zoomed)
- 8 ms binning (zoomed)
- 2 ms binning (zoomed)
- SN=5 or 10 s binning (full-time range)
- Raw light curve
Spectra
Notes:
- 1) The fitting includes the systematic errors.
- 2) When the burst includes telescope slew time periods, the fitting uses an average response file made from multiple 5-s response files through out the slew time plus single time preiod for the non-slew times, and weighted by the total counts in the corresponding time period using addrmf. An average response file is needed becuase a spectral fit using the pre-slew DRM will introduce some errors in both a spectral shape and a normalization if the PHA file contains a lot of the slew/post-slew time interval.
- 3) For fits to more complicated models (e.g. a power-law over a cutoff power-law), the BAT team has decided to require a chi-square improvement of more than 6 for each extra dof.
Time averaged spectrum fit using the average DRM
Power-law model
Time interval is from  -62.336 sec. to  202.304 sec.

Spectral model in power-law:
------------------------------------------------------------
Parameters  : value       lower 90%   higher 90%
Photon index: -1.70067     ( -0.0626346   0.0623133 )
Norm@50keV  : 2.38570E-03    ( -7.73665e-05   7.71427e-05 )
------------------------------------------------------------
#Fit statistic : Chi-Squared =          59.55 using 59 PHA bins.
# Reduced chi-squared =          1.045 for     57 degrees of freedom
# Null hypothesis probability =   3.831467e-01

Photon flux (15-150 keV)    in 264.6 sec: 0.316934 ( -0.010929  0.010987 ) ph/cm2/s
Energy fluence (15-150 keV)             : 5.8452e-06 ( -1.97522e-07  1.9818e-07 ) ergs/cm2
Cutoff power-law model
Time interval is from  -62.336 sec. to  202.304 sec.
Spectral model in the cutoff power-law:
------------------------------------------------------------
Parameters  : value       lower 90%   higher 90%
Photon index: -1.65464     ( -0.0763926   0.248128 )
Epeak [keV] : 381.753      ( -383.289 -383.311 )
Norm@50keV  : 2.51273E-03    ( -0.000197329   0.000787255 )
------------------------------------------------------------
#Fit statistic : Chi-Squared =          59.44 using 59 PHA bins.
# Reduced chi-squared =          1.061 for     56 degrees of freedom
# Null hypothesis probability =   3.514801e-01

Photon flux (15-150 keV)    in 264.6 sec: 0.315802 ( -0.012328  0.011848 ) ph/cm2/s
Energy fluence (15-150 keV)             : 5.82131e-06 ( -2.33004e-07  2.16371e-07 ) ergs/cm2
1-s peak spectrum fit
Power-law model
Time interval is from    0.756 sec. to    1.756 sec.

Spectral model in power-law:
------------------------------------------------------------
Parameters  : value       lower 90%   higher 90%
Photon index: -0.995313     ( -0.0844373   0.0852793 )
Norm@50keV  : 3.73156E-02    ( -0.0018732   0.00187066 )
------------------------------------------------------------
#Fit statistic : Chi-Squared =          64.24 using 59 PHA bins.
# Reduced chi-squared =          1.127 for     57 degrees of freedom
# Null hypothesis probability =   2.378539e-01

Photon flux (15-150 keV)    in 1 sec: 4.29506 ( -0.21915  0.21935 ) ph/cm2/s
Energy fluence (15-150 keV)             : 4.04222e-07 ( -2.18201e-08  2.18863e-08 ) ergs/cm2
Cutoff power-law model
Time interval is from    0.756 sec. to    1.756 sec.
Spectral model in the cutoff power-law:
------------------------------------------------------------
Parameters  : value       lower 90%   higher 90%
Photon index: -0.565382     ( -0.345898   0.375353 )
Epeak [keV] : 194.067      ( -64.1731 483.022 )
Norm@50keV  : 5.78547E-02    ( -0.0168607   0.0258727 )
------------------------------------------------------------
#Fit statistic : Chi-Squared =          59.67 using 59 PHA bins.
# Reduced chi-squared =          1.066 for     56 degrees of freedom
# Null hypothesis probability =   3.436891e-01

Photon flux (15-150 keV)    in 1 sec: 4.23380 ( -0.22455  0.22463 ) ph/cm2/s
Energy fluence (15-150 keV)             : 3.97878e-07 ( -2.29395e-08  2.28196e-08 ) ergs/cm2
Time-resolved spectra
Distribution
T90 vs. Hardness ratio plot
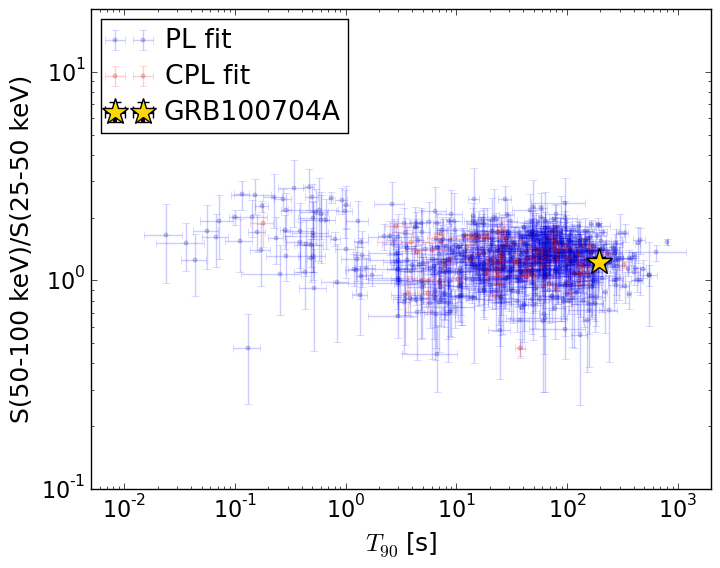
T90                                   = 196.88 sec.
Hardness ratio (energy fluence ratio) = 1.23058080829
S(15-50 keV) vs. S(50-150 keV) plot
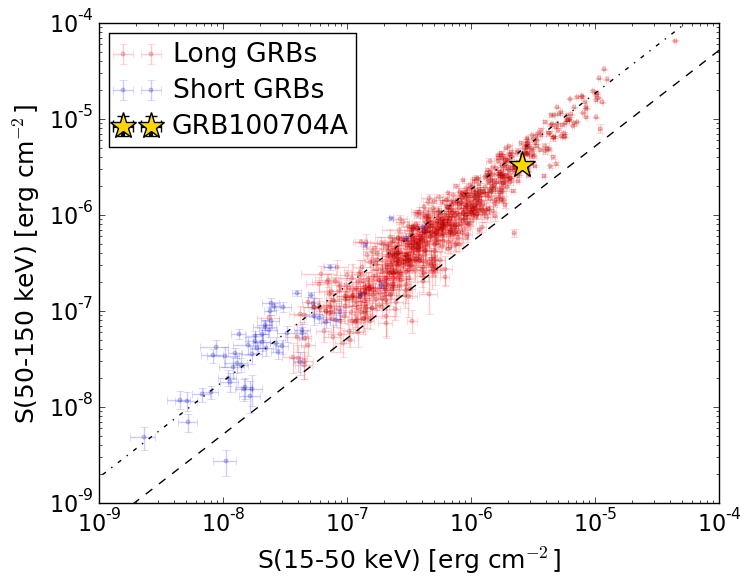
S(15-50 keV)  = 2.5561512e-06
S(50-150 keV) = 3.289078e-06
The dash-dotted line and the dashed line traces the fluences calculated from the Band function with Epeak = 15 and 150 keV, respectively. Both lines assume a canonical values of alpha = -1 and beta = -2.5.
Mask shadow pattern
IMX = -5.323468459206683E-01, IMY = 2.203174341108559E-01
Spacecraft aspect plot
Bright source in the pre-burst/pre-slew/post-slew images
Pre-burst image of 15-350 keV band
Time interval of the image:
-487.487410 -481.568600
-239.688000 -62.336000

# RAcent  DECcent POSerr Theta    Phi  PeakCts   SNR AngSep     Name
#  [deg]    [deg]    ['] [deg]  [deg]                   [']
135.5619 -40.5743    1.3  41.9 -177.1   2.0369   8.7    1.9	Vela X-1
183.5704  18.2055    2.4  34.9   32.9   1.1731   4.8 ------	UNKNOWN
176.3556  31.4752    3.2  39.6    9.5   0.9043   3.7 ------	UNKNOWN
108.2649 -16.2369    2.8  48.0 -129.1   2.7240   4.1 ------	UNKNOWN
Pre-slew background subtracted image of 15-350 keV band
Time interval of the image:
-62.336000 13.812630

# RAcent  DECcent POSerr Theta    Phi  PeakCts   SNR AngSep     Name
#  [deg]    [deg]    ['] [deg]  [deg]                   [']
135.4525 -40.5289    6.1  41.9 -177.0   0.3548   1.9    3.8	Vela X-1
133.6389 -24.2021    0.3  29.9 -157.5   5.5861  45.9 ------	UNKNOWN
125.2623   8.1405    2.1  31.6  -89.4   1.0441   5.5 ------	UNKNOWN
111.3168 -28.2707    1.9  49.0 -145.6   1.7664   6.1 ------	UNKNOWN
Post-slew image of 15-350 keV band
Time interval of the image:
74.812590 962.392000

# RAcent  DECcent POSerr Theta    Phi  PeakCts   SNR AngSep     Name
#  [deg]    [deg]    ['] [deg]  [deg]                   [']
135.5315 -40.5479    0.4  16.4  119.7  15.7289  27.4    0.4	Vela X-1
178.0967 -38.3544    2.5  40.1   66.2   8.3055   4.6 ------	UNKNOWN
148.5843 -41.8897    2.6  21.6   93.3   2.5723   4.4 ------	UNKNOWN
133.6447 -24.2097    1.3   0.0 -107.9   4.6425   8.7 ------	UNKNOWN
129.7585  -6.7393    3.9  17.9  -68.0   1.5333   3.0 ------	UNKNOWN
110.7062  -2.7069    3.3  30.9 -104.7   2.4103   3.5 ------	UNKNOWN