Analysis Summary
Notes:
- 1) No attempt has been made to eliminate the non-significant decimal places.
- 2) This batgrbproduct analysis is done using the HEASARC data.
- 3) This batgrbproduct analysis is using the flight position for the mask-weighting calculation.
======================================================================
BAT GRB EVENT DATA PROCESSING REPORT
Process Script Ver: batgrbproduct v2.46
Process Start Time: Fri Jan 17 17:26:09 EST 2014
Host Name: batevent1
Current Working Dir: /local/data/batevent/batevent_reproc/trigger429868
======================================================================
Trigger: 00429868 Segment: 000
BAT Trigger Time: 301624945.216 [s; MET]
Trigger Stop: 301624946.24 [s; MET]
UTC: 2010-07-24T00:42:19.202780 [includes UTCF correction]
Where From?: TDRSS position message
BAT
RA: 194.566197960917 Dec: -11.1213088935374 [deg; J2000]
Catalogged Source?: NO
Point Source?: YES
GRB Indicated?: YES [ by BAT flight software ]
Image S/N Ratio: 10.55
Image Trigger?: NO
Rate S/N Ratio: 19.157244060668 [ if not an image trigger ]
Image S/N Ratio: 10.55
Analysis Position: [ source = BAT ]
RA: 194.566197960917 Dec: -11.1213088935374 [deg; J2000]
Refined Position: [ source = BAT pre-slew burst ]
RA: 194.568537601933 Dec: -11.0943885705126 [deg; J2000]
{ 12h 58m 16.4s , -11d 05' 39.8" }
+/- 1.70400275741798 [arcmin] (estimated 90% radius based on SNR)
+/- 0.652239998894621 [arcmin] (formal 1-sigma fit error)
SNR: 14.2051731743885
Angular difference between the analysis and refined position is 1.621082 arcmin
Partial Coding Fraction: 0.4335938 [ including projection effects ]
Duration
T90: 1.38799995183945 +/- 0.15579471580594
Measured from: 0.148000001907349
to: 1.5359999537468 [s; relative to TRIGTIME]
T50: 0.675999999046326 +/- 0.202385728029818
Measured from: 0.387999951839447
to: 1.06399995088577 [s; relative to TRIGTIME]
Fluence
Peak Flux (peak 1 second)
Measured from: 0.0879999995231628
to: 1.08799999952316 [s; relative to TRIGTIME]
Total Fluence
Measured from: 0.0839999914169312
to: 1.64800000190735 [s; relative to TRIGTIME]
Band 1 Band 2 Band 3 Band 4
15-25 25-50 50-100 100-350 keV
Total 0.089869 0.124246 0.055702 0.010843
0.010600 0.011411 0.010617 0.009438 [error]
Peak 0.060697 0.097649 0.049617 0.005354
0.008619 0.009437 0.008718 0.007336 [error]
[ fluence units of on-axis counts / fully illuminated detector ]
======================================================================
====== Table of the duration information =============================
Value tstart tstop
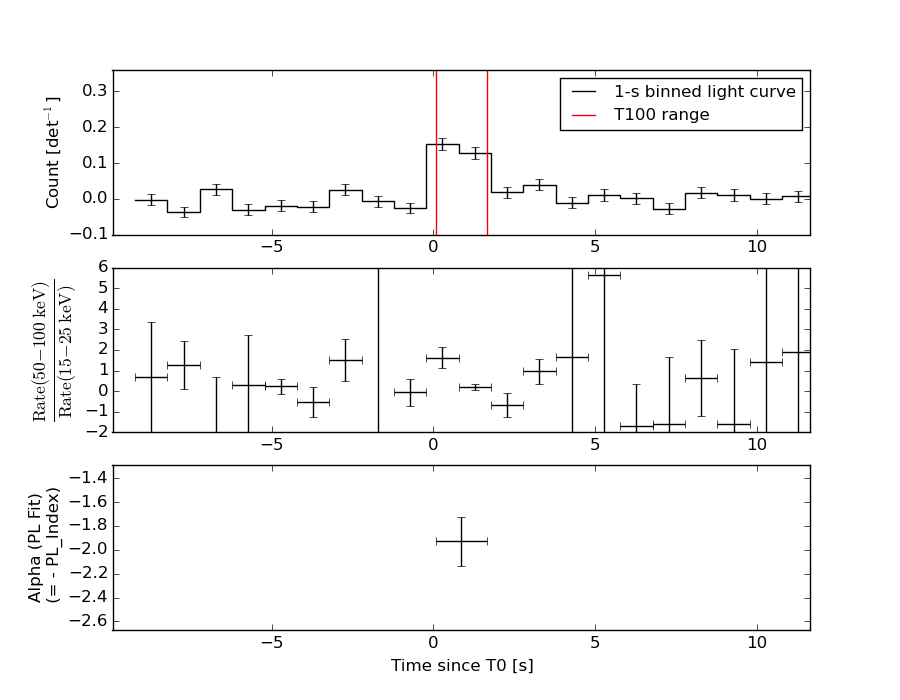
T100 1.564 0.084 1.648
T90 1.388 0.148 1.536
T50 0.676 0.388 1.064
Peak 1.000 0.088 1.088
====== Spectral Analysis Summary =====================================
Model : spectral model: simple power-law (PL) and cutoff power-law (CPL)
Ph_index : photon index: E^{Ph_index}
Ph_90err : 90% error of the photon index
Epeak : Epeak in keV
Epeak_90err: 90% error of Epeak
Norm : normalization at 50 keV in both the PL model and CPL model
Nomr_90err : 90% error of the normalization
chi2 : Chi-Squared
dof : degree of freedo
=== Time-averaged spectral analysis ===
(Best model with acceptable fit: PL)
Model Ph_index Ph_90err_low Ph_90err_hi Epeak Epeak_90err_low Epeak_90err_hi Norm Nomr_90err_low Norm_90err_hi chi2 dof
PL -1.923 -0.214 0.201 - - - 1.12e-02 -1.63e-03 1.60e-03 55.030 57
CPL -0.505 -1.047 1.275 42.500 -8.198 15.177 7.65e-02 -7.65e-02 3.59e-01 49.420 56
=== 1-s peak spectral analysis ===
(Best model with acceptable fit: PL)
Model Ph_index Ph_90err_low Ph_90err_hi Epeak Epeak_90err_low Epeak_90err_hi Norm Nomr_90err_low Norm_90err_hi chi2 dof
PL -1.846 -0.218 0.206 - - - 1.35e-02 -2.03e-03 2.00e-03 52.420 57
CPL 0.037 -1.125 1.409 45.155 -7.092 11.797 1.63e-01 -1.63e-01 8.98e-01 43.250 56
=== Fluence/Peak Flux Summary ===
Model Band1 Band2 Band3 Band4 Band5 Total
15-25 25-50 50-100 100-350 15-150 15-350 keV
Fluence PL 3.34e-08 4.74e-08 5.00e-08 9.75e-08 1.61e-07 2.28e-07 erg/cm2
90%_error_low -5.20e-09 -5.51e-09 -9.67e-09 -3.25e-08 -2.26e-08 -4.46e-08 erg/cm2
90%_error_hi 5.33e-09 5.50e-09 9.90e-09 4.17e-08 2.31e-08 5.19e-08 erg/cm2
Peak flux PL 7.74e-01 6.35e-01 3.53e-01 2.90e-01 1.89e+00 2.05e+00 ph/cm2/s
90%_error_low -1.33e-01 -7.95e-02 -6.77e-02 -9.30e-02 -2.37e-01 -2.62e-01 ph/cm2/s
90%_error_hi 1.37e-01 7.95e-02 6.86e-02 1.16e-01 2.37e-01 2.63e-01 ph/cm2/s
Fluence CPL 3.00e-08 5.57e-08 4.50e-08 1.28e-08 1.41e-07 1.44e-07 erg/cm2
90%_error_low -6.06e-09 -8.07e-09 -1.30e-08 -9.83e-09 -2.24e-08 -2.46e-08 erg/cm2
90%_error_hi 6.03e-09 8.22e-09 1.24e-08 3.78e-08 2.57e-08 4.36e-08 erg/cm2
Peak flux CPL 6.43e-01 7.79e-01 3.42e-01 4.10e-02 1.80e+00 1.81e+00 ph/cm2/s
90%_error_low -1.58e-01 -1.14e-01 -9.13e-02 -4.10e-02 -2.38e-01 -2.41e-01 ph/cm2/s
90%_error_hi 1.60e-01 1.18e-01 8.71e-02 8.22e-02 2.40e-01 2.46e-01 ph/cm2/s
======================================================================
Image
Pre-slew 15.0-350.0 keV image (Event data)
#   RAcent    DECcent   POSerr    Theta     Phi              Peak Cts       SNR   Name
  194.5685   -11.0944   0.0136    33.6283    38.4928         0.3046063     14.205 TRIG_00429868

Foreground time interval of the image:
  0.084   1.648 (delta_t =   1.564 [sec])
Background time interval of the image:
-239.216   0.084 (delta_t = 239.300 [sec])
Light Curves
Note: The mask-weighted lightcurves have units of either count/det or counts/sec/det, where a det is 0.4 x 0.4 = 0.16 sq cm.
Full-time range; 1 s binning
Other quick-look light curves:
- 64 ms binning (zoomed)
- 16 ms binning (zoomed)
- 8 ms binning (zoomed)
- 2 ms binning (zoomed)
- SN=5 or 10 s binning (full-time range)
- Raw light curve
Spectra
- 64 ms binning (zoomed)
- 16 ms binning (zoomed)
- 8 ms binning (zoomed)
- 2 ms binning (zoomed)
- SN=5 or 10 s binning (full-time range)
- Raw light curve
Spectra
Notes:
- 1) The fitting includes the systematic errors.
- 2) When the burst includes telescope slew time periods, the fitting uses an average response file made from multiple 5-s response files through out the slew time plus single time preiod for the non-slew times, and weighted by the total counts in the corresponding time period using addrmf. An average response file is needed becuase a spectral fit using the pre-slew DRM will introduce some errors in both a spectral shape and a normalization if the PHA file contains a lot of the slew/post-slew time interval.
- 3) For fits to more complicated models (e.g. a power-law over a cutoff power-law), the BAT team has decided to require a chi-square improvement of more than 6 for each extra dof.
Time averaged spectrum fit using the average DRM
Power-law model
Time interval is from    0.084 sec. to    1.648 sec.

Spectral model in power-law:
------------------------------------------------------------
Parameters  : value       lower 90%   higher 90%
Photon index: -1.92336     ( -0.21394   0.201199 )
Norm@50keV  : 1.12170E-02    ( -0.00163388   0.00159966 )
------------------------------------------------------------
#Fit statistic : Chi-Squared =          55.03 using 59 PHA bins.
# Reduced chi-squared =         0.9655 for     57 degrees of freedom
# Null hypothesis probability =   5.492685e-01

Photon flux (15-150 keV)    in 1.564 sec: 1.62606 ( -0.1868  0.18681 ) ph/cm2/s
Energy fluence (15-150 keV)             : 1.61367e-07 ( -2.25682e-08  2.31286e-08 ) ergs/cm2
Cutoff power-law model
Time interval is from    0.084 sec. to    1.648 sec.
Spectral model in the cutoff power-law:
------------------------------------------------------------
Parameters  : value       lower 90%   higher 90%
Photon index: -0.505062     ( -1.04667   1.2754 )
Epeak [keV] : 42.4999      ( -8.19851 15.1766 )
Norm@50keV  : 7.65264E-02    ( -0.0765289   0.359076 )
------------------------------------------------------------
#Fit statistic : Chi-Squared =          49.42 using 59 PHA bins.
# Reduced chi-squared =         0.8825 for     56 degrees of freedom
# Null hypothesis probability =   7.204400e-01

Photon flux (15-150 keV)    in 1.564 sec: 1.55381 ( -0.1908  0.19236 ) ph/cm2/s
Energy fluence (15-150 keV)             : 1.41006e-07 ( -2.24379e-08  2.57331e-08 ) ergs/cm2
1-s peak spectrum fit
Power-law model

Time interval is from    0.088 sec. to    1.088 sec.

Spectral model in power-law:
------------------------------------------------------------
Parameters  : value       lower 90%   higher 90%
Photon index: -1.84621     ( -0.218292   0.205874 )
Norm@50keV  : 1.34781E-02    ( -0.00203382   0.00199546 )
------------------------------------------------------------
#Fit statistic : Chi-Squared =          52.42 using 59 PHA bins.
# Reduced chi-squared =         0.9197 for     57 degrees of freedom
# Null hypothesis probability =   6.473129e-01

Photon flux (15-150 keV)    in 1 sec: 1.89169 ( -0.23664  0.23665 ) ph/cm2/s
Energy fluence (15-150 keV)             : 1.23954e-07 ( -1.85056e-08  1.89124e-08 ) ergs/cm2
Cutoff power-law model
Time interval is from    0.088 sec. to    1.088 sec.
Spectral model in the cutoff power-law:
------------------------------------------------------------
Parameters  : value       lower 90%   higher 90%
Photon index: 0.037099     ( -1.12505   1.40878 )
Epeak [keV] : 45.1547      ( -7.09223 11.7971 )
Norm@50keV  : 0.162792    ( -0.162794   0.898274 )
------------------------------------------------------------
#Fit statistic : Chi-Squared =          43.25 using 59 PHA bins.
# Reduced chi-squared =         0.7724 for     56 degrees of freedom
# Null hypothesis probability =   8.935842e-01

Photon flux (15-150 keV)    in 1 sec: 1.80066 ( -0.23843  0.24006 ) ph/cm2/s
Energy fluence (15-150 keV)             : 1.07436e-07 ( -1.74448e-08  1.95249e-08 ) ergs/cm2
Time-resolved spectra
Distribution
T90 vs. Hardness ratio plot

T90                                   = 1.388 sec.
Hardness ratio (energy fluence ratio) = 1.054629777
S(15-50 keV) vs. S(50-150 keV) plot
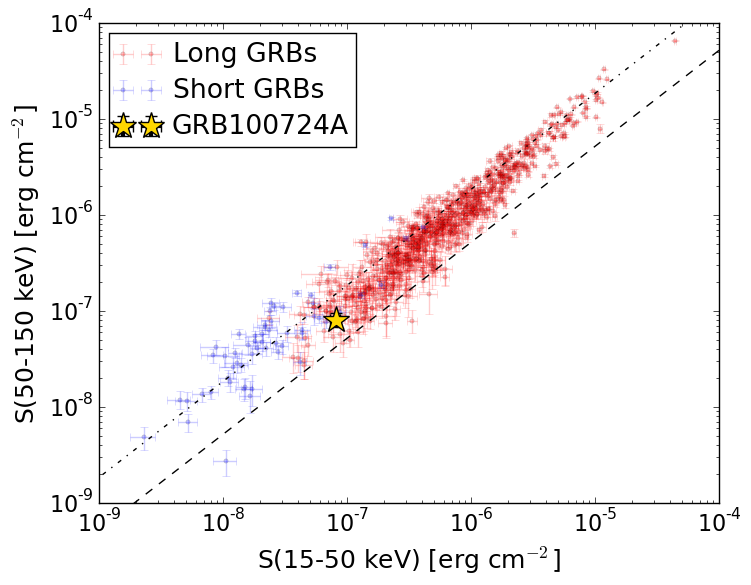
S(15-50 keV)  = 8.082083e-08
S(50-150 keV) = 8.054997e-08
The dash-dotted line and the dashed line traces the fluences calculated from the Band function with Epeak = 15 and 150 keV, respectively. Both lines assume a canonical values of alpha = -1 and beta = -2.5.
Mask shadow pattern
IMX = 5.205738703707901E-01, IMY = -4.139757957473527E-01
Spacecraft aspect plot
Bright source in the pre-burst/pre-slew/post-slew images
Pre-burst image of 15-350 keV band
Time interval of the image:
-239.216000 0.084000

# RAcent  DECcent POSerr Theta    Phi  PeakCts   SNR AngSep     Name
#  [deg]    [deg]    ['] [deg]  [deg]                   [']
135.5235 -40.5409    1.0  35.8  159.4   3.2150  11.4    0.9	Vela X-1
169.0540  38.0047    2.6  50.8  -44.5   4.4616   4.4 ------	UNKNOWN
Pre-slew background subtracted image of 15-350 keV band
Time interval of the image:
0.084000 1.648000

# RAcent  DECcent POSerr Theta    Phi  PeakCts   SNR AngSep     Name
#  [deg]    [deg]    ['] [deg]  [deg]                   [']
135.4532 -40.4422    3.6  35.8  159.6  -0.0604  -3.2    7.6	Vela X-1
194.5685 -11.0944    0.8  33.6   38.5   0.3046  14.2 ------	UNKNOWN
131.3703  17.4768    1.8  41.1  -98.0   0.3157   6.4 ------	UNKNOWN
Post-slew image of 15-350 keV band
Time interval of the image:
72.684600 962.871900

# RAcent  DECcent POSerr Theta    Phi  PeakCts   SNR AngSep     Name
#  [deg]    [deg]    ['] [deg]  [deg]                   [']
170.0839 -60.6054   10.5  52.7  171.2   1.8575   1.1    6.9	Cen X-3
186.7007 -62.7725    1.9  52.0  160.9  11.9088   6.2    1.2	GX 301-2
167.0346 -10.0337    2.9  27.1 -114.0   2.2940   4.0 ------	UNKNOWN
170.0470  29.5436    4.3  47.0  -53.2   7.3766   2.7 ------	UNKNOWN
160.2018  11.7926    2.4  41.1  -80.8  10.0543   4.9 ------	UNKNOWN