Analysis Summary
Notes:
- 1) No attempt has been made to eliminate the non-significant decimal places.
- 2) This batgrbproduct analysis is done using the HEASARC data.
- 3) This batgrbproduct analysis is using the flight position for the mask-weighting calculation.
======================================================================
BAT GRB EVENT DATA PROCESSING REPORT
Process Script Ver: batgrbproduct v2.46
Process Start Time: Fri Jan 17 17:22:37 EST 2014
Host Name: batevent1
Current Working Dir: /local/data/batevent/batevent_reproc/trigger429954
======================================================================
Trigger: 00429954 Segment: 000
BAT Trigger Time: 301734778.432 [s; MET]
Trigger Stop: 301734779.456 [s; MET]
UTC: 2010-07-25T07:12:52.414860 [includes UTCF correction]
Where From?: TDRSS position message
BAT
RA: 166.514988339174 Dec: -26.6876315703796 [deg; J2000]
Catalogged Source?: NO
Point Source?: YES
GRB Indicated?: YES [ by BAT flight software ]
Image S/N Ratio: 6.66
Image Trigger?: NO
Rate S/N Ratio: 24.6576560118759 [ if not an image trigger ]
Image S/N Ratio: 6.66
Analysis Position: [ source = BAT ]
RA: 166.514988339174 Dec: -26.6876315703796 [deg; J2000]
Refined Position: [ source = BAT pre-slew burst ]
RA: 166.465875297897 Dec: -26.666327278205 [deg; J2000]
{ 11h 05m 51.8s , -26d 39' 58.8" }
+/- 1.1913672336355 [arcmin] (estimated 90% radius based on SNR)
+/- 0.458338433275639 [arcmin] (formal 1-sigma fit error)
SNR: 23.6854551671049
Angular difference between the analysis and refined position is 2.926973 arcmin
Partial Coding Fraction: 0.828125 [ including projection effects ]
Duration
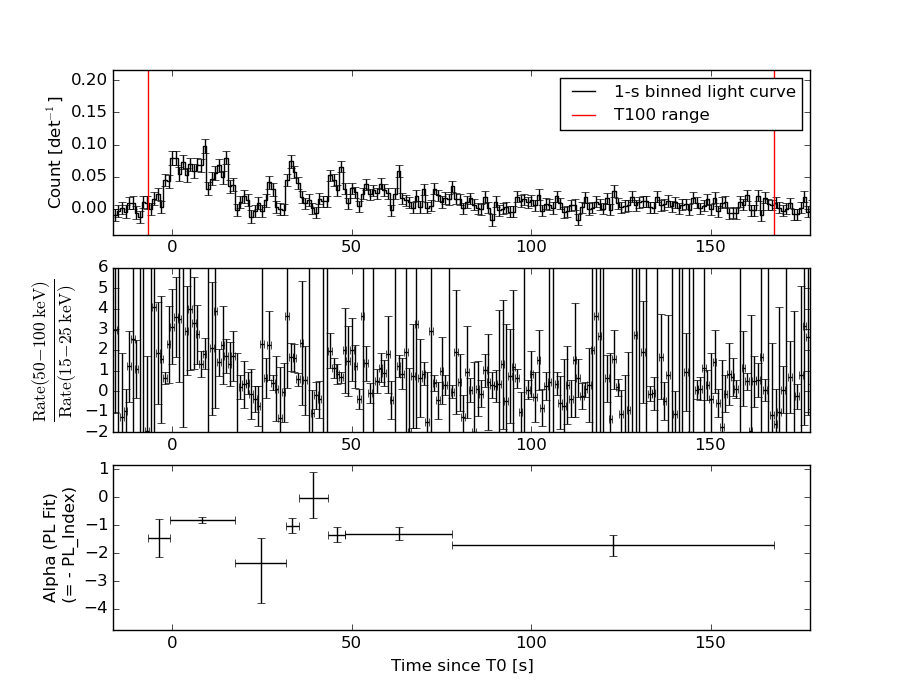
T90: 123.239999949932 +/- 27.1530454699813
Measured from: -0.251999974250793
to: 122.987999975681 [s; relative to TRIGTIME]
T50: 53.4239999651909 +/- 9.74747249464766
Measured from: 9.81999999284744
to: 63.2439999580383 [s; relative to TRIGTIME]
Fluence
Peak Flux (peak 1 second)
Measured from: 8.58399999141693
to: 9.58399999141693 [s; relative to TRIGTIME]
Total Fluence
Measured from: -6.56000000238419
to: 167.624000012875 [s; relative to TRIGTIME]
Band 1 Band 2 Band 3 Band 4
15-25 25-50 50-100 100-350 keV
Total 0.664266 1.057696 0.966591 0.400808
0.062682 0.064816 0.057708 0.050632 [error]
Peak 0.015002 0.031822 0.027668 0.024240
0.005326 0.005729 0.005381 0.004744 [error]
[ fluence units of on-axis counts / fully illuminated detector ]
======================================================================
====== Table of the duration information =============================
Value tstart tstop
T100 174.184 -6.560 167.624
T90 123.240 -0.252 122.988
T50 53.424 9.820 63.244
Peak 1.000 8.584 9.584
====== Spectral Analysis Summary =====================================
Model : spectral model: simple power-law (PL) and cutoff power-law (CPL)
Ph_index : photon index: E^{Ph_index}
Ph_90err : 90% error of the photon index
Epeak : Epeak in keV
Epeak_90err: 90% error of Epeak
Norm : normalization at 50 keV in both the PL model and CPL model
Nomr_90err : 90% error of the normalization
chi2 : Chi-Squared
dof : degree of freedo
=== Time-averaged spectral analysis ===
(Best model with acceptable fit: PL)
Model Ph_index Ph_90err_low Ph_90err_hi Epeak Epeak_90err_low Epeak_90err_hi Norm Nomr_90err_low Norm_90err_hi chi2 dof
PL -1.189 -0.118 0.119 - - - 1.16e-03 -7.26e-05 7.26e-05 50.590 57
CPL -1.191 -0.113 0.143 9999.360 -9999.360 -9999.360 1.17e-03 -7.27e-05 2.53e-04 50.640 56
=== 1-s peak spectral analysis ===
(Best model with acceptable fit: PL)
Model Ph_index Ph_90err_low Ph_90err_hi Epeak Epeak_90err_low Epeak_90err_hi Norm Nomr_90err_low Norm_90err_hi chi2 dof
PL -1.086 -0.344 0.366 - - - 6.02e-03 -1.15e-03 1.14e-03 68.980 57
CPL -1.092 -5.939 0.899 9999.320 N/A N/A 6.04e-03 N/A N/A 68.990 56
=== Fluence/Peak Flux Summary ===
Model Band1 Band2 Band3 Band4 Band5 Total
15-25 25-50 50-100 100-350 15-150 15-350 keV
Fluence PL 1.94e-07 4.31e-07 7.56e-07 3.10e-06 2.07e-06 4.48e-06 erg/cm2
90%_error_low -2.47e-08 -3.25e-08 -5.61e-08 -5.08e-07 -1.41e-07 -5.40e-07 erg/cm2
90%_error_hi 2.58e-08 3.21e-08 5.57e-08 5.78e-07 1.42e-07 6.00e-07 erg/cm2
Peak flux PL 1.67e-01 2.15e-01 2.02e-01 3.37e-01 6.97e-01 9.21e-01 ph/cm2/s
90%_error_low -6.25e-02 -5.24e-02 -4.33e-02 -1.35e-01 -1.37e-01 -1.84e-01 ph/cm2/s
90%_error_hi 7.06e-02 5.03e-02 4.23e-02 1.88e-01 1.37e-01 1.94e-01 ph/cm2/s
Fluence CPL 1.94e-07 4.28e-07 7.48e-07 3.12e-06 2.08e-06 4.25e-06 erg/cm2
90%_error_low N/A -2.95e-08 -4.76e-08 -9.57e-07 -1.53e-07 -7.25e-07 erg/cm2
90%_error_hi N/A 3.51e-08 6.43e-08 2.25e-07 1.30e-07 8.25e-07 erg/cm2
Peak flux CPL 1.72e-01 2.15e-01 2.01e-01 3.40e-01 7.02e-01 9.24e-01 ph/cm2/s
90%_error_low N/A -5.30e-02 -4.25e-02 N/A -1.62e-01 -2.64e-01 ph/cm2/s
90%_error_hi N/A 5.01e-02 4.58e-02 N/A 1.53e-01 1.71e-01 ph/cm2/s
======================================================================
Image
Pre-slew 15.0-350.0 keV image (Event data)
#   RAcent    DECcent   POSerr    Theta     Phi              Peak Cts       SNR   Name
  166.4659   -26.6663   0.0081    30.6737  -157.7026         1.2077689     23.685 TRIG_00429954

Foreground time interval of the image:
 -6.560  15.069 (delta_t =  21.629 [sec])
Background time interval of the image:
-239.432  -6.560 (delta_t = 232.872 [sec])
Light Curves
Note: The mask-weighted lightcurves have units of either count/det or counts/sec/det, where a det is 0.4 x 0.4 = 0.16 sq cm.
Full-time range; 1 s binning
Other quick-look light curves:
- 64 ms binning (zoomed)
- 16 ms binning (zoomed)
- 8 ms binning (zoomed)
- 2 ms binning (zoomed)
- SN=5 or 10 s binning (full-time range)
- Raw light curve
Spectra
- 64 ms binning (zoomed)
- 16 ms binning (zoomed)
- 8 ms binning (zoomed)
- 2 ms binning (zoomed)
- SN=5 or 10 s binning (full-time range)
- Raw light curve
Spectra
Notes:
- 1) The fitting includes the systematic errors.
- 2) When the burst includes telescope slew time periods, the fitting uses an average response file made from multiple 5-s response files through out the slew time plus single time preiod for the non-slew times, and weighted by the total counts in the corresponding time period using addrmf. An average response file is needed becuase a spectral fit using the pre-slew DRM will introduce some errors in both a spectral shape and a normalization if the PHA file contains a lot of the slew/post-slew time interval.
- 3) For fits to more complicated models (e.g. a power-law over a cutoff power-law), the BAT team has decided to require a chi-square improvement of more than 6 for each extra dof.
Time averaged spectrum fit using the average DRM
Power-law model
Time interval is from   -6.560 sec. to  167.624 sec.

Spectral model in power-law:
------------------------------------------------------------
Parameters  : value       lower 90%   higher 90%
Photon index: -1.18923     ( -0.11758   0.11918 )
Norm@50keV  : 1.16479E-03    ( -7.26351e-05   7.25763e-05 )
------------------------------------------------------------
#Fit statistic : Chi-Squared =          50.59 using 59 PHA bins.
# Reduced chi-squared =         0.8875 for     57 degrees of freedom
# Null hypothesis probability =   7.127821e-01

Photon flux (15-150 keV)    in 174.2 sec: 0.136520 ( -0.008925  0.008963 ) ph/cm2/s
Energy fluence (15-150 keV)             : 2.06509e-06 ( -1.41252e-07  1.41992e-07 ) ergs/cm2
Cutoff power-law model
Time interval is from   -6.560 sec. to  167.624 sec.
Spectral model in the cutoff power-law:
------------------------------------------------------------
Parameters  : value       lower 90%   higher 90%
Photon index: -1.19069     ( -0.113133   0.142252 )
Epeak [keV] : 9999.36      ( -9999.36 -9999.36 )
Norm@50keV  : 1.17057E-03    ( -7.26962e-05   0.000252649 )
------------------------------------------------------------
#Fit statistic : Chi-Squared =          50.64 using 59 PHA bins.
# Reduced chi-squared =         0.9043 for     56 degrees of freedom
# Null hypothesis probability =   6.771446e-01

Photon flux (15-150 keV)    in 174.2 sec: 0.137537 ( -0.009985  0.007905 ) ph/cm2/s
Energy fluence (15-150 keV)             : 2.07605e-06 ( -1.53095e-07  1.30272e-07 ) ergs/cm2
1-s peak spectrum fit
Power-law model
Time interval is from    8.584 sec. to    9.584 sec.

Spectral model in power-law:
------------------------------------------------------------
Parameters  : value       lower 90%   higher 90%
Photon index: -1.086     ( -0.344173   0.36562 )
Norm@50keV  : 6.01794E-03    ( -0.00114706   0.00114223 )
------------------------------------------------------------
#Fit statistic : Chi-Squared =          68.98 using 59 PHA bins.
# Reduced chi-squared =          1.210 for     57 degrees of freedom
# Null hypothesis probability =   1.328472e-01

Photon flux (15-150 keV)    in 1 sec: 0.697125 ( -0.136766  0.137229 ) ph/cm2/s
Energy fluence (15-150 keV)             : 6.32092e-08 ( -1.30836e-08  1.32043e-08 ) ergs/cm2
Cutoff power-law model

Time interval is from    8.584 sec. to    9.584 sec.
Spectral model in the cutoff power-law:
------------------------------------------------------------
Parameters  : value       lower 90%   higher 90%
Photon index: -2.32411     ( -4.70735   2.13114 )
Epeak [keV] : 107.812      (   )
Norm@50keV  : 9.09094E-04    (     )
------------------------------------------------------------
#Fit statistic : Chi-Squared =          68.58 using 59 PHA bins.
# Reduced chi-squared =          1.225 for     56 degrees of freedom
# Null hypothesis probability =   1.206239e-01

Photon flux (15-150 keV)    in 1 sec: 0.701857 ( -0.162086  0.153006 ) ph/cm2/s
Energy fluence (15-150 keV)             : 6.35214e-08 ( -1.52622e-08  1.47837e-08 ) ergs/cm2
Time-resolved spectra
Distribution
T90 vs. Hardness ratio plot
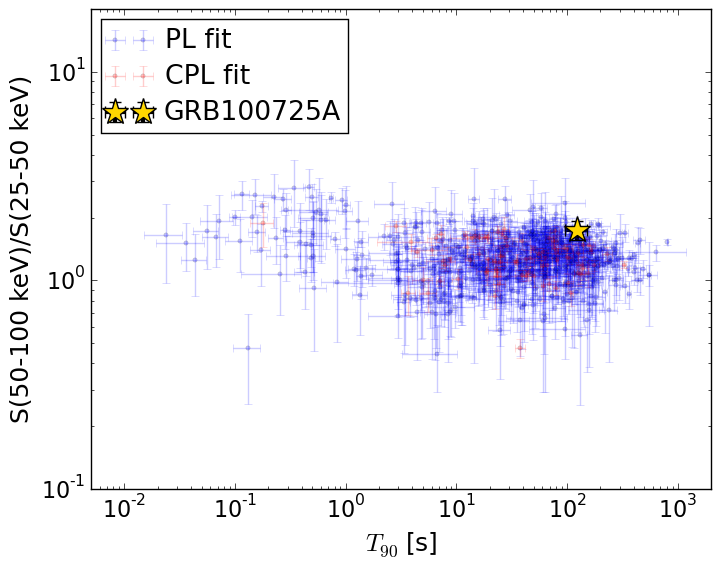
T90                                   = 123.24 sec.
Hardness ratio (energy fluence ratio) = 1.75416325182
S(15-50 keV) vs. S(50-150 keV) plot
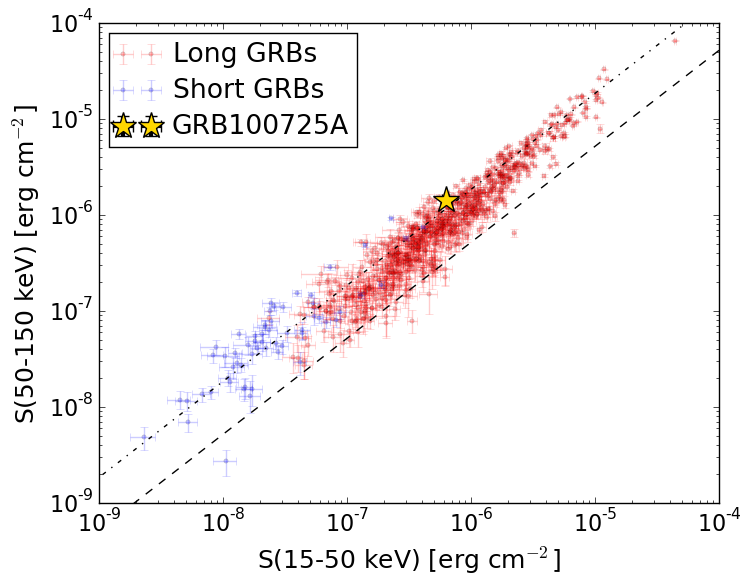
S(15-50 keV)  = 6.247542e-07
S(50-150 keV) = 1.4403419e-06
The dash-dotted line and the dashed line traces the fluences calculated from the Band function with Epeak = 15 and 150 keV, respectively. Both lines assume a canonical values of alpha = -1 and beta = -2.5.
Mask shadow pattern
IMX = -5.487857649298175E-01, IMY = 2.250439268988485E-01
Spacecraft aspect plot
Bright source in the pre-burst/pre-slew/post-slew images
Pre-burst image of 15-350 keV band
Time interval of the image:
-239.432000 -6.560000

# RAcent  DECcent POSerr Theta    Phi  PeakCts   SNR AngSep     Name
#  [deg]    [deg]    ['] [deg]  [deg]                   [']
170.2234 -60.6652    7.2  52.7  161.5   1.1976   1.6    3.7	Cen X-3
179.1281 -52.7142    2.3  43.5  160.3   1.6560   5.0 ------	UNKNOWN
Pre-slew background subtracted image of 15-350 keV band
Time interval of the image:
-6.560000 15.068600

# RAcent  DECcent POSerr Theta    Phi  PeakCts   SNR AngSep     Name
#  [deg]    [deg]    ['] [deg]  [deg]                   [']
170.2939 -60.6283   21.7  52.7  161.5  -0.1094  -0.5    0.7	Cen X-3
197.6781  14.0442    3.0  25.3  -26.0   0.1721   3.8 ------	UNKNOWN
166.4659 -26.6663    0.5  30.7 -157.7   1.2076  23.7 ------	UNKNOWN
146.3944 -41.7236    1.8  51.9 -168.3   0.7186   6.2 ------	UNKNOWN
Post-slew image of 15-350 keV band
Time interval of the image:
65.868600 962.622100

# RAcent  DECcent POSerr Theta    Phi  PeakCts   SNR AngSep     Name
#  [deg]    [deg]    ['] [deg]  [deg]                   [']
135.5286 -40.5485    0.8  29.1 -170.4   6.6662  14.4    0.4	Vela X-1
170.3159 -60.6230    9.1  34.0  132.6   1.0083   1.3    0.0	Cen X-3
186.3116 -62.8224    2.5  38.4  121.5   5.2607   4.6   10.0	GX 301-2
213.1164  -4.0924    2.1  49.9   27.3   8.4262   5.4 ------	UNKNOWN
188.8784   2.5624    2.8  36.3   -4.2   2.5649   4.2 ------	UNKNOWN
187.9018  24.8440    3.3  55.5  -20.4   6.2941   3.5 ------	UNKNOWN
116.8102 -14.0232    2.7  48.0 -129.0   9.8604   4.2 ------	UNKNOWN