Analysis Summary
Notes:
- 1) No attempt has been made to eliminate the non-significant decimal places.
- 2) This batgrbproduct analysis is done using the HEASARC data.
- 3) This batgrbproduct analysis is using the flight position for the mask-weighting calculation.
======================================================================
                  BAT GRB EVENT DATA PROCESSING REPORT
    Process Script Ver: batgrbproduct v2.46
    Process Start Time: Fri Jan 17 17:17:54 EST 2014
             Host Name: batevent1
   Current Working Dir: /local/data/batevent/batevent_reproc/trigger429969
======================================================================

  Trigger: 00429969      Segment: 000

  BAT Trigger Time: 301749880.512   [s; MET]
      Trigger Stop: 301749881.536   [s; MET]
               UTC: 2010-07-25T11:24:34.494340    [includes UTCF correction]
       Where From?: TDRSS position message

  BAT
    RA: 290.026558178563   Dec: 76.9548635696441  [deg; J2000]

     Catalogged Source?: NO
     Point Source?:      YES
     GRB Indicated?:     YES    [ by BAT flight software ]
     Image S/N Ratio:    7.16
     Image Trigger?:     NO
     Rate S/N Ratio:     12.0415945787923  [ if not an image trigger ]
     Image S/N Ratio:    7.16

  Analysis Position:   [ source = BAT ]
    RA: 290.026558178563   Dec: 76.9548635696441  [deg; J2000]

  Refined Position:   [ source = BAT pre-slew burst ]
    RA: 290.036881782525   Dec: 76.9561262279498  [deg; J2000]
        { 19h 20m 08.9s , +76d 57' 22.1" }
         +/- 1.17258084121846 [arcmin] (estimated 90% radius based on SNR)
         +/- 0.319642982077274 [arcmin] (formal 1-sigma fit error)
    SNR: 24.2294167547901

  Angular difference between the analysis and refined position is 0.159014 arcmin

  Partial Coding Fraction: 0.2890625    [ including projection effects ]

  Duration
     T90: 173.695999920368 +/- 20.1570205273478
        Measured from: 0.783999979496002
                   to: 174.479999899864     [s; relative to TRIGTIME]
     T50: 72.8839999437332 +/- 12.5705072175947
        Measured from: 64.3759999871254
                   to: 137.259999930859     [s; relative to TRIGTIME]


  Fluence
     Peak Flux  (peak 1 second)
        Measured from: 132.407999992371
                   to: 133.407999992371     [s; relative to TRIGTIME]
     Total Fluence
        Measured from: -4.81200003623962
                   to: 225.255999982357     [s; relative to TRIGTIME]

             Band 1     Band 2     Band 3     Band 4
              15-25      25-50     50-100    100-350     keV
 Total     4.114069   4.474322   2.772178   0.677505
           0.088654   0.092141   0.082453   0.072825 [error]
 Peak      0.070068   0.108574   0.089235   0.025195
           0.005578   0.006195   0.005802   0.004563 [error]

     [ fluence units of on-axis counts / fully illuminated detector ]

======================================================================


====== Table of the duration information =============================

        Value   tstart    tstop
T100  230.068   -4.812  225.256
T90   173.696    0.784  174.480
T50    72.884   64.376  137.260
Peak    1.000  132.408  133.408


====== Spectral Analysis Summary =====================================

Model      : spectral model: simple power-law (PL) and cutoff power-law (CPL)
Ph_index   : photon index: E^{Ph_index}
Ph_90err   : 90% error of the photon index
Epeak      : Epeak in keV
Epeak_90err: 90% error of Epeak
Norm       : normalization at 50 keV in both the PL model and CPL model
Nomr_90err : 90% error of the normalization
chi2       : Chi-Squared
dof        : degree of freedo

=== Time-averaged spectral analysis ===
(Best model with acceptable fit: PL)

Model Ph_index Ph_90err_low Ph_90err_hi  Epeak  Epeak_90err_low  Epeak_90err_hi  Norm       Nomr_90err_low    Norm_90err_hi    chi2    dof
PL      -1.820    -0.059      0.058       -           -               -         3.09e-03     -9.11e-05          9.07e-05      52.930   57
CPL     -1.821    -0.057      0.060     9999.360    -9999.350      -9999.360      3.09e-03     -8.82e-05          6.13e-04      52.940   56


=== 1-s peak spectral analysis ===
(Best model with acceptable fit: PL)

Model Ph_index Ph_90err_low Ph_90err_hi  Epeak  Epeak_90err_low  Epeak_90err_hi  Norm       Nomr_90err_low    Norm_90err_hi    chi2    dof
PL      -1.357     -0.110     0.110       -           -               -         1.88e-02     -1.21e-03          1.20e-03      58.530   57
CPL     -1.134     -0.279     0.463      195.178    -195.178      -195.178      2.44e-02     -6.53e-03          1.69e-02      57.730   56


=== Fluence/Peak Flux Summary ===

              Model    Band1     Band2     Band3     Band4     Band5     Total
                       15-25     25-50    50-100    100-350    15-150    15-350    keV
Fluence         PL   1.23e-06  1.86e-06  2.10e-06  4.53e-06  6.54e-06  9.72e-06   erg/cm2
      90%_error_low -6.54e-08 -5.56e-08 -8.57e-08 -4.02e-07 -1.95e-07 -4.59e-07   erg/cm2
      90%_error_hi   6.68e-08  5.55e-08  8.57e-08  4.30e-07  1.96e-07  4.79e-07   erg/cm2
Peak flux       PL   6.75e-01  7.39e-01  5.77e-01  7.41e-01  2.27e+00  2.73e+00   ph/cm2/s
      90%_error_low -7.42e-02 -5.07e-02 -4.62e-02 -1.16e-01 -1.44e-01 -1.81e-01   ph/cm2/s
      90%_error_hi   7.65e-02  5.04e-02  4.59e-02  1.29e-01  1.44e-01  1.82e-01   ph/cm2/s

Fluence        CPL   1.23e-06  1.85e-06  2.10e-06  4.53e-06  6.54e-06  1.01e-05   erg/cm2
      90%_error_low -6.54e-08 -5.24e-08    N/A       N/A    -1.83e-07 -1.44e-06   erg/cm2
      90%_error_hi   6.69e-08  6.86e-08    N/A       N/A     1.96e-07  8.93e-08   erg/cm2
Peak flux      CPL   6.49e-01  7.56e-01  5.88e-01  5.62e-01  2.25e+00  2.55e+00   ph/cm2/s
      90%_error_low -8.88e-02 -5.86e-02 -5.07e-02 -2.23e-01 -1.50e-01 -2.74e-01   ph/cm2/s
      90%_error_hi   8.98e-02  6.03e-02  5.16e-02  2.17e-01  1.50e-01  2.84e-01   ph/cm2/s

======================================================================
Image
Pre-slew 15.0-350.0 keV image (Event data)
#   RAcent    DECcent   POSerr    Theta     Phi              Peak Cts       SNR   Name
  290.0369    76.9561   0.0079    33.5607   -89.8446         2.1660680     24.229 TRIG_00429969

Foreground time interval of the image:
 -4.812  12.589 (delta_t =  17.401 [sec])
Background time interval of the image:
-239.512  -4.812 (delta_t = 234.700 [sec])
Light Curves
Note: The mask-weighted lightcurves have units of either count/det or counts/sec/det, where a det is 0.4 x 0.4 = 0.16 sq cm.
Full-time range; 1 s binning
Other quick-look light curves:
- 64 ms binning (zoomed)
- 16 ms binning (zoomed)
- 8 ms binning (zoomed)
- 2 ms binning (zoomed)
- SN=5 or 10 s binning (full-time range)
- Raw light curve
Spectra
- 64 ms binning (zoomed)
- 16 ms binning (zoomed)
- 8 ms binning (zoomed)
- 2 ms binning (zoomed)
- SN=5 or 10 s binning (full-time range)
- Raw light curve
Spectra
Notes:
- 1) The fitting includes the systematic errors.
- 2) When the burst includes telescope slew time periods, the fitting uses an average response file made from multiple 5-s response files through out the slew time plus single time preiod for the non-slew times, and weighted by the total counts in the corresponding time period using addrmf. An average response file is needed becuase a spectral fit using the pre-slew DRM will introduce some errors in both a spectral shape and a normalization if the PHA file contains a lot of the slew/post-slew time interval.
- 3) For fits to more complicated models (e.g. a power-law over a cutoff power-law), the BAT team has decided to require a chi-square improvement of more than 6 for each extra dof.
Time averaged spectrum fit using the average DRM
Power-law model

Time interval is from   -4.812 sec. to  225.256 sec.

Spectral model in power-law:
------------------------------------------------------------
Parameters  : value       lower 90%   higher 90%
Photon index: -1.82004     ( -0.0585734   0.0581852 )
Norm@50keV  : 3.08860E-03    ( -9.10623e-05   9.06612e-05 )
------------------------------------------------------------
#Fit statistic : Chi-Squared =          52.93 using 59 PHA bins.
# Reduced chi-squared =         0.9286 for     57 degrees of freedom
# Null hypothesis probability =   6.283554e-01

Photon flux (15-150 keV)    in 230.1 sec: 0.428977 ( -0.013389  0.013448 ) ph/cm2/s
Energy fluence (15-150 keV)             : 6.53953e-06 ( -1.95192e-07  1.95916e-07 ) ergs/cm2
Cutoff power-law model
Time interval is from   -4.812 sec. to  225.256 sec.
Spectral model in the cutoff power-law:
------------------------------------------------------------
Parameters  : value       lower 90%   higher 90%
Photon index: -1.82097     ( -0.0576456   0.059745 )
Epeak [keV] : 9999.36      ( -9999.35 -9999.36 )
Norm@50keV  : 3.08956E-03    ( -9.02171e-05   0.000610793 )
------------------------------------------------------------
#Fit statistic : Chi-Squared =          52.94 using 59 PHA bins.
# Reduced chi-squared =         0.9454 for     56 degrees of freedom
# Null hypothesis probability =   5.912925e-01

Photon flux (15-150 keV)    in 230.1 sec: 0.431257 ( -0.015767  0.011199 ) ph/cm2/s
Energy fluence (15-150 keV)             : 6.53894e-06 ( -1.82896e-07  1.95739e-07 ) ergs/cm2
1-s peak spectrum fit
Power-law model
Time interval is from  132.408 sec. to  133.408 sec.

Spectral model in power-law:
------------------------------------------------------------
Parameters  : value       lower 90%   higher 90%
Photon index: -1.35731     ( -0.110395   0.110029 )
Norm@50keV  : 1.87992E-02    ( -0.00120884   0.00120366 )
------------------------------------------------------------
#Fit statistic : Chi-Squared =          58.53 using 59 PHA bins.
# Reduced chi-squared =          1.027 for     57 degrees of freedom
# Null hypothesis probability =   4.188469e-01

Photon flux (15-150 keV)    in 1 sec: 2.26823 ( -0.14428  0.14436 ) ph/cm2/s
Energy fluence (15-150 keV)             : 1.83333e-07 ( -1.33169e-08  1.34194e-08 ) ergs/cm2
Cutoff power-law model

Time interval is from  132.408 sec. to  133.408 sec.
Spectral model in the cutoff power-law:
------------------------------------------------------------
Parameters  : value       lower 90%   higher 90%
Photon index: -1.13407     ( -0.279029   0.463187 )
Epeak [keV] : 195.178      ( -195.186 -195.186 )
Norm@50keV  : 2.43817E-02    ( -0.00653031   0.0168671 )
------------------------------------------------------------
#Fit statistic : Chi-Squared =          57.73 using 59 PHA bins.
# Reduced chi-squared =          1.031 for     56 degrees of freedom
# Null hypothesis probability =   4.110003e-01

Photon flux (15-150 keV)    in 1 sec: 2.24677 ( -0.1503  0.1496 ) ph/cm2/s
Energy fluence (15-150 keV)             : 1.79958e-07 ( -1.49291e-08  1.48156e-08 ) ergs/cm2
Time-resolved spectra

Distribution
T90 vs. Hardness ratio plot
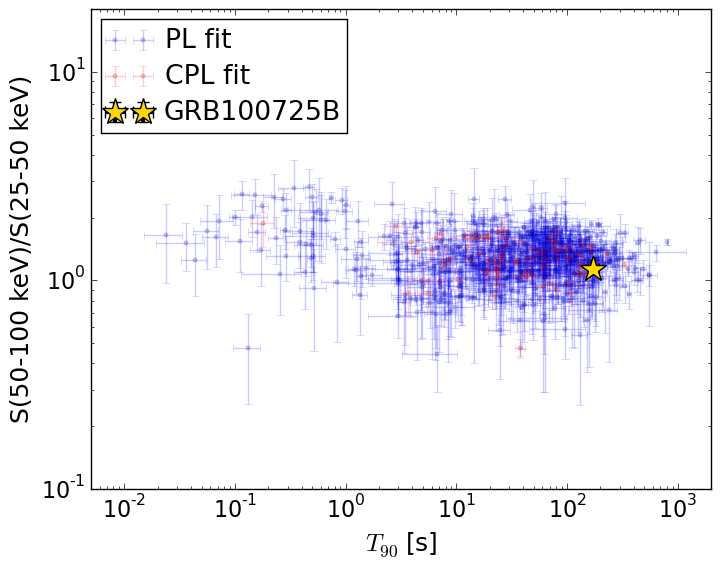
T90                                   = 173.696 sec.
Hardness ratio (energy fluence ratio) = 1.13289586179
S(15-50 keV) vs. S(50-150 keV) plot
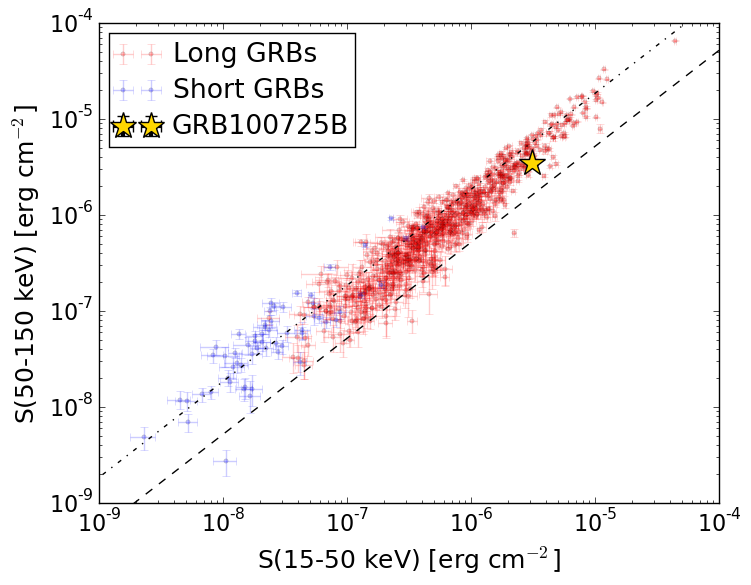
S(15-50 keV)  = 3.081551e-06
S(50-150 keV) = 3.458042e-06
The dash-dotted line and the dashed line traces the fluences calculated from the Band function with Epeak = 15 and 150 keV, respectively. Both lines assume a canonical values of alpha = -1 and beta = -2.5.
Mask shadow pattern
IMX = 1.799276477557046E-03, IMY = 6.634084591647635E-01
Spacecraft aspect plot
Bright source in the pre-burst/pre-slew/post-slew images
Pre-burst image of 15-350 keV band
Time interval of the image:
-239.512000 -4.812000

# RAcent  DECcent POSerr Theta    Phi  PeakCts   SNR AngSep     Name
#  [deg]    [deg]    ['] [deg]  [deg]                   [']
254.2453  35.3246    6.0  41.3 -166.1  -0.5375  -1.9   10.4	Her X-1
288.7811  10.9822    1.8  37.0  129.3   2.3459   6.4    2.4	GRS 1915+105
299.6042  35.1932    1.3  11.0  134.8   1.3851   8.9    0.8	Cyg X-1
308.1168  40.9554    1.0   3.3   92.2   1.7907  11.3    0.3	Cyg X-3
326.1105  38.1791    5.8  15.0   24.5   0.3139   2.0    9.0	Cyg X-2
355.2530  23.6718    2.2  43.7   19.3   1.6050   5.2 ------	UNKNOWN
249.6695  16.8112    2.8  55.6  177.1   3.1543   4.1 ------	UNKNOWN
322.3736  85.1195    1.8  41.1  -80.8   4.9496   6.6 ------	UNKNOWN
Pre-slew background subtracted image of 15-350 keV band
Time interval of the image:
-4.812000 12.588600

# RAcent  DECcent POSerr Theta    Phi  PeakCts   SNR AngSep     Name
#  [deg]    [deg]    ['] [deg]  [deg]                   [']
254.4577  35.3433   75.9  41.2 -166.2  -0.0088  -0.2    0.1	Her X-1
288.8136  10.9414  617.2  37.0  129.2   0.0016   0.0    0.9	GRS 1915+105
299.5655  35.3493    7.0  10.8  135.3  -0.0689  -1.7    8.9	Cyg X-1
307.9186  41.0858    9.9   3.1   94.8  -0.0503  -1.2   11.8	Cyg X-3
325.9985  38.4653    3.9  14.8   23.7   0.1182   3.0   11.9	Cyg X-2
345.7868  22.8302    2.1  37.7   29.1   0.3770   5.4 ------	UNKNOWN
307.6508  27.2070    2.6  17.0   97.5   0.2088   4.5 ------	UNKNOWN
247.9353  19.4221    2.1  55.1 -179.2   0.8354   5.4 ------	UNKNOWN
346.1072  49.3254    2.2  26.5  -17.6   0.2251   5.2 ------	UNKNOWN
290.0369  76.9561    0.5  33.6  -89.8   2.1659  24.2 ------	UNKNOWN
Post-slew image of 15-350 keV band
Time interval of the image:
67.188590 962.577800

# RAcent  DECcent POSerr Theta    Phi  PeakCts   SNR AngSep     Name
#  [deg]    [deg]    ['] [deg]  [deg]                   [']
254.5498  35.4591   11.4  44.4  146.7  -1.3659  -1.0    8.3	Her X-1
308.0843  40.9593    2.4  36.8   81.1   7.6307   4.8    1.2	Cyg X-3
326.1620  38.3020   62.1  41.7   60.0  -0.3186  -0.2    1.3	Cyg X-2
 13.7517  48.9977    3.0  41.3    5.3   2.6982   3.8 ------	UNKNOWN
290.0246  76.9472    0.6   0.0 -132.0   9.5330  19.1 ------	UNKNOWN
 19.4178  65.2541    1.8  27.6  -11.6   3.4470   6.6 ------	UNKNOWN
187.3517  45.7875    2.7  48.4 -141.3   5.6971   4.2 ------	UNKNOWN
116.7763  61.9160    2.7  41.1  -80.7   9.5928   4.3 ------	UNKNOWN