Analysis Summary
Notes:
- 1) No attempt has been made to eliminate the non-significant decimal places.
- 2) This batgrbproduct analysis is done using the HEASARC data.
- 3) This batgrbproduct analysis is using the flight position for the mask-weighting calculation.
======================================================================
BAT GRB EVENT DATA PROCESSING REPORT
Process Script Ver: batgrbproduct v2.46
Process Start Time: Fri Jan 17 17:14:25 EST 2014
Host Name: batevent1
Current Working Dir: /local/data/batevent/batevent_reproc/trigger430094
======================================================================
Trigger: 00430094 Segment: 000
BAT Trigger Time: 301902143.808 [s; MET]
Trigger Stop: 301902144.832 [s; MET]
UTC: 2010-07-27T05:42:17.784900 [includes UTCF correction]
Where From?: TDRSS position message
BAT
RA: 154.165673991183 Dec: -21.3644000852862 [deg; J2000]
Catalogged Source?: NO
Point Source?: YES
GRB Indicated?: YES [ by BAT flight software ]
Image S/N Ratio: 8.09
Image Trigger?: NO
Rate S/N Ratio: 13.856406460551 [ if not an image trigger ]
Image S/N Ratio: 8.09
Analysis Position: [ source = BAT ]
RA: 154.165673991183 Dec: -21.3644000852862 [deg; J2000]
Refined Position: [ source = BAT pre-slew burst ]
RA: 154.181911705207 Dec: -21.4096486808849 [deg; J2000]
{ 10h 16m 43.7s , -21d 24' 34.7" }
+/- 1.57663600809825 [arcmin] (estimated 90% radius based on SNR)
+/- 0.824448966925673 [arcmin] (formal 1-sigma fit error)
SNR: 15.8724838128324
Angular difference between the analysis and refined position is 2.862469 arcmin
Partial Coding Fraction: 0.984375 [ including projection effects ]
Duration
T90: 71.8999999165535 +/- 13.0182594444024
Measured from: -50.6840000152588
to: 21.2159999012947 [s; relative to TRIGTIME]
T50: 12.4439999461174 +/- 18.765219008616
Measured from: -1.02400004863739
to: 11.41999989748 [s; relative to TRIGTIME]
Fluence
Peak Flux (peak 1 second)
Measured from: 1.33199995756149
to: 2.33199995756149 [s; relative to TRIGTIME]
Total Fluence
Measured from: -74.6080000400543
to: 29.839999973774 [s; relative to TRIGTIME]
Band 1 Band 2 Band 3 Band 4
15-25 25-50 50-100 100-350 keV
Total 0.766525 0.882234 0.503569 0.068673
0.047701 0.048961 0.043055 0.037422 [error]
Peak 0.042453 0.064331 0.037203 0.007492
0.005277 0.005509 0.004938 0.003871 [error]
[ fluence units of on-axis counts / fully illuminated detector ]
======================================================================
====== Table of the duration information =============================
Value tstart tstop
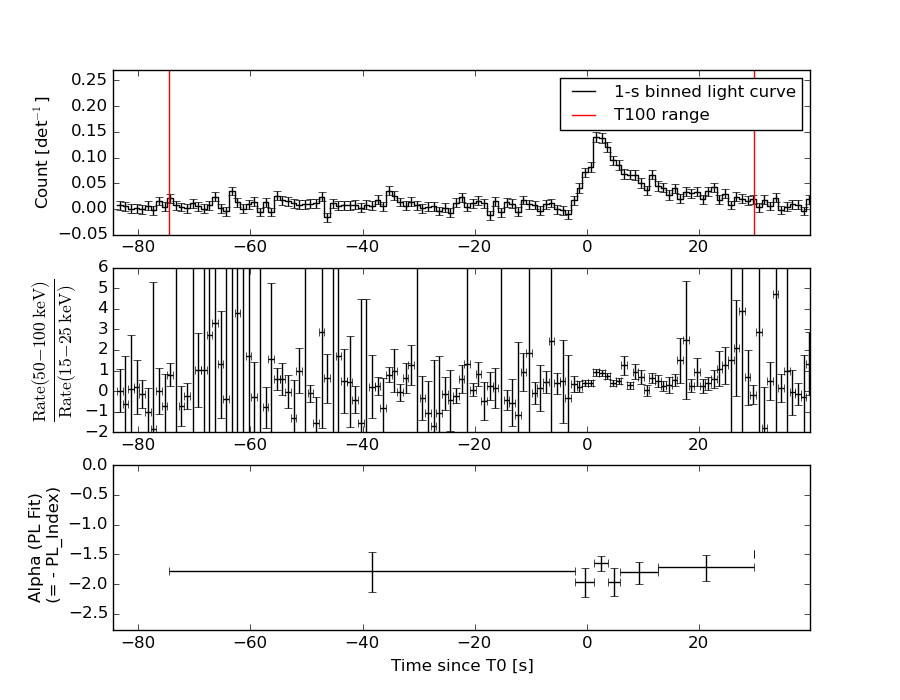
T100 104.448 -74.608 29.840
T90 71.900 -50.684 21.216
T50 12.444 -1.024 11.420
Peak 1.000 1.332 2.332
====== Spectral Analysis Summary =====================================
Model : spectral model: simple power-law (PL) and cutoff power-law (CPL)
Ph_index : photon index: E^{Ph_index}
Ph_90err : 90% error of the photon index
Epeak : Epeak in keV
Epeak_90err: 90% error of Epeak
Norm : normalization at 50 keV in both the PL model and CPL model
Nomr_90err : 90% error of the normalization
chi2 : Chi-Squared
dof : degree of freedo
=== Time-averaged spectral analysis ===
(Best model with acceptable fit: N/A)
Model Ph_index Ph_90err_low Ph_90err_hi Epeak Epeak_90err_low Epeak_90err_hi Norm Nomr_90err_low Norm_90err_hi chi2 dof
PL -1.809 -0.128 0.125 - - - 1.25e-03 -9.66e-05 9.54e-05 82.010 57
CPL -1.472 -0.423 0.547 69.525 -21.079 -69.525 1.92e-03 -7.34e-04 1.88e-03 80.630 56
=== 1-s peak spectral analysis ===
(Best model with acceptable fit: PL)
Model Ph_index Ph_90err_low Ph_90err_hi Epeak Epeak_90err_low Epeak_90err_hi Norm Nomr_90err_low Norm_90err_hi chi2 dof
PL -1.716 -0.193 0.186 - - - 8.90e-03 -1.09e-03 1.07e-03 65.170 57
CPL -1.080 -0.705 0.871 63.044 -17.859 -63.044 2.02e-02 -1.18e-02 4.26e-02 62.920 56
=== Fluence/Peak Flux Summary ===
Model Band1 Band2 Band3 Band4 Band5 Total
15-25 25-50 50-100 100-350 15-150 15-350 keV
Fluence PL 2.23e-07 3.40e-07 3.88e-07 8.47e-07 1.20e-06 1.80e-06 erg/cm2
90%_error_low -2.29e-08 -2.24e-08 -4.13e-08 -1.72e-07 -9.40e-08 -2.14e-07 erg/cm2
90%_error_hi 2.34e-08 2.24e-08 4.16e-08 2.01e-07 9.54e-08 2.36e-07 erg/cm2
Peak flux PL 4.50e-01 3.99e-01 2.43e-01 2.24e-01 1.19e+00 1.32e+00 ph/cm2/s
90%_error_low -7.07e-02 -4.22e-02 -3.88e-02 -6.29e-02 -1.25e-01 -1.43e-01 ph/cm2/s
90%_error_hi 7.31e-02 4.21e-02 3.90e-02 7.67e-02 1.25e-01 1.44e-01 ph/cm2/s
Fluence CPL 2.14e-07 3.53e-07 3.86e-07 4.70e-07 1.16e-06 1.42e-06 erg/cm2
90%_error_low -2.64e-08 -2.87e-08 -4.44e-08 -2.56e-07 -1.12e-07 -2.85e-07 erg/cm2
90%_error_hi 2.65e-08 2.95e-08 4.37e-08 4.32e-07 1.14e-07 4.65e-07 erg/cm2
Peak flux CPL 4.20e-01 4.29e-01 2.44e-01 9.81e-02 1.16e+00 1.19e+00 ph/cm2/s
90%_error_low -8.00e-02 -5.42e-02 -4.41e-02 -6.18e-02 -1.29e-01 -1.47e-01 ph/cm2/s
90%_error_hi 8.11e-02 5.65e-02 4.30e-02 1.50e-01 1.29e-01 1.88e-01 ph/cm2/s
======================================================================
Image
Pre-slew 15.0-350.0 keV image (Event data)
#   RAcent    DECcent   POSerr    Theta     Phi              Peak Cts       SNR   Name
  154.1819   -21.4096   0.0121    12.4010  -123.1216         1.6085380     15.872 TRIG_00430094

Foreground time interval of the image:
-74.608  10.893 (delta_t =  85.501 [sec])
Background time interval of the image:
-239.808 -74.608 (delta_t = 165.200 [sec])
Light Curves
Note: The mask-weighted lightcurves have units of either count/det or counts/sec/det, where a det is 0.4 x 0.4 = 0.16 sq cm.
Full-time range; 1 s binning
Other quick-look light curves:
- 64 ms binning (zoomed)
- 16 ms binning (zoomed)
- 8 ms binning (zoomed)
- 2 ms binning (zoomed)
- SN=5 or 10 s binning (full-time range)
- Raw light curve
Spectra
- 64 ms binning (zoomed)
- 16 ms binning (zoomed)
- 8 ms binning (zoomed)
- 2 ms binning (zoomed)
- SN=5 or 10 s binning (full-time range)
- Raw light curve
Spectra
Notes:
- 1) The fitting includes the systematic errors.
- 2) When the burst includes telescope slew time periods, the fitting uses an average response file made from multiple 5-s response files through out the slew time plus single time preiod for the non-slew times, and weighted by the total counts in the corresponding time period using addrmf. An average response file is needed becuase a spectral fit using the pre-slew DRM will introduce some errors in both a spectral shape and a normalization if the PHA file contains a lot of the slew/post-slew time interval.
- 3) For fits to more complicated models (e.g. a power-law over a cutoff power-law), the BAT team has decided to require a chi-square improvement of more than 6 for each extra dof.
Time averaged spectrum fit using the average DRM
Power-law model
Time interval is from  -74.608 sec. to   29.840 sec.

Spectral model in power-law:
------------------------------------------------------------
Parameters  : value       lower 90%   higher 90%
Photon index: -1.80865     ( -0.128332   0.125385 )
Norm@50keV  : 1.25243E-03    ( -9.66337e-05   9.53768e-05 )
------------------------------------------------------------
#Fit statistic : Chi-Squared =          82.01 using 59 PHA bins.
# Reduced chi-squared =          1.439 for     57 degrees of freedom
# Null hypothesis probability =   1.667272e-02

Photon flux (15-150 keV)    in 104.4 sec: 0.173174 ( -0.011528  0.011537 ) ph/cm2/s
Energy fluence (15-150 keV)             : 1.20356e-06 ( -9.40313e-08  9.53792e-08 ) ergs/cm2
Cutoff power-law model

Time interval is from  -74.608 sec. to   29.840 sec.
Spectral model in the cutoff power-law:
------------------------------------------------------------
Parameters  : value       lower 90%   higher 90%
Photon index: -1.47153     ( -0.423192   0.547273 )
Epeak [keV] : 69.5255      ( -21.0795 -69.5256 )
Norm@50keV  : 1.92046E-03    ( -0.000734201   0.00188436 )
------------------------------------------------------------
#Fit statistic : Chi-Squared =          80.63 using 59 PHA bins.
# Reduced chi-squared =          1.440 for     56 degrees of freedom
# Null hypothesis probability =   1.725037e-02

Photon flux (15-150 keV)    in 104.4 sec: 0.170093 ( -0.012355  0.012318 ) ph/cm2/s
Energy fluence (15-150 keV)             : 1.15862e-06 ( -1.1243e-07  1.14209e-07 ) ergs/cm2
1-s peak spectrum fit
Power-law model
Time interval is from    1.332 sec. to    2.332 sec.

Spectral model in power-law:
------------------------------------------------------------
Parameters  : value       lower 90%   higher 90%
Photon index: -1.71558     ( -0.192624   0.185776 )
Norm@50keV  : 8.89560E-03    ( -0.00109248   0.00107293 )
------------------------------------------------------------
#Fit statistic : Chi-Squared =          65.17 using 59 PHA bins.
# Reduced chi-squared =          1.143 for     57 degrees of freedom
# Null hypothesis probability =   2.138199e-01

Photon flux (15-150 keV)    in 1 sec: 1.18799 ( -0.12514  0.12515 ) ph/cm2/s
Energy fluence (15-150 keV)             : 8.22773e-08 ( -1.04896e-08  1.07114e-08 ) ergs/cm2
Cutoff power-law model
Time interval is from    1.332 sec. to    2.332 sec.
Spectral model in the cutoff power-law:
------------------------------------------------------------
Parameters  : value       lower 90%   higher 90%
Photon index: -1.08032     ( -0.705121   0.871225 )
Epeak [keV] : 63.0442      ( -17.8587 -63.0442 )
Norm@50keV  : 2.02451E-02    ( -0.0117881   0.0426242 )
------------------------------------------------------------
#Fit statistic : Chi-Squared =          62.92 using 59 PHA bins.
# Reduced chi-squared =          1.124 for     56 degrees of freedom
# Null hypothesis probability =   2.446049e-01

Photon flux (15-150 keV)    in 1 sec: 1.15832 ( -0.12926  0.1294 ) ph/cm2/s
Energy fluence (15-150 keV)             : 7.67609e-08 ( -1.18347e-08  1.23088e-08 ) ergs/cm2
Time-resolved spectra
Distribution
T90 vs. Hardness ratio plot
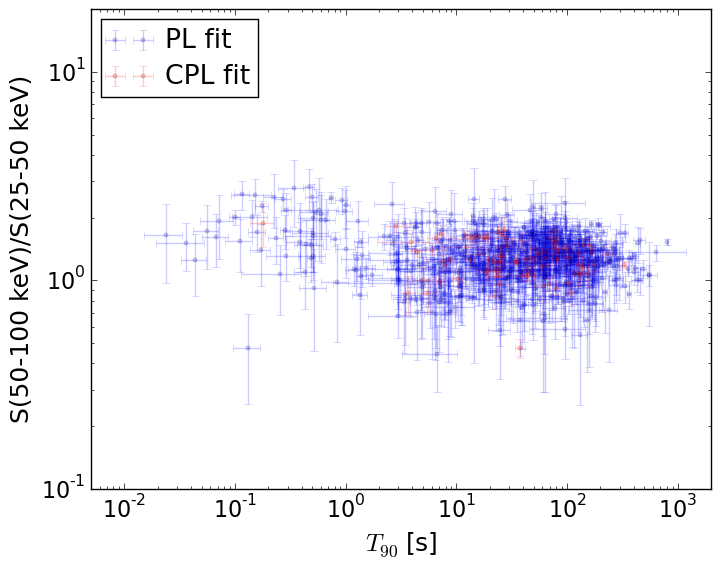
T90                                   = N/A sec.
Hardness ratio (energy fluence ratio) = N/A
S(15-50 keV) vs. S(50-150 keV) plot
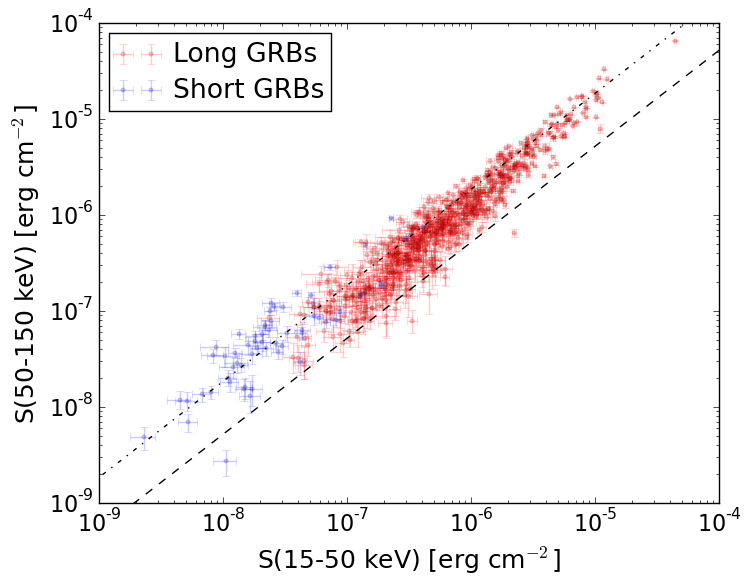
S(15-50 keV)  = N/A
S(50-150 keV) = N/A
The dash-dotted line and the dashed line traces the fluences calculated from the Band function with Epeak = 15 and 150 keV, respectively. Both lines assume a canonical values of alpha = -1 and beta = -2.5.
Mask shadow pattern
IMX = -1.201474119564260E-01, IMY = 1.841542455666287E-01
Spacecraft aspect plot
Bright source in the pre-burst/pre-slew/post-slew images
Pre-burst image of 15-350 keV band
Time interval of the image:
-239.808000 -74.608000

# RAcent  DECcent POSerr Theta    Phi  PeakCts   SNR AngSep     Name
#  [deg]    [deg]    ['] [deg]  [deg]                   [']
135.4102 -40.5238    6.9  29.2  178.2   0.2218   1.7    5.7	Vela X-1
170.3880 -60.6205   12.3  34.1  121.2   0.2179   0.9    2.1	Cen X-3
186.9335 -62.7113   35.7  38.5  109.7   0.1347   0.3    8.4	GX 301-2
193.9563  -1.6048    2.7  36.3   -4.4   0.7163   4.2 ------	UNKNOWN
111.2922 -13.2450    2.5  53.2 -142.3   3.0644   4.6 ------	UNKNOWN
168.2178  20.4419    4.2  47.1  -53.2   1.5660   2.7 ------	UNKNOWN
Pre-slew background subtracted image of 15-350 keV band
Time interval of the image:
-74.608000 10.892600

# RAcent  DECcent POSerr Theta    Phi  PeakCts   SNR AngSep     Name
#  [deg]    [deg]    ['] [deg]  [deg]                   [']
135.5193 -40.5433    8.6  29.1  178.1   0.1494   1.3    0.8	Vela X-1
170.1760 -60.7013    6.5  34.2  121.4   0.3414   1.8    6.2	Cen X-3
186.5859 -62.8166    4.1  38.5  110.0   0.9457   2.8    3.4	GX 301-2
192.4021 -51.9517    2.6  31.9   94.0   0.8458   4.4 ------	UNKNOWN
154.1819 -21.4096    0.7  12.4 -123.1   1.6082  15.8 ------	UNKNOWN
Post-slew image of 15-350 keV band
Time interval of the image:
45.492600 349.644000
351.192000 962.281300

# RAcent  DECcent POSerr Theta    Phi  PeakCts   SNR AngSep     Name
#  [deg]    [deg]    ['] [deg]  [deg]                   [']
135.2900 -40.5290    6.2  25.0  161.5  -0.9624  -1.8   11.0	Vela X-1
170.4094 -60.7373    5.4  41.0  113.9   3.5109   2.1    7.4	Cen X-3
 89.9845 -35.7208    3.7  57.2 -173.7   7.0857   3.1 ------	UNKNOWN