Analysis Summary
Notes:
- 1) No attempt has been made to eliminate the non-significant decimal places.
- 2) This batgrbproduct analysis is done using the HEASARC data.
- 3) This batgrbproduct analysis is using the flight position for the mask-weighting calculation.
======================================================================
BAT GRB EVENT DATA PROCESSING REPORT
Process Script Ver: batgrbproduct v2.46
Process Start Time: Fri Jan 17 17:08:01 EST 2014
Host Name: batevent1
Current Working Dir: /local/data/batevent/batevent_reproc/trigger430151
======================================================================
Trigger: 00430151 Segment: 000
BAT Trigger Time: 301976310.272 [s; MET]
Trigger Stop: 301976311.296 [s; MET]
UTC: 2010-07-28T02:18:24.246260 [includes UTCF correction]
Where From?: TDRSS position message
BAT
RA: 88.7434860359876 Dec: -15.2620375155607 [deg; J2000]
Catalogged Source?: NO
Point Source?: YES
GRB Indicated?: YES [ by BAT flight software ]
Image S/N Ratio: 18.8
Image Trigger?: NO
Rate S/N Ratio: 47.6235235991626 [ if not an image trigger ]
Image S/N Ratio: 18.8
Analysis Position: [ source = BAT ]
RA: 88.7434860359876 Dec: -15.2620375155607 [deg; J2000]
Refined Position: [ source = BAT pre-slew burst ]
RA: 88.7537300185916 Dec: -15.2589432023787 [deg; J2000]
{ 05h 55m 00.9s , -15d 15' 32.2" }
+/- 0.479935230999046 [arcmin] (estimated 90% radius based on SNR)
+/- 0.117133370071712 [arcmin] (formal 1-sigma fit error)
SNR: 86.8104011812859
Angular difference between the analysis and refined position is 0.621352 arcmin
Partial Coding Fraction: 0.8125 [ including projection effects ]
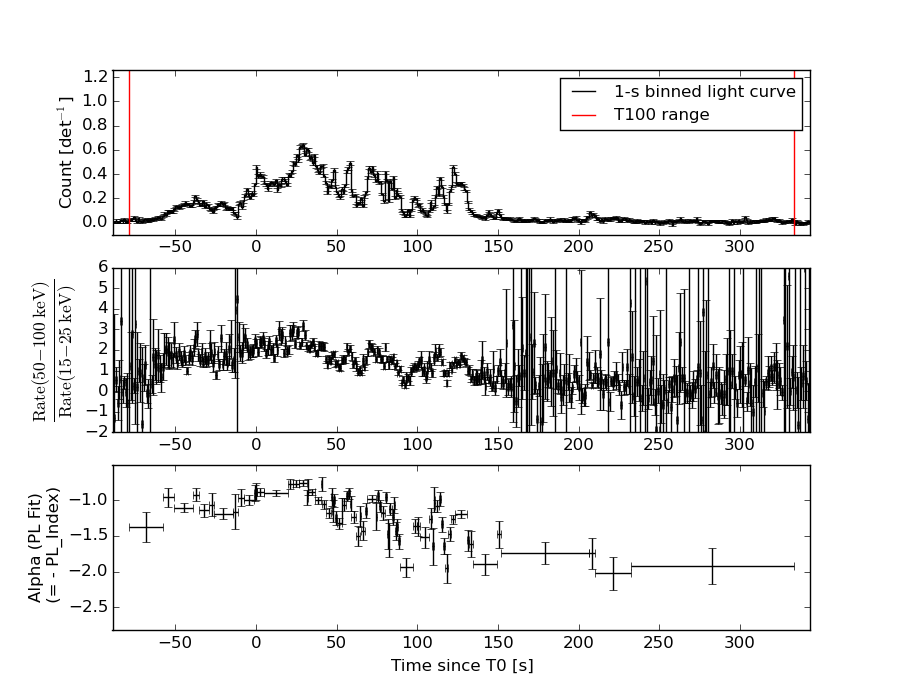
Duration
T90: 193.383999943733 +/- 10.5706947895089
Measured from: -39.6800000071526
to: 153.703999936581 [s; relative to TRIGTIME]
T50: 72.6279999613762 +/- 1.01713325763232
Measured from: 12.6879999637604
to: 85.3159999251366 [s; relative to TRIGTIME]
Fluence
Peak Flux (peak 1 second)
Measured from: 28.2639999985695
to: 29.2639999985695 [s; relative to TRIGTIME]
Total Fluence
Measured from: -79.0080000162125
to: 333.551999986172 [s; relative to TRIGTIME]
Band 1 Band 2 Band 3 Band 4
15-25 25-50 50-100 100-350 keV
Total 11.341510 18.275949 18.211913 6.125598
0.107760 0.115613 0.108212 0.091654 [error]
Peak 0.093622 0.185406 0.274885 0.110421
0.006738 0.008205 0.009069 0.007606 [error]
[ fluence units of on-axis counts / fully illuminated detector ]
======================================================================
====== Table of the duration information =============================
Value tstart tstop
T100 412.560 -79.008 333.552
T90 193.384 -39.680 153.704
T50 72.628 12.688 85.316
Peak 1.000 28.264 29.264
====== Spectral Analysis Summary =====================================
Model : spectral model: simple power-law (PL) and cutoff power-law (CPL)
Ph_index : photon index: E^{Ph_index}
Ph_90err : 90% error of the photon index
Epeak : Epeak in keV
Epeak_90err: 90% error of Epeak
Norm : normalization at 50 keV in both the PL model and CPL model
Nomr_90err : 90% error of the normalization
chi2 : Chi-Squared
dof : degree of freedo
=== Time-averaged spectral analysis ===
(Best model with acceptable fit: PL)
Model Ph_index Ph_90err_low Ph_90err_hi Epeak Epeak_90err_low Epeak_90err_hi Norm Nomr_90err_low Norm_90err_hi chi2 dof
PL -1.123 -0.023 0.023 - - - 8.70e-03 -1.19e-04 1.18e-04 23.190 57
CPL -1.059 -0.026 0.042 996.915 -996.915 -996.915 9.19e-03 -5.54e-04 3.12e-05 25.840 56
=== 1-s peak spectral analysis ===
(Best model with acceptable fit: PL)
Model Ph_index Ph_90err_low Ph_90err_hi Epeak Epeak_90err_low Epeak_90err_hi Norm Nomr_90err_low Norm_90err_hi chi2 dof
PL -0.701 -0.076 0.078 - - - 4.32e-02 -1.88e-03 1.87e-03 70.640 57
CPL -0.694 -0.075 0.080 9999.360 -9999.360 -9999.360 4.36e-02 -1.79e-03 8.44e-03 70.710 56
=== Fluence/Peak Flux Summary ===
Model Band1 Band2 Band3 Band4 Band5 Total
15-25 25-50 50-100 100-350 15-150 15-350 keV
Fluence PL 3.22e-06 7.47e-06 1.37e-05 6.03e-05 3.73e-05 8.47e-05 erg/cm2
90%_error_low -9.83e-08 -1.37e-07 -1.66e-07 -1.75e-06 -4.43e-07 -1.75e-06 erg/cm2
90%_error_hi 9.98e-08 1.37e-07 1.66e-07 1.78e-06 4.43e-07 1.78e-06 erg/cm2
Peak flux PL 8.32e-01 1.35e+00 1.67e+00 4.04e+00 5.00e+00 7.89e+00 ph/cm2/s
90%_error_low -7.95e-02 -7.90e-02 -6.98e-02 -3.78e-01 -2.07e-01 -3.95e-01 ph/cm2/s
90%_error_hi 8.26e-02 7.85e-02 6.95e-02 4.05e-01 2.08e-01 4.07e-01 ph/cm2/s
Fluence CPL 2.43e-06 3.20e-06 3.24e-06 7.45e-06 1.09e-05 1.63e-05 erg/cm2
90%_error_low -1.68e-07 -2.00e-07 -1.89e-07 -2.73e-07 -7.02e-07 -7.23e-07 erg/cm2
90%_error_hi 1.40e-07 1.43e-07 1.14e-07 1.68e-07 3.64e-07 4.39e-07 erg/cm2
Peak flux CPL 8.30e-01 1.35e+00 1.67e+00 4.01e+00 5.00e+00 7.86e+00 ph/cm2/s
90%_error_low N/A -7.91e-02 N/A N/A -2.07e-01 N/A ph/cm2/s
90%_error_hi N/A 7.86e-02 N/A N/A 2.08e-01 N/A ph/cm2/s
======================================================================
Image
Pre-slew 15.0-350.0 keV image (Event data)
#   RAcent    DECcent   POSerr    Theta     Phi              Peak Cts       SNR   Name
   88.7537   -15.2589   0.0022    29.3945  -177.0203         7.5304324     86.810 TRIG_00430151

Foreground time interval of the image:
-15.571  13.229 (delta_t =  28.800 [sec])
Background time interval of the image:
Light Curves
Note: The mask-weighted lightcurves have units of either count/det or counts/sec/det, where a det is 0.4 x 0.4 = 0.16 sq cm.
Full-time range; 1 s binning
Other quick-look light curves:
- 64 ms binning (zoomed)
- 16 ms binning (zoomed)
- 8 ms binning (zoomed)
- 2 ms binning (zoomed)
- SN=5 or 10 s binning (full-time range)
- Raw light curve
Spectra
- 64 ms binning (zoomed)
- 16 ms binning (zoomed)
- 8 ms binning (zoomed)
- 2 ms binning (zoomed)
- SN=5 or 10 s binning (full-time range)
- Raw light curve
Spectra
Notes:
- 1) The fitting includes the systematic errors.
- 2) When the burst includes telescope slew time periods, the fitting uses an average response file made from multiple 5-s response files through out the slew time plus single time preiod for the non-slew times, and weighted by the total counts in the corresponding time period using addrmf. An average response file is needed becuase a spectral fit using the pre-slew DRM will introduce some errors in both a spectral shape and a normalization if the PHA file contains a lot of the slew/post-slew time interval.
- 3) For fits to more complicated models (e.g. a power-law over a cutoff power-law), the BAT team has decided to require a chi-square improvement of more than 6 for each extra dof.
Time averaged spectrum fit using the average DRM
Power-law model
Time interval is from  -79.008 sec. to  333.552 sec.

Spectral model in power-law:
------------------------------------------------------------
Parameters  : value       lower 90%   higher 90%
Photon index: -1.12258     ( -0.0232794   0.0233831 )
Norm@50keV  : 8.70306E-03    ( -0.000118695   0.000118231 )
------------------------------------------------------------
#Fit statistic : Chi-Squared =          23.19 using 59 PHA bins.
# Reduced chi-squared =         0.4068 for     57 degrees of freedom
# Null hypothesis probability =   9.999803e-01

Photon flux (15-150 keV)    in 412.6 sec: 1.01182 ( -0.015134  0.0152 ) ph/cm2/s
Energy fluence (15-150 keV)             : 3.72811e-05 ( -4.42864e-07  4.42996e-07 ) ergs/cm2
Cutoff power-law model
Time interval is from  -79.008 sec. to  333.552 sec.
Spectral model in the cutoff power-law:
------------------------------------------------------------
Parameters  : value       lower 90%   higher 90%
Photon index: -1.11666     ( -0.0257291   0.0417934 )
Epeak [keV] : 9996.15      ( -9996.45 -9996.45 )
Norm@50keV  : 8.74750E-03    ( -0.000110763   0.000474246 )
------------------------------------------------------------
#Fit statistic : Chi-Squared =          23.33 using 59 PHA bins.
# Reduced chi-squared =         0.4166 for     56 degrees of freedom
# Null hypothesis probability =   9.999654e-01

Photon flux (15-150 keV)    in 412.6 sec: 1.01474 (    ) ph/cm2/s
Energy fluence (15-150 keV)             : 1.08938e-05 ( -7.02035e-07  3.64153e-07 ) ergs/cm2
1-s peak spectrum fit
Power-law model

Time interval is from   28.264 sec. to   29.264 sec.

Spectral model in power-law:
------------------------------------------------------------
Parameters  : value       lower 90%   higher 90%
Photon index: -0.700784     ( -0.0762993   0.0775793 )
Norm@50keV  : 4.32418E-02    ( -0.00188355   0.00187153 )
------------------------------------------------------------
#Fit statistic : Chi-Squared =          70.64 using 59 PHA bins.
# Reduced chi-squared =          1.239 for     57 degrees of freedom
# Null hypothesis probability =   1.057685e-01

Photon flux (15-150 keV)    in 1 sec: 4.99798 ( -0.20737  0.20768 ) ph/cm2/s
Energy fluence (15-150 keV)             : 5.27691e-07 ( -2.33085e-08  2.33577e-08 ) ergs/cm2
Cutoff power-law model
Time interval is from   28.264 sec. to   29.264 sec.
Spectral model in the cutoff power-law:
------------------------------------------------------------
Parameters  : value       lower 90%   higher 90%
Photon index: -0.694476     ( -0.0752392   0.0799785 )
Epeak [keV] : 9999.36      ( -9999.36 -9999.36 )
Norm@50keV  : 4.35923E-02    ( -0.00178407   0.00843932 )
------------------------------------------------------------
#Fit statistic : Chi-Squared =          70.71 using 59 PHA bins.
# Reduced chi-squared =          1.263 for     56 degrees of freedom
# Null hypothesis probability =   8.917301e-02

Photon flux (15-150 keV)    in 1 sec: 4.99648 ( -0.20741  0.20754 ) ph/cm2/s
Energy fluence (15-150 keV)             : 5.29176e-07 ( -2.95213e-08  2.63572e-08 ) ergs/cm2
Time-resolved spectra
Distribution
T90 vs. Hardness ratio plot
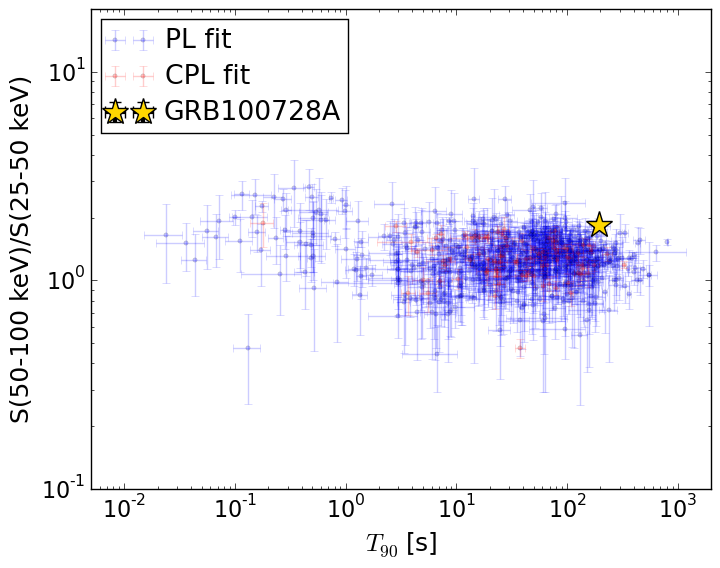
T90                                   = 193.384 sec.
Hardness ratio (energy fluence ratio) = 1.83713043676
S(15-50 keV) vs. S(50-150 keV) plot
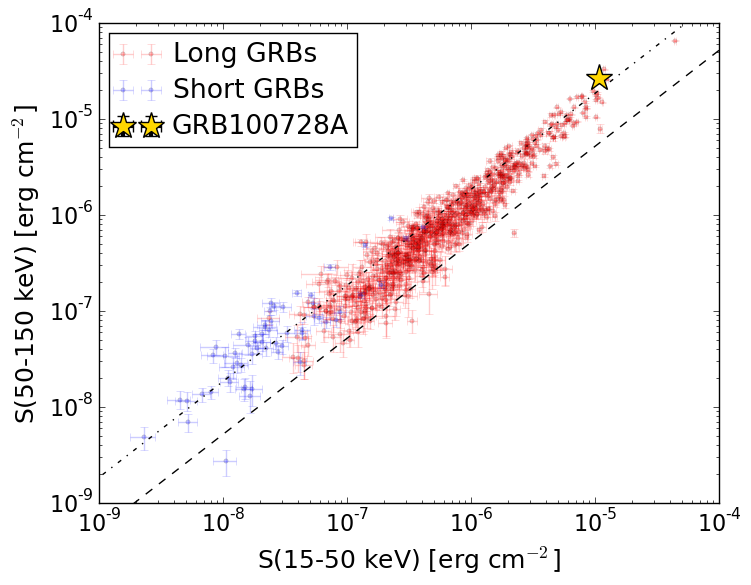
S(15-50 keV)  = 1.0692653e-05
S(50-150 keV) = 2.658882e-05
The dash-dotted line and the dashed line traces the fluences calculated from the Band function with Epeak = 15 and 150 keV, respectively. Both lines assume a canonical values of alpha = -1 and beta = -2.5.
Mask shadow pattern
IMX = -5.625835373988104E-01, IMY = 2.928403708244022E-02
Spacecraft aspect plot
Bright source in the pre-burst/pre-slew/post-slew images
Pre-burst image of 15-350 keV band
Time interval of the image:
Pre-slew background subtracted image of 15-350 keV band
Time interval of the image:
-15.571410 13.228580

# RAcent  DECcent POSerr Theta    Phi  PeakCts   SNR AngSep     Name
#  [deg]    [deg]    ['] [deg]  [deg]                   [']
135.5846 -40.4930    2.6  18.5   12.1   0.3539   4.5    4.5	Vela X-1
170.5645 -60.5169    3.9  46.1   32.4   0.6861   3.0    9.7	Cen X-3
 82.9128 -65.8669    2.6  40.0   86.6   1.4257   4.4 ------	UNKNOWN
 79.6909 -20.7412    1.9  33.9  165.5   0.6062   6.0 ------	UNKNOWN
 88.7537 -15.2589    0.1  29.4 -177.0   7.5305  86.8 ------	UNKNOWN
 80.7420  -6.9068    2.6  40.8 -174.5   0.5051   4.5 ------	UNKNOWN
Post-slew image of 15-350 keV band
Time interval of the image:
65.828600 962.828500

# RAcent  DECcent POSerr Theta    Phi  PeakCts   SNR AngSep     Name
#  [deg]    [deg]    ['] [deg]  [deg]                   [']
 83.6278  22.0192    0.2  37.6 -146.8  35.0718  48.3    0.4	Crab
135.5223 -40.5409    1.7  47.7   -7.5   7.0920   6.8    0.9	Vela X-1
 93.3659 -61.1223    3.2  46.0   37.9   6.8725   3.6 ------	UNKNOWN
112.7525 -56.1962    2.8  44.8   22.3   4.3962   4.2 ------	UNKNOWN
 74.6165  -3.5001    2.5  18.2  169.8   2.2619   4.7 ------	UNKNOWN
 88.7610 -15.2598    0.3   0.0  -76.7  22.3001  41.8 ------	UNKNOWN
 84.7224  26.3547    1.7  41.8 -144.4   5.9298   6.7 ------	UNKNOWN