Analysis Summary
Notes:
- 1) No attempt has been made to eliminate the non-significant decimal places.
- 2) This batgrbproduct analysis is done using the HEASARC data.
- 3) This batgrbproduct analysis is using the flight position for the mask-weighting calculation.
======================================================================
BAT GRB EVENT DATA PROCESSING REPORT
Process Script Ver: batgrbproduct v2.46
Process Start Time: Fri Jan 17 16:59:12 EST 2014
Host Name: batevent1
Current Working Dir: /local/data/batevent/batevent_reproc/trigger430172
======================================================================
Trigger: 00430172 Segment: 000
BAT Trigger Time: 302005921.856 [s; MET]
Trigger Stop: 302005922.88 [s; MET]
UTC: 2010-07-28T10:31:55.829200 [includes UTCF correction]
Where From?: TDRSS position message
BAT
RA: 44.0530055621985 Dec: 0.27954807728338 [deg; J2000]
Catalogged Source?: NO
Point Source?: YES
GRB Indicated?: YES [ by BAT flight software ]
Image S/N Ratio: 9.07
Image Trigger?: NO
Rate S/N Ratio: 22.4499443206436 [ if not an image trigger ]
Image S/N Ratio: 9.07
Analysis Position: [ source = BAT ]
RA: 44.0530055621985 Dec: 0.27954807728338 [deg; J2000]
Refined Position: [ source = BAT pre-slew burst ]
RA: 44.050972895668 Dec: 0.296290443876571 [deg; J2000]
{ 02h 56m 12.2s , +00d 17' 46.6" }
+/- 1.48438603528959 [arcmin] (estimated 90% radius based on SNR)
+/- 0.378504934007746 [arcmin] (formal 1-sigma fit error)
SNR: 17.3002124815293
Angular difference between the analysis and refined position is 1.011918 arcmin
Partial Coding Fraction: 0.1132812 [ including projection effects ]
Duration
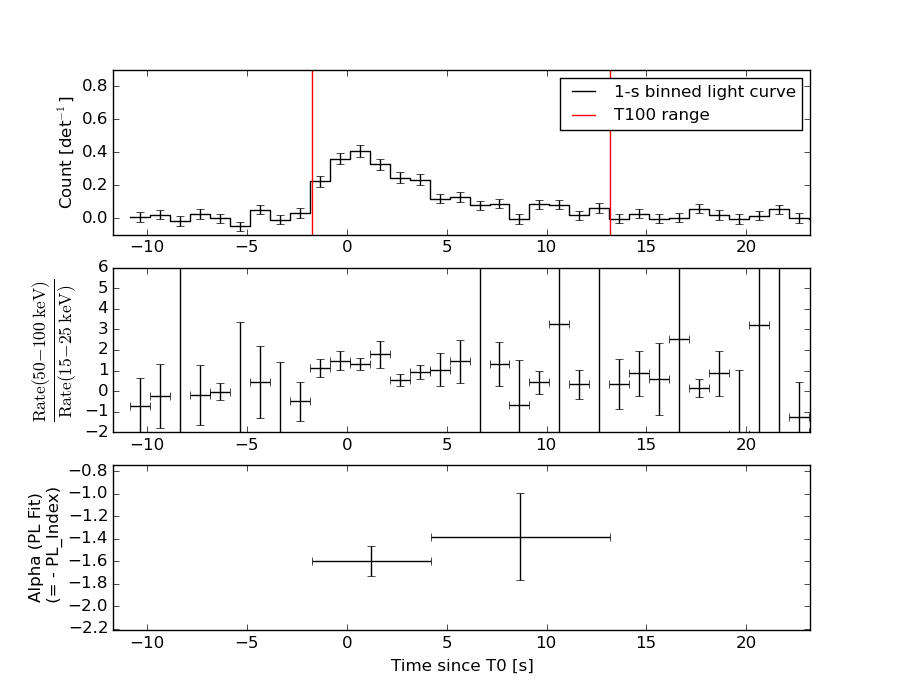
T90: 12.0800000429153 +/- 2.73632743473403
Measured from: -1.28000003099442
to: 10.8000000119209 [s; relative to TRIGTIME]
T50: 4.24000006914139 +/- 1.32715634477846
Measured from: 0.191999971866608
to: 4.432000041008 [s; relative to TRIGTIME]
Fluence
Peak Flux (peak 1 second)
Measured from: -0.65200001001358
to: 0.34799998998642 [s; relative to TRIGTIME]
Total Fluence
Measured from: -1.74400001764297
to: 13.1999999880791 [s; relative to TRIGTIME]
Band 1 Band 2 Band 3 Band 4
15-25 25-50 50-100 100-350 keV
Total 0.551394 0.929337 0.752256 0.234375
0.063173 0.068249 0.060173 0.049528 [error]
Peak 0.067621 0.175138 0.128493 0.041964
0.017676 0.021196 0.018313 0.014161 [error]
[ fluence units of on-axis counts / fully illuminated detector ]
======================================================================
====== Table of the duration information =============================
Value tstart tstop
T100 14.944 -1.744 13.200
T90 12.080 -1.280 10.800
T50 4.240 0.192 4.432
Peak 1.000 -0.652 0.348
====== Spectral Analysis Summary =====================================
Model : spectral model: simple power-law (PL) and cutoff power-law (CPL)
Ph_index : photon index: E^{Ph_index}
Ph_90err : 90% error of the photon index
Epeak : Epeak in keV
Epeak_90err: 90% error of Epeak
Norm : normalization at 50 keV in both the PL model and CPL model
Nomr_90err : 90% error of the normalization
chi2 : Chi-Squared
dof : degree of freedo
=== Time-averaged spectral analysis ===
(Best model with acceptable fit: PL)
Model Ph_index Ph_90err_low Ph_90err_hi Epeak Epeak_90err_low Epeak_90err_hi Norm Nomr_90err_low Norm_90err_hi chi2 dof
PL -1.543 -0.141 0.141 - - - 1.19e-02 -9.69e-04 9.66e-04 52.670 57
CPL -1.341 -0.325 0.595 173.179 -173.179 -173.179 1.48e-02 -1.48e-02 1.34e-02 52.270 56
=== 1-s peak spectral analysis ===
(Best model with acceptable fit: PL)
Model Ph_index Ph_90err_low Ph_90err_hi Epeak Epeak_90err_low Epeak_90err_hi Norm Nomr_90err_low Norm_90err_hi chi2 dof
PL -1.536 -0.225 0.225 - - - 2.75e-02 -4.11e-03 4.10e-03 48.580 57
CPL -0.157 -1.042 1.393 66.425 -14.165 54.693 1.40e-01 -1.40e-01 5.72e-01 43.100 56
=== Fluence/Peak Flux Summary ===
Model Band1 Band2 Band3 Band4 Band5 Total
15-25 25-50 50-100 100-350 15-150 15-350 keV
Fluence PL 2.36e-07 4.22e-07 5.79e-07 1.65e-06 1.67e-06 2.88e-06 erg/cm2
90%_error_low -3.34e-08 -3.72e-08 -5.94e-08 -3.37e-07 -1.44e-07 -3.86e-07 erg/cm2
90%_error_hi 3.49e-08 3.69e-08 5.89e-08 3.90e-07 1.45e-07 4.25e-07 erg/cm2
Peak flux PL 1.17e+00 1.16e+00 7.97e-01 8.67e-01 3.47e+00 3.99e+00 ph/cm2/s
90%_error_low -2.77e-01 -1.86e-01 -1.39e-01 -2.62e-01 -5.34e-01 -5.90e-01 ph/cm2/s
90%_error_hi 2.94e-01 1.84e-01 1.38e-01 3.17e-01 5.35e-01 5.91e-01 ph/cm2/s
Fluence CPL 2.26e-07 4.30e-07 5.90e-07 1.24e-06 1.65e-06 2.49e-06 erg/cm2
90%_error_low -4.10e-08 -4.24e-08 -6.60e-08 -6.29e-07 -1.53e-07 -6.41e-07 erg/cm2
90%_error_hi 2.15e-08 4.38e-08 6.77e-08 8.24e-07 1.52e-07 7.65e-07 erg/cm2
Peak flux CPL 9.35e-01 1.33e+00 9.01e-01 2.70e-01 3.38e+00 3.44e+00 ph/cm2/s
90%_error_low -3.16e-01 -2.39e-01 -1.70e-01 N/A -5.39e-01 -5.70e-01 ph/cm2/s
90%_error_hi 3.38e-01 2.54e-01 1.74e-01 N/A 5.41e-01 6.00e-01 ph/cm2/s
======================================================================
Image
Pre-slew 15.0-350.0 keV image (Event data)
#   RAcent    DECcent   POSerr    Theta     Phi              Peak Cts       SNR   Name
   44.0510     0.2963   0.0111    46.8548   146.2842         2.5566847     17.300 TRIG_00430172

Foreground time interval of the image:
 -1.744  13.200 (delta_t =  14.944 [sec])
Background time interval of the image:
-239.856  -1.744 (delta_t = 238.112 [sec])
Light Curves
Note: The mask-weighted lightcurves have units of either count/det or counts/sec/det, where a det is 0.4 x 0.4 = 0.16 sq cm.
Full-time range; 1 s binning
Other quick-look light curves:
- 64 ms binning (zoomed)
- 16 ms binning (zoomed)
- 8 ms binning (zoomed)
- 2 ms binning (zoomed)
- SN=5 or 10 s binning (full-time range)
- Raw light curve
Spectra
- 64 ms binning (zoomed)
- 16 ms binning (zoomed)
- 8 ms binning (zoomed)
- 2 ms binning (zoomed)
- SN=5 or 10 s binning (full-time range)
- Raw light curve
Spectra
Notes:
- 1) The fitting includes the systematic errors.
- 2) When the burst includes telescope slew time periods, the fitting uses an average response file made from multiple 5-s response files through out the slew time plus single time preiod for the non-slew times, and weighted by the total counts in the corresponding time period using addrmf. An average response file is needed becuase a spectral fit using the pre-slew DRM will introduce some errors in both a spectral shape and a normalization if the PHA file contains a lot of the slew/post-slew time interval.
- 3) For fits to more complicated models (e.g. a power-law over a cutoff power-law), the BAT team has decided to require a chi-square improvement of more than 6 for each extra dof.
Time averaged spectrum fit using the average DRM
Power-law model
Time interval is from   -1.744 sec. to   13.200 sec.

Spectral model in power-law:
------------------------------------------------------------
Parameters  : value       lower 90%   higher 90%
Photon index: -1.54334     ( -0.141504   0.14059 )
Norm@50keV  : 1.18576E-02    ( -0.00096912   0.000966135 )
------------------------------------------------------------
#Fit statistic : Chi-Squared =          52.67 using 59 PHA bins.
# Reduced chi-squared =         0.9241 for     57 degrees of freedom
# Null hypothesis probability =   6.379863e-01

Photon flux (15-150 keV)    in 14.94 sec: 1.49827 ( -0.12829  0.12866 ) ph/cm2/s
Energy fluence (15-150 keV)             : 1.66956e-06 ( -1.44417e-07  1.45081e-07 ) ergs/cm2
Cutoff power-law model
Time interval is from   -1.744 sec. to   13.200 sec.
Spectral model in the cutoff power-law:
------------------------------------------------------------
Parameters  : value       lower 90%   higher 90%
Photon index: -1.34147     ( -0.324936   0.595242 )
Epeak [keV] : 173.179      ( -173.179 -173.179 )
Norm@50keV  : 1.48494E-02    ( -0.0148494   0.0134432 )
------------------------------------------------------------
#Fit statistic : Chi-Squared =          52.27 using 59 PHA bins.
# Reduced chi-squared =         0.9335 for     56 degrees of freedom
# Null hypothesis probability =   6.166998e-01

Photon flux (15-150 keV)    in 14.94 sec: 1.48443 ( -0.13331  0.13364 ) ph/cm2/s
Energy fluence (15-150 keV)             : 1.65287e-06 ( -1.52839e-07  1.51726e-07 ) ergs/cm2
1-s peak spectrum fit
Power-law model
Time interval is from   -0.652 sec. to    0.348 sec.

Spectral model in power-law:
------------------------------------------------------------
Parameters  : value       lower 90%   higher 90%
Photon index: -1.53579     ( -0.225057   0.224616 )
Norm@50keV  : 2.75375E-02    ( -0.0041068   0.00409865 )
------------------------------------------------------------
#Fit statistic : Chi-Squared =          48.58 using 59 PHA bins.
# Reduced chi-squared =         0.8522 for     57 degrees of freedom
# Null hypothesis probability =   7.787775e-01

Photon flux (15-150 keV)    in 1 sec: 3.47207 ( -0.53362  0.53539 ) ph/cm2/s
Energy fluence (15-150 keV)             : 2.59806e-07 ( -4.06012e-08  4.08016e-08 ) ergs/cm2
Cutoff power-law model
Time interval is from   -0.652 sec. to    0.348 sec.
Spectral model in the cutoff power-law:
------------------------------------------------------------
Parameters  : value       lower 90%   higher 90%
Photon index: -0.157096     ( -1.04166   1.39283 )
Epeak [keV] : 66.4253      ( -14.1655 54.6931 )
Norm@50keV  : 0.140041    ( -0.140041   0.572292 )
------------------------------------------------------------
#Fit statistic : Chi-Squared =          43.10 using 59 PHA bins.
# Reduced chi-squared =         0.7697 for     56 degrees of freedom
# Null hypothesis probability =   8.966477e-01

Photon flux (15-150 keV)    in 1 sec: 3.37575 ( -0.53913  0.54137 ) ph/cm2/s
Energy fluence (15-150 keV)             : 2.45076e-07 ( -4.22424e-08  4.28229e-08 ) ergs/cm2
Time-resolved spectra
Distribution
T90 vs. Hardness ratio plot
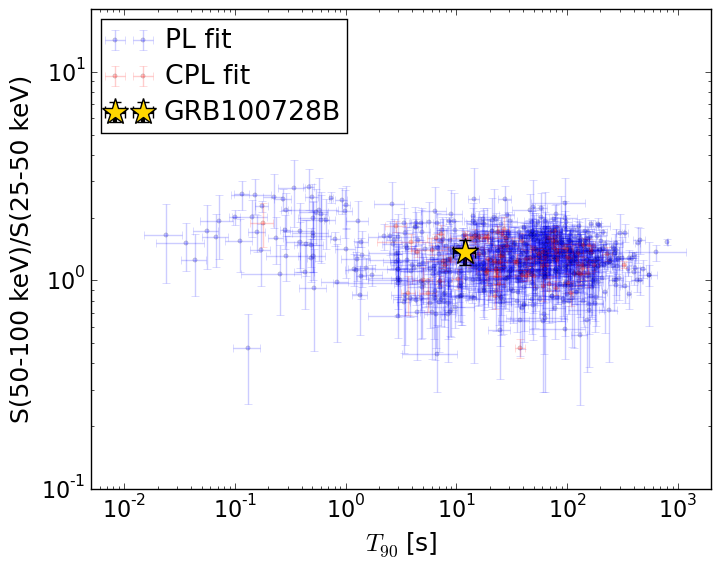
T90                                   = 12.08 sec.
Hardness ratio (energy fluence ratio) = 1.37239809592
S(15-50 keV) vs. S(50-150 keV) plot
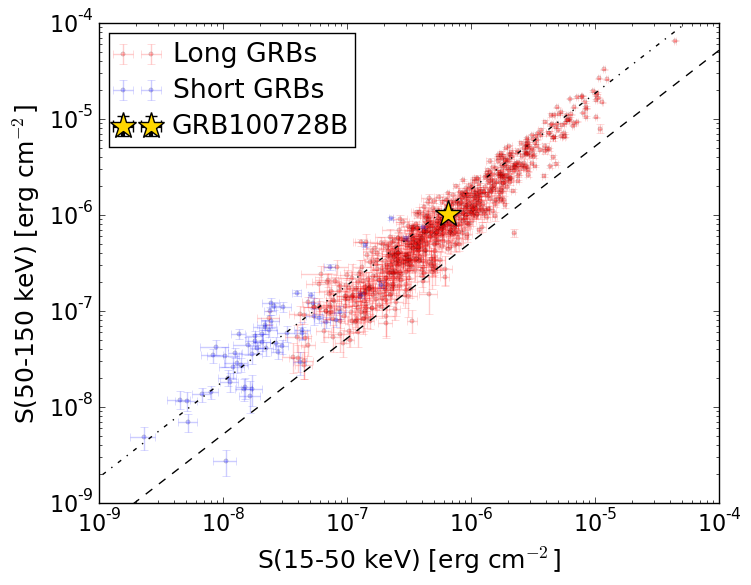
S(15-50 keV)  = 6.571974e-07
S(50-150 keV) = 1.012354e-06
The dash-dotted line and the dashed line traces the fluences calculated from the Band function with Epeak = 15 and 150 keV, respectively. Both lines assume a canonical values of alpha = -1 and beta = -2.5.
Mask shadow pattern
IMX = -8.874768828778155E-01, IMY = -5.922265412191633E-01
Spacecraft aspect plot
Bright source in the pre-burst/pre-slew/post-slew images
Pre-burst image of 15-350 keV band
Time interval of the image:
-239.856000 -1.744000

# RAcent  DECcent POSerr Theta    Phi  PeakCts   SNR AngSep     Name
#  [deg]    [deg]    ['] [deg]  [deg]                   [']
 83.6429  22.0213    0.3  37.6 -146.8   9.2403  36.9    0.7	Crab
135.4927 -40.5278    2.3  47.6   -7.5   1.8244   5.0    2.3	Vela X-1
 82.6387 -48.9023    2.5  34.0   48.3   1.4171   4.7 ------	UNKNOWN
135.7243 -23.4102    3.9  44.8  -31.0   0.9662   2.9 ------	UNKNOWN
 84.7293  26.3326    1.5  41.8 -144.4   2.3260   7.7 ------	UNKNOWN
Pre-slew background subtracted image of 15-350 keV band
Time interval of the image:
-1.744000 13.200000

# RAcent  DECcent POSerr Theta    Phi  PeakCts   SNR AngSep     Name
#  [deg]    [deg]    ['] [deg]  [deg]                   [']
 83.4242  22.0208   12.8  37.7 -147.1  -0.0472  -0.9   11.6	Crab
135.4396 -40.6339    3.5  47.6   -7.3   0.2396   3.3    6.2	Vela X-1
 71.7737 -54.1356    2.1  41.1   56.1   0.6866   5.6 ------	UNKNOWN
 44.0510   0.2963    0.7  46.9  146.3   2.5568  17.3 ------	UNKNOWN
 59.5595   4.7369    2.2  35.2  163.4   0.2826   5.3 ------	UNKNOWN
Post-slew image of 15-350 keV band
Time interval of the image:
80.644600 267.644600

# RAcent  DECcent POSerr Theta    Phi  PeakCts   SNR AngSep     Name
#  [deg]    [deg]    ['] [deg]  [deg]                   [']
 46.5138  11.9331    1.9  11.9 -149.0   0.7779   6.1 ------	UNKNOWN
 80.1181   4.1283    3.2  36.2  -77.4   1.0970   3.6 ------	UNKNOWN
 82.7902  14.3509    3.1  40.8  -92.7   2.1760   3.7 ------	UNKNOWN