Analysis Summary
Notes:
- 1) No attempt has been made to eliminate the non-significant decimal places.
- 2) This batgrbproduct analysis is done using the HEASARC data.
- 3) This batgrbproduct analysis is using the flight position for the mask-weighting calculation.
======================================================================
BAT GRB EVENT DATA PROCESSING REPORT
Process Script Ver: batgrbproduct v2.46
Process Start Time: Fri Jan 17 16:55:29 EST 2014
Host Name: batevent1
Current Working Dir: /local/data/batevent/batevent_reproc/trigger430603
======================================================================
Trigger: 00430603 Segment: 000
BAT Trigger Time: 302420742.208 [s; MET]
Trigger Stop: 302420743.232 [s; MET]
UTC: 2010-08-02T05:45:36.166420 [includes UTCF correction]
Where From?: TDRSS position message
BAT
RA: 2.45693694544105 Dec: 47.7518131459574 [deg; J2000]
Catalogged Source?: NO
Point Source?: YES
GRB Indicated?: YES [ by BAT flight software ]
Image S/N Ratio: 7.45
Image Trigger?: NO
Rate S/N Ratio: 13.6014705087354 [ if not an image trigger ]
Image S/N Ratio: 7.45
Analysis Position: [ source = BAT ]
RA: 2.45693694544105 Dec: 47.7518131459574 [deg; J2000]
Refined Position: [ source = BAT pre-slew burst ]
RA: 2.47960573229079 Dec: 47.754237486235 [deg; J2000]
{ 00h 09m 55.1s , +47d 45' 15.3" }
+/- 1.06859250294004 [arcmin] (estimated 90% radius based on SNR)
+/- 0.287678017489466 [arcmin] (formal 1-sigma fit error)
SNR: 27.6667537339096
Angular difference between the analysis and refined position is 0.925948 arcmin
Partial Coding Fraction: 0.84375 [ including projection effects ]
Duration
T90: 487.339999973774 +/- 26.4184920237378
Measured from: 0.255999982357025
to: 487.595999956131 [s; relative to TRIGTIME]
T50: 355.987999916077 +/- 33.1335054317481
Measured from: 22.5040000081062
to: 378.491999924183 [s; relative to TRIGTIME]
Fluence
Peak Flux (peak 1 second)
Measured from: -0.0759999752044678
to: 0.924000024795532 [s; relative to TRIGTIME]
Total Fluence
Measured from: -3.29199999570847
to: 531.77999997139 [s; relative to TRIGTIME]
Band 1 Band 2 Band 3 Band 4
15-25 25-50 50-100 100-350 keV
Total 2.043257 2.485008 1.517021 0.292843
0.109002 0.111709 0.098021 0.085527 [error]
Peak 0.014038 0.044113 0.048557 0.009605
0.005434 0.005905 0.005510 0.004445 [error]
[ fluence units of on-axis counts / fully illuminated detector ]
======================================================================
====== Table of the duration information =============================
Value tstart tstop
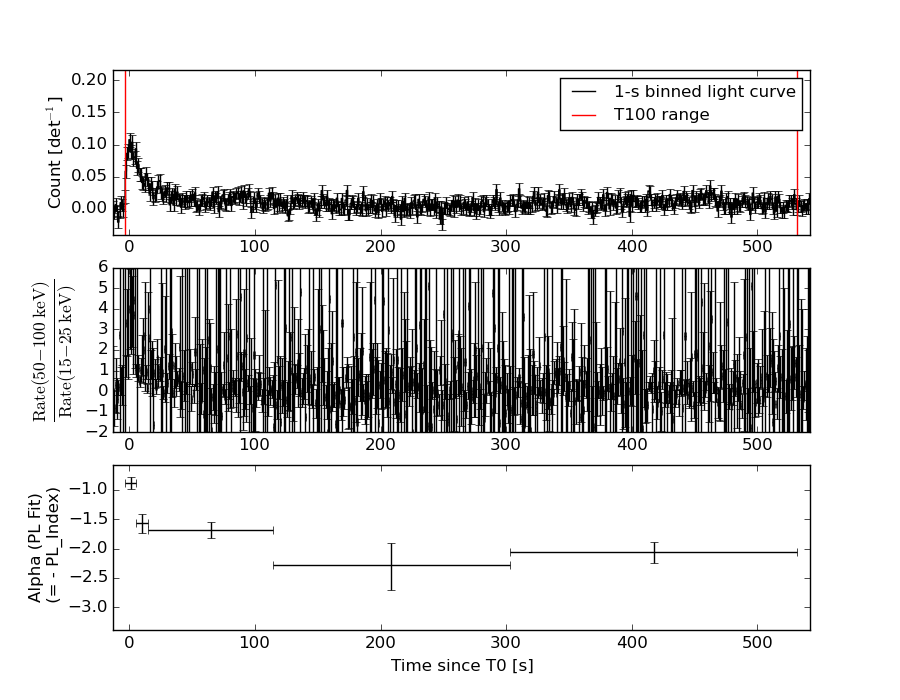
T100 535.072 -3.292 531.780
T90 487.340 0.256 487.596
T50 355.988 22.504 378.492
Peak 1.000 -0.076 0.924
====== Spectral Analysis Summary =====================================
Model : spectral model: simple power-law (PL) and cutoff power-law (CPL)
Ph_index : photon index: E^{Ph_index}
Ph_90err : 90% error of the photon index
Epeak : Epeak in keV
Epeak_90err: 90% error of Epeak
Norm : normalization at 50 keV in both the PL model and CPL model
Nomr_90err : 90% error of the normalization
chi2 : Chi-Squared
dof : degree of freedo
=== Time-averaged spectral analysis ===
(Best model with acceptable fit: PL)
Model Ph_index Ph_90err_low Ph_90err_hi Epeak Epeak_90err_low Epeak_90err_hi Norm Nomr_90err_low Norm_90err_hi chi2 dof
PL -1.815 -0.103 0.101 - - - 7.04e-04 -4.34e-05 4.30e-05 64.110 57
CPL -1.399 -0.404 0.455 64.649 -14.898 373.897 1.19e-03 -4.67e-04 9.02e-04 61.080 56
=== 1-s peak spectral analysis ===
(Best model with acceptable fit: PL)
Model Ph_index Ph_90err_low Ph_90err_hi Epeak Epeak_90err_low Epeak_90err_hi Norm Nomr_90err_low Norm_90err_hi chi2 dof
PL -0.985 -0.224 0.234 - - - 8.13e-03 -1.16e-03 1.15e-03 66.740 57
CPL 0.305 -1.057 1.418 104.048 -27.188 183.130 2.96e-02 -2.96e-02 8.05e-02 62.200 56
=== Fluence/Peak Flux Summary ===
Model Band1 Band2 Band3 Band4 Band5 Total
15-25 25-50 50-100 100-350 15-150 15-350 keV
Fluence PL 6.47e-07 9.82e-07 1.12e-06 2.42e-06 3.47e-06 5.17e-06 erg/cm2
90%_error_low -5.55e-08 -5.35e-08 -9.40e-08 -3.97e-07 -2.16e-07 -4.89e-07 erg/cm2
90%_error_hi 5.68e-08 5.35e-08 9.45e-08 4.49e-07 2.19e-07 5.29e-07 erg/cm2
Peak flux PL 2.05e-01 2.80e-01 2.83e-01 5.19e-01 9.35e-01 1.29e+00 ph/cm2/s
90%_error_low -5.52e-02 -5.01e-02 -4.13e-02 -1.41e-01 -1.35e-01 -1.88e-01 ph/cm2/s
90%_error_hi 6.09e-02 4.95e-02 4.10e-02 1.72e-01 1.36e-01 1.93e-01 ph/cm2/s
Fluence CPL 6.15e-07 1.03e-06 1.11e-06 1.21e-06 3.32e-06 3.96e-06 erg/cm2
90%_error_low -6.44e-08 -6.85e-08 -1.02e-07 -5.63e-07 -2.59e-07 -6.28e-07 erg/cm2
90%_error_hi 6.50e-08 7.00e-08 1.01e-07 1.17e-06 2.62e-07 1.18e-06 erg/cm2
Peak flux CPL 1.43e-01 2.95e-01 3.27e-01 1.99e-01 8.93e-01 9.65e-01 ph/cm2/s
90%_error_low -6.53e-02 -5.89e-02 -5.45e-02 -1.03e-01 -1.40e-01 -1.79e-01 ph/cm2/s
90%_error_hi 7.55e-02 5.87e-02 5.64e-02 2.27e-01 1.41e-01 2.51e-01 ph/cm2/s
======================================================================
Image
Pre-slew 15.0-350.0 keV image (Event data)
#   RAcent    DECcent   POSerr    Theta     Phi              Peak Cts       SNR   Name
    2.4796    47.7542   0.0070    29.1766    -7.2931         1.3623987     27.667 TRIG_00430603

Foreground time interval of the image:
 -3.292  15.693 (delta_t =  18.985 [sec])
Background time interval of the image:
-169.107  -3.292 (delta_t = 165.815 [sec])
Light Curves
Note: The mask-weighted lightcurves have units of either count/det or counts/sec/det, where a det is 0.4 x 0.4 = 0.16 sq cm.
Full-time range; 1 s binning
Other quick-look light curves:
- 64 ms binning (zoomed)
- 16 ms binning (zoomed)
- 8 ms binning (zoomed)
- 2 ms binning (zoomed)
- SN=5 or 10 s binning (full-time range)
- Raw light curve
Spectra
- 64 ms binning (zoomed)
- 16 ms binning (zoomed)
- 8 ms binning (zoomed)
- 2 ms binning (zoomed)
- SN=5 or 10 s binning (full-time range)
- Raw light curve
Spectra
Notes:
- 1) The fitting includes the systematic errors.
- 2) When the burst includes telescope slew time periods, the fitting uses an average response file made from multiple 5-s response files through out the slew time plus single time preiod for the non-slew times, and weighted by the total counts in the corresponding time period using addrmf. An average response file is needed becuase a spectral fit using the pre-slew DRM will introduce some errors in both a spectral shape and a normalization if the PHA file contains a lot of the slew/post-slew time interval.
- 3) For fits to more complicated models (e.g. a power-law over a cutoff power-law), the BAT team has decided to require a chi-square improvement of more than 6 for each extra dof.
Time averaged spectrum fit using the average DRM
Power-law model
Time interval is from   -3.292 sec. to  531.780 sec.

Spectral model in power-law:
------------------------------------------------------------
Parameters  : value       lower 90%   higher 90%
Photon index: -1.81514     ( -0.103218   0.101491 )
Norm@50keV  : 7.04408E-04    ( -4.33699e-05   4.29775e-05 )
------------------------------------------------------------
#Fit statistic : Chi-Squared =          64.11 using 59 PHA bins.
# Reduced chi-squared =          1.125 for     57 degrees of freedom
# Null hypothesis probability =   2.414245e-01

Photon flux (15-150 keV)    in 535.1 sec: 9.76469E-02 ( -0.0054006  0.0054061 ) ph/cm2/s
Energy fluence (15-150 keV)             : 3.46884e-06 ( -2.16287e-07  2.1851e-07 ) ergs/cm2
Cutoff power-law model
Time interval is from   -3.292 sec. to  531.780 sec.
Spectral model in the cutoff power-law:
------------------------------------------------------------
Parameters  : value       lower 90%   higher 90%
Photon index: -1.3992     ( -0.403883   0.454732 )
Epeak [keV] : 64.6491      ( -14.898 373.897 )
Norm@50keV  : 1.18816E-03    ( -0.000467261   0.000902126 )
------------------------------------------------------------
#Fit statistic : Chi-Squared =          61.08 using 59 PHA bins.
# Reduced chi-squared =          1.091 for     56 degrees of freedom
# Null hypothesis probability =   2.985141e-01

Photon flux (15-150 keV)    in 535.1 sec: 9.54615E-02 ( -0.005801  0.0057945 ) ph/cm2/s
Energy fluence (15-150 keV)             : 3.31661e-06 ( -2.59476e-07  2.62083e-07 ) ergs/cm2
1-s peak spectrum fit
Power-law model
Time interval is from   -0.076 sec. to    0.924 sec.

Spectral model in power-law:
------------------------------------------------------------
Parameters  : value       lower 90%   higher 90%
Photon index: -0.985213     ( -0.223695   0.233873 )
Norm@50keV  : 8.12828E-03    ( -0.00115956   0.001152 )
------------------------------------------------------------
#Fit statistic : Chi-Squared =          66.74 using 59 PHA bins.
# Reduced chi-squared =          1.171 for     57 degrees of freedom
# Null hypothesis probability =   1.770288e-01

Photon flux (15-150 keV)    in 1 sec: 0.935130 ( -0.135156  0.1358 ) ph/cm2/s
Energy fluence (15-150 keV)             : 8.8369e-08 ( -1.28824e-08  1.29405e-08 ) ergs/cm2
Cutoff power-law model
Time interval is from   -0.076 sec. to    0.924 sec.
Spectral model in the cutoff power-law:
------------------------------------------------------------
Parameters  : value       lower 90%   higher 90%
Photon index: 0.304722     ( -1.05711   1.41757 )
Epeak [keV] : 104.048      ( -27.1875 183.131 )
Norm@50keV  : 2.96052E-02    ( -0.0296052   0.0805384 )
------------------------------------------------------------
#Fit statistic : Chi-Squared =          62.20 using 59 PHA bins.
# Reduced chi-squared =          1.111 for     56 degrees of freedom
# Null hypothesis probability =   2.651047e-01

Photon flux (15-150 keV)    in 1 sec: 0.892948 ( -0.139968  0.140512 ) ph/cm2/s
Energy fluence (15-150 keV)             : 8.40446e-08 ( -1.38086e-08  1.37376e-08 ) ergs/cm2
Time-resolved spectra
Distribution
T90 vs. Hardness ratio plot
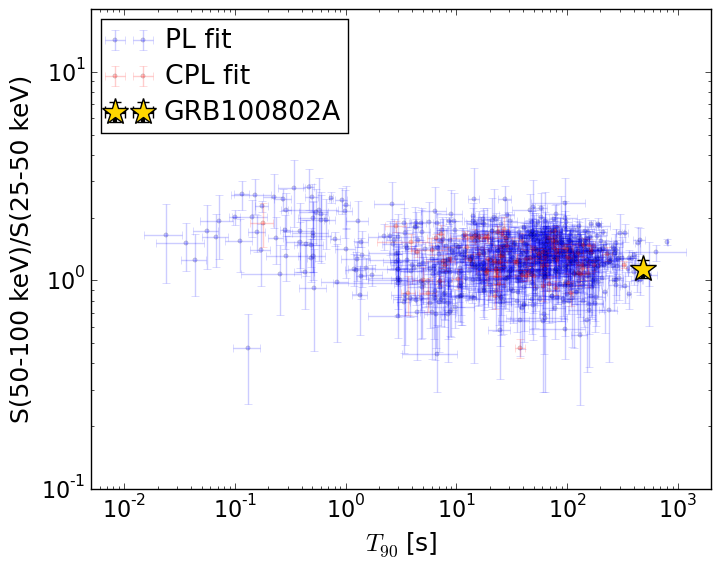
T90                                   = 487.34 sec.
Hardness ratio (energy fluence ratio) = 1.13676295807
S(15-50 keV) vs. S(50-150 keV) plot
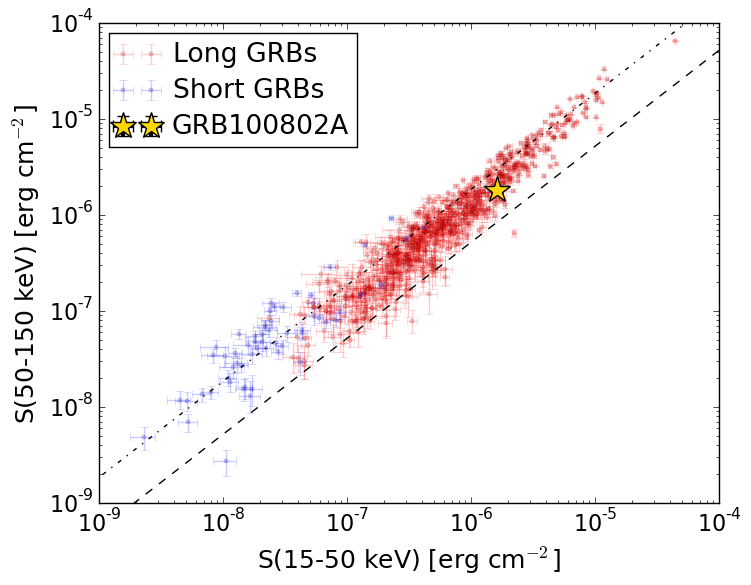
S(15-50 keV)  = 1.6297267e-06
S(50-150 keV) = 1.8391618e-06
The dash-dotted line and the dashed line traces the fluences calculated from the Band function with Epeak = 15 and 150 keV, respectively. Both lines assume a canonical values of alpha = -1 and beta = -2.5.
Mask shadow pattern
IMX = 5.538270890846754E-01, IMY = 7.087916796494229E-02
Spacecraft aspect plot
Bright source in the pre-burst/pre-slew/post-slew images
Pre-burst image of 15-350 keV band
Time interval of the image:
-169.107380 -3.292000

# RAcent  DECcent POSerr Theta    Phi  PeakCts   SNR AngSep     Name
#  [deg]    [deg]    ['] [deg]  [deg]                   [']
254.6646  35.3877    0.0  46.4 -172.8   0.8432   3.4   10.5	Her X-1
299.5937  35.1942    1.5  20.9  135.7   1.1223   7.6    0.5	Cyg X-1
308.1228  40.9147    1.8  12.6  124.4   0.8139   6.4    2.3	Cyg X-3
326.2042  38.3035    4.2  15.2   63.7   0.3468   2.7    1.9	Cyg X-2
320.2826  24.9312    2.7  27.2   85.9   0.7971   4.3 ------	UNKNOWN
310.1552  49.8206    2.3   4.8  157.7   0.6622   5.1 ------	UNKNOWN
 29.5319  33.7078    2.2  53.8   -7.7   2.0997   5.2 ------	UNKNOWN
  1.3153  64.2938    2.6  25.7  -42.9   0.6314   4.5 ------	UNKNOWN
225.5724  56.7755    3.5  49.3 -133.6   2.0748   3.4 ------	UNKNOWN
Pre-slew background subtracted image of 15-350 keV band
Time interval of the image:
-3.292000 15.692610

# RAcent  DECcent POSerr Theta    Phi  PeakCts   SNR AngSep     Name
#  [deg]    [deg]    ['] [deg]  [deg]                   [']
254.4431  35.3179   10.0  46.5 -172.8   0.0915   1.2    1.6	Her X-1
299.7138  35.3715   21.4  20.7  135.7   0.0269   0.5   11.9	Cyg X-1
307.9266  40.8893    8.7  12.7  125.0   0.0565   1.3    9.2	Cyg X-3
326.0015  38.4782    0.0  15.0   64.0  -0.0264  -0.6   12.3	Cyg X-2
  2.4796  47.7542    0.4  29.2   -7.3   1.3625  27.7 ------	UNKNOWN
 14.6587  47.9415    2.5  36.4  -14.5   0.2646   4.6 ------	UNKNOWN
240.3458  37.8724    2.4  53.3 -160.5   0.6074   4.9 ------	UNKNOWN
Post-slew image of 15-350 keV band
Time interval of the image:
68.692580 962.862000

# RAcent  DECcent POSerr Theta    Phi  PeakCts   SNR AngSep     Name
#  [deg]    [deg]    ['] [deg]  [deg]                   [']
299.6183  35.3229    5.8  47.3  141.0   3.5650   2.0    7.4	Cyg X-1
308.0887  40.9851    2.9  38.6  142.8   3.6833   3.9    2.2	Cyg X-3
326.1622  38.1994    4.0  27.9  125.6   1.6862   2.9    7.3	Cyg X-2
 20.2566  -2.9750    3.1  53.1   19.7   7.1540   3.8 ------	UNKNOWN
  2.4526  47.7501    1.0   0.0 -165.9   4.6493  11.3 ------	UNKNOWN
 36.8820  -0.8340    3.3  57.0   -0.2   7.2683   3.5 ------	UNKNOWN
 32.1470  13.3000    3.1  42.4   -3.5   2.4713   3.7 ------	UNKNOWN
249.2513  61.0945    3.0  58.7 -169.2  10.6421   3.8 ------	UNKNOWN
 47.0953  17.2145    2.8  47.5  -23.5   3.4666   4.0 ------	UNKNOWN
234.7349  66.9036    3.8  58.7 -159.2  12.8138   3.0 ------	UNKNOWN
143.3939  83.9614    2.9  47.1 -132.7   6.4749   4.0 ------	UNKNOWN
 63.2494  33.4410    4.5  47.0  -53.3   5.6711   2.6 ------	UNKNOWN