Analysis Summary
Notes:
- 1) No attempt has been made to eliminate the non-significant decimal places.
- 2) This batgrbproduct analysis is done using the HEASARC data.
- 3) This batgrbproduct analysis is using the flight position for the mask-weighting calculation.
======================================================================
                  BAT GRB EVENT DATA PROCESSING REPORT
    Process Script Ver: batgrbproduct v2.46
    Process Start Time: Fri Jan 17 16:37:24 EST 2014
             Host Name: batevent1
   Current Working Dir: /local/data/batevent/batevent_reproc/trigger431764
======================================================================

  Trigger: 00431764      Segment: 000

  BAT Trigger Time: 303611877.44   [s; MET]
      Trigger Stop: 303611878.464   [s; MET]
               UTC: 2010-08-16T00:37:51.355600    [includes UTCF correction]
       Where From?: TDRSS position message

  BAT
    RA: 351.740552447025   Dec: 26.5605486062231  [deg; J2000]

     Catalogged Source?: NO
     Point Source?:      YES
     GRB Indicated?:     YES    [ by BAT flight software ]
     Image S/N Ratio:    22.91
     Image Trigger?:     NO
     Rate S/N Ratio:     132.064378240311  [ if not an image trigger ]
     Image S/N Ratio:    22.91

  Analysis Position:   [ source = BAT ]
    RA: 351.740552447025   Dec: 26.5605486062231  [deg; J2000]

  Refined Position:   [ source = BAT pre-slew burst ]
    RA: 351.737735841043   Dec: 26.5679362735523  [deg; J2000]
        { 23h 26m 57.1s , +26d 34' 04.6" }
         +/- 0.786757469848827 [arcmin] (estimated 90% radius based on SNR)
         +/- 0.220533218505534 [arcmin] (formal 1-sigma fit error)
    SNR: 42.8466754598649

  Angular difference between the analysis and refined position is 0.468324 arcmin

  Partial Coding Fraction: 0.3398438    [ including projection effects ]

  Duration
     T90: 2.88399994373322 +/- 0.625139935430045
        Measured from: -0.307999968528748
                   to: 2.57599997520447     [s; relative to TRIGTIME]
     T50: 1.0239999294281 +/- 0.0688186099521425
        Measured from: 0.15200001001358
                   to: 1.17599993944168     [s; relative to TRIGTIME]


  Fluence
     Peak Flux  (peak 1 second)
        Measured from: 0.10400003194809
                   to: 1.10400003194809     [s; relative to TRIGTIME]
     Total Fluence
        Measured from: -0.708000004291534
                   to: 4.51999998092651     [s; relative to TRIGTIME]

             Band 1     Band 2     Band 3     Band 4
              15-25      25-50     50-100    100-350     keV
 Total     0.526428   0.940396   0.972800   0.253720
           0.024470   0.028305   0.027961   0.019795 [error]
 Peak      0.230341   0.470092   0.503796   0.136627
           0.013165   0.017006   0.017565   0.011377 [error]

     [ fluence units of on-axis counts / fully illuminated detector ]

======================================================================


====== Table of the duration information =============================

        Value   tstart    tstop
T100    5.228   -0.708    4.520
T90     2.884   -0.308    2.576
T50     1.024    0.152    1.176
Peak    1.000    0.104    1.104


====== Spectral Analysis Summary =====================================

Model      : spectral model: simple power-law (PL) and cutoff power-law (CPL)
Ph_index   : photon index: E^{Ph_index}
Ph_90err   : 90% error of the photon index
Epeak      : Epeak in keV
Epeak_90err: 90% error of Epeak
Norm       : normalization at 50 keV in both the PL model and CPL model
Nomr_90err : 90% error of the normalization
chi2       : Chi-Squared
dof        : degree of freedo

=== Time-averaged spectral analysis ===
(Best model with acceptable fit: CPL)

Model Ph_index Ph_90err_low Ph_90err_hi  Epeak  Epeak_90err_low  Epeak_90err_hi  Norm       Nomr_90err_low    Norm_90err_hi    chi2    dof
PL      -1.165    -0.057      0.057       -           -               -         3.70e-02     -1.22e-03          1.22e-03      61.050   57
CPL     -0.736    -0.229      0.241      172.191     -41.401       123.310      5.70e-02     -1.15e-02          1.51e-02      50.400   56


=== 1-s peak spectral analysis ===
(Best model with acceptable fit: N/A)

Model Ph_index Ph_90err_low Ph_90err_hi  Epeak  Epeak_90err_low  Epeak_90err_hi  Norm       Nomr_90err_low    Norm_90err_hi    chi2    dof
PL      -1.063     -0.064     0.064       -           -               -         9.52e-02     -3.71e-03          3.71e-03      67.920   57
CPL     -0.494     -0.261     0.277      153.042     -32.021        77.739      1.71e-01     -3.92e-02          5.42e-02      53.070   56


=== Fluence/Peak Flux Summary ===

              Model    Band1     Band2     Band3     Band4     Band5     Total
                       15-25     25-50    50-100    100-350    15-150    15-350    keV
Fluence         PL   1.80e-07  4.07e-07  7.27e-07  3.05e-06  1.98e-06  4.37e-06   erg/cm2
      90%_error_low -1.17e-08 -1.61e-08 -2.69e-08 -2.47e-07 -6.91e-08 -2.63e-07   erg/cm2
      90%_error_hi   1.20e-08  1.60e-08  2.68e-08  2.61e-07  6.93e-08  2.74e-07   erg/cm2
Peak flux       PL   7.08e-04  8.48e-03  1.23e-01  1.10e+01  5.74e-01  1.07e+01   ph/cm2/s
      90%_error_low     N/A       N/A       N/A       N/A       N/A       N/A     ph/cm2/s
      90%_error_hi      N/A       N/A       N/A       N/A       N/A       N/A     ph/cm2/s

Fluence        CPL   1.61e-07  4.18e-07  7.63e-07  1.84e-06  1.95e-06  3.18e-06   erg/cm2
      90%_error_low -1.49e-08 -1.75e-08 -3.31e-08 -4.07e-07 -7.21e-08 -4.05e-07   erg/cm2
      90%_error_hi   1.52e-08  1.76e-08  3.34e-08  5.51e-07  7.19e-08  5.44e-07   erg/cm2
Peak flux      CPL   2.23e+00  3.49e+00  3.48e+00  3.31e+00  1.08e+01  1.25e+01   ph/cm2/s
      90%_error_low -2.38e-01 -1.75e-01 -1.77e-01 -6.47e-01 -4.46e-01 -7.83e-01   ph/cm2/s
      90%_error_hi   2.45e-01  1.77e-01  1.79e-01  8.35e-01  4.46e-01  9.15e-01   ph/cm2/s

======================================================================
Image
Pre-slew 15.0-350.0 keV image (Event data)

#   RAcent    DECcent   POSerr    Theta     Phi              Peak Cts       SNR   Name
  351.7377    26.5679   0.0045    32.6320    59.3781         2.7841195     42.847 TRIG_00431764

Foreground time interval of the image:
 -0.708   4.520 (delta_t =   5.228 [sec])
Background time interval of the image:
-239.440  -0.708 (delta_t = 238.732 [sec])
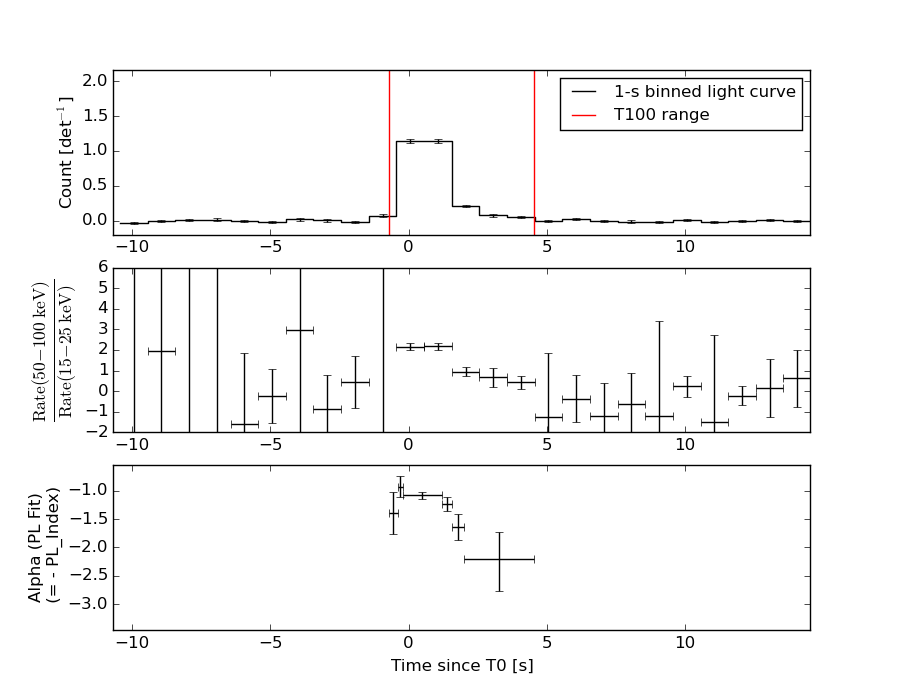
Light Curves
Note: The mask-weighted lightcurves have units of either count/det or counts/sec/det, where a det is 0.4 x 0.4 = 0.16 sq cm.
Full-time range; 1 s binning
Other quick-look light curves:
- 64 ms binning (zoomed)
- 16 ms binning (zoomed)
- 8 ms binning (zoomed)
- 2 ms binning (zoomed)
- SN=5 or 10 s binning (full-time range)
- Raw light curve
Spectra
- 64 ms binning (zoomed)
- 16 ms binning (zoomed)
- 8 ms binning (zoomed)
- 2 ms binning (zoomed)
- SN=5 or 10 s binning (full-time range)
- Raw light curve
Spectra
Notes:
- 1) The fitting includes the systematic errors.
- 2) When the burst includes telescope slew time periods, the fitting uses an average response file made from multiple 5-s response files through out the slew time plus single time preiod for the non-slew times, and weighted by the total counts in the corresponding time period using addrmf. An average response file is needed becuase a spectral fit using the pre-slew DRM will introduce some errors in both a spectral shape and a normalization if the PHA file contains a lot of the slew/post-slew time interval.
- 3) For fits to more complicated models (e.g. a power-law over a cutoff power-law), the BAT team has decided to require a chi-square improvement of more than 6 for each extra dof.
Time averaged spectrum fit using the average DRM
Power-law model
Time interval is from   -0.708 sec. to    4.520 sec.

Spectral model in power-law:
------------------------------------------------------------
Parameters  : value       lower 90%   higher 90%
Photon index: -1.16502     ( -0.0566231   0.0568583 )
Norm@50keV  : 3.69589E-02    ( -0.00121655   0.00121589 )
------------------------------------------------------------
#Fit statistic : Chi-Squared =          61.05 using 59 PHA bins.
# Reduced chi-squared =          1.071 for     57 degrees of freedom
# Null hypothesis probability =   3.324200e-01

Photon flux (15-150 keV)    in 5.228 sec: 4.31808 ( -0.14908  0.14929 ) ph/cm2/s
Energy fluence (15-150 keV)             : 1.98041e-06 ( -6.91278e-08  6.92642e-08 ) ergs/cm2
Cutoff power-law model
Time interval is from   -0.708 sec. to    4.520 sec.
Spectral model in the cutoff power-law:
------------------------------------------------------------
Parameters  : value       lower 90%   higher 90%
Photon index: -0.736291     ( -0.229043   0.241283 )
Epeak [keV] : 172.191      ( -41.4013 123.31 )
Norm@50keV  : 5.69841E-02    ( -0.0114748   0.01513 )
------------------------------------------------------------
#Fit statistic : Chi-Squared =          50.40 using 59 PHA bins.
# Reduced chi-squared =         0.8999 for     56 degrees of freedom
# Null hypothesis probability =   6.860696e-01

Photon flux (15-150 keV)    in 5.228 sec: 4.23469 ( -0.15472  0.15498 ) ph/cm2/s
Energy fluence (15-150 keV)             : 1.95e-06 ( -7.20889e-08  7.19253e-08 ) ergs/cm2
1-s peak spectrum fit
Power-law model
Time interval is from    0.104 sec. to    1.104 sec.

Spectral model in power-law:
------------------------------------------------------------
Parameters  : value       lower 90%   higher 90%
Photon index: -1.06319     ( -0.0637516   0.0640873 )
Norm@50keV  : 9.51735E-02    ( -0.00371251   0.00371072 )
------------------------------------------------------------
#Fit statistic : Chi-Squared =          67.92 using 59 PHA bins.
# Reduced chi-squared =          1.192 for     57 degrees of freedom
# Null hypothesis probability =   1.524917e-01

Photon flux (15-150 keV)    in 1 sec: 0.574127 (    ) ph/cm2/s
Energy fluence (15-150 keV)             : 1.00716e-06 ( -4.24428e-08  4.25274e-08 ) ergs/cm2
Cutoff power-law model
Time interval is from    0.104 sec. to    1.104 sec.
Spectral model in the cutoff power-law:
------------------------------------------------------------
Parameters  : value       lower 90%   higher 90%
Photon index: -0.494233     ( -0.260856   0.277031 )
Epeak [keV] : 153.042      ( -32.0216 77.7389 )
Norm@50keV  : 0.171046    ( -0.039247   0.0541617 )
------------------------------------------------------------
#Fit statistic : Chi-Squared =          53.07 using 59 PHA bins.
# Reduced chi-squared =         0.9477 for     56 degrees of freedom
# Null hypothesis probability =   5.864264e-01

Photon flux (15-150 keV)    in 1 sec: 10.8263 ( -0.4458  0.4461 ) ph/cm2/s
Energy fluence (15-150 keV)             : 1.61102e-07 ( -3.43718e-08  2.76537e-08 ) ergs/cm2
Time-resolved spectra
Distribution
T90 vs. Hardness ratio plot
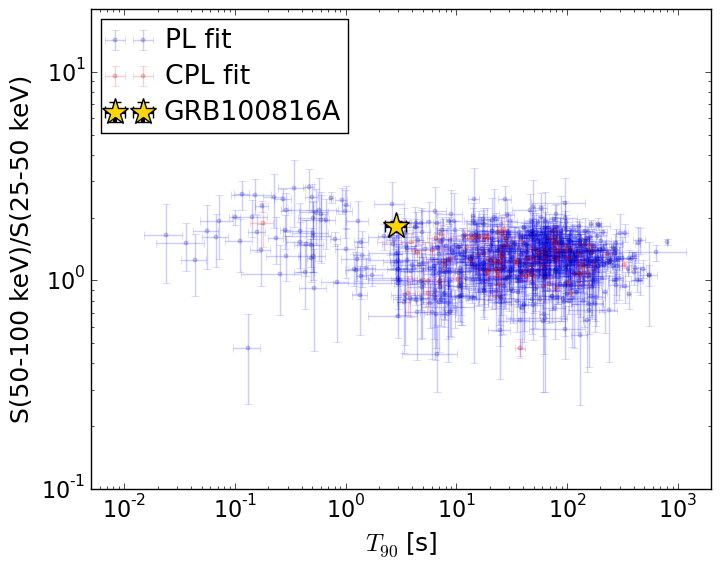
T90                                   = 2.884 sec.
Hardness ratio (energy fluence ratio) = 1.82608105683
S(15-50 keV) vs. S(50-150 keV) plot
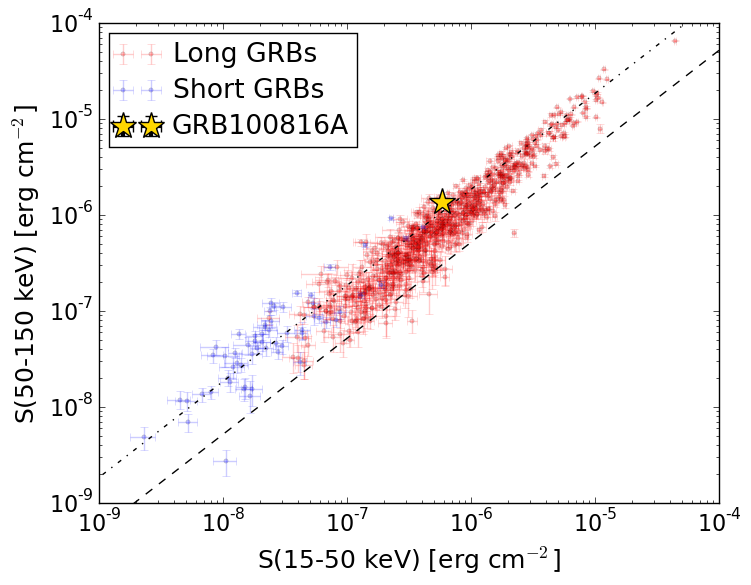
S(15-50 keV)  = 5.792669e-07
S(50-150 keV) = 1.370732e-06
The dash-dotted line and the dashed line traces the fluences calculated from the Band function with Epeak = 15 and 150 keV, respectively. Both lines assume a canonical values of alpha = -1 and beta = -2.5.
Mask shadow pattern
IMX = 3.261569951733025E-01, IMY = -5.510208954698624E-01
Spacecraft aspect plot
Bright source in the pre-burst/pre-slew/post-slew images
Pre-burst image of 15-350 keV band
Time interval of the image:
-239.440000 -0.708000

# RAcent  DECcent POSerr Theta    Phi  PeakCts   SNR AngSep     Name
#  [deg]    [deg]    ['] [deg]  [deg]                   [']
299.5583  35.2204    1.3  38.0  142.1   3.1574   9.0    1.9	Cyg X-1
308.0023  41.0050    1.9  29.3  139.1   1.4112   6.0    5.8	Cyg X-3
326.3268  38.4021    3.9  23.8  109.2   0.6413   3.0    8.7	Cyg X-2
 50.9140  22.1781    2.2  58.6  -11.0   4.4584   5.2 ------	UNKNOWN
227.5361  63.9743    3.2  48.4 -141.2   1.8345   3.6 ------	UNKNOWN
Pre-slew background subtracted image of 15-350 keV band
Time interval of the image:
-0.708000 4.520000

# RAcent  DECcent POSerr Theta    Phi  PeakCts   SNR AngSep     Name
#  [deg]    [deg]    ['] [deg]  [deg]                   [']
299.7080  35.3371    5.0  37.8  142.0  -0.1523  -2.3   10.0	Cyg X-1
308.2442  40.9077    6.0  29.3  138.7   0.0930   2.0    6.6	Cyg X-3
325.9888  38.2441   15.7  24.1  109.6   0.0348   0.7    9.8	Cyg X-2
351.7377  26.5679    0.3  32.6   59.4   2.7841  42.8 ------	UNKNOWN
242.4780  45.3912    2.4  58.1 -163.7   0.5976   4.9 ------	UNKNOWN
239.8627  54.4594    3.2  51.9 -155.3   0.2461   3.6 ------	UNKNOWN
Post-slew image of 15-350 keV band
Time interval of the image:
71.660600 612.560600

# RAcent  DECcent POSerr Theta    Phi  PeakCts   SNR AngSep     Name
#  [deg]    [deg]    ['] [deg]  [deg]                   [']
299.6081  35.1669    2.2  45.1  168.9   3.7204   5.3    2.3	Cyg X-1
308.1191  40.9448    2.0  38.6  177.9   2.6861   5.7    0.6	Cyg X-3
326.2912  38.2432    2.9  24.3  179.6   1.1605   3.9    7.3	Cyg X-2
353.6561 -12.5856    2.6  39.2   51.7   3.1458   4.5 ------	UNKNOWN
320.3903  45.6802    2.4  31.4 -169.6   1.5469   4.9 ------	UNKNOWN
292.7825  56.6052    3.5  51.2 -162.6   2.4777   3.3 ------	UNKNOWN
314.6715  70.1629    2.6  48.5 -141.2   3.7674   4.4 ------	UNKNOWN