Analysis Summary
Notes:
- 1) No attempt has been made to eliminate the non-significant decimal places.
- 2) This batgrbproduct analysis is done using the HEASARC data.
- 3) This batgrbproduct analysis is using the flight position for the mask-weighting calculation.
======================================================================
BAT GRB EVENT DATA PROCESSING REPORT
Process Script Ver: batgrbproduct v2.46
Process Start Time: Fri Jan 17 16:32:58 EST 2014
Host Name: batevent1
Current Working Dir: /local/data/batevent/batevent_reproc/trigger432420
======================================================================
Trigger: 00432420 Segment: 000
BAT Trigger Time: 304277141.824 [s; MET]
Trigger Stop: 304277142.848 [s; MET]
UTC: 2010-08-23T17:25:35.715620 [includes UTCF correction]
Where From?: TDRSS position message
BAT
RA: 20.7032249785858 Dec: 5.8420131400694 [deg; J2000]
Catalogged Source?: NO
Point Source?: YES
GRB Indicated?: YES [ by BAT flight software ]
Image S/N Ratio: 10.5
Image Trigger?: NO
Rate S/N Ratio: 15.8429795177549 [ if not an image trigger ]
Image S/N Ratio: 10.5
Analysis Position: [ source = BAT ]
RA: 20.7032249785858 Dec: 5.8420131400694 [deg; J2000]
Refined Position: [ source = BAT pre-slew burst ]
RA: 20.7047693351404 Dec: 5.84732433240791 [deg; J2000]
{ 01h 22m 49.1s , +05d 50' 50.4" }
+/- 1.41283374432378 [arcmin] (estimated 90% radius based on SNR)
+/- 0.465102322787318 [arcmin] (formal 1-sigma fit error)
SNR: 18.5653260677926
Angular difference between the analysis and refined position is 0.331736 arcmin
Partial Coding Fraction: 0.9296875 [ including projection effects ]
Duration
T90: 17.7359999418259 +/- 3.10168209249592
Measured from: -0.452000021934509
to: 17.2839999198914 [s; relative to TRIGTIME]
T50: 7.95199990272522 +/- 1.62941585249702
Measured from: 1.18800002336502
to: 9.13999992609024 [s; relative to TRIGTIME]
Fluence
Peak Flux (peak 1 second)
Measured from: 0.139999985694885
to: 1.13999998569489 [s; relative to TRIGTIME]
Total Fluence
Measured from: -1.17199999094009
to: 19.4120000004768 [s; relative to TRIGTIME]
Band 1 Band 2 Band 3 Band 4
15-25 25-50 50-100 100-350 keV
Total 0.347463 0.300562 0.138145 0.043036
0.023390 0.023966 0.020872 0.018419 [error]
Peak 0.047644 0.041763 0.017171 0.009010
0.005530 0.005631 0.004836 0.003947 [error]
[ fluence units of on-axis counts / fully illuminated detector ]
======================================================================
====== Table of the duration information =============================
Value tstart tstop
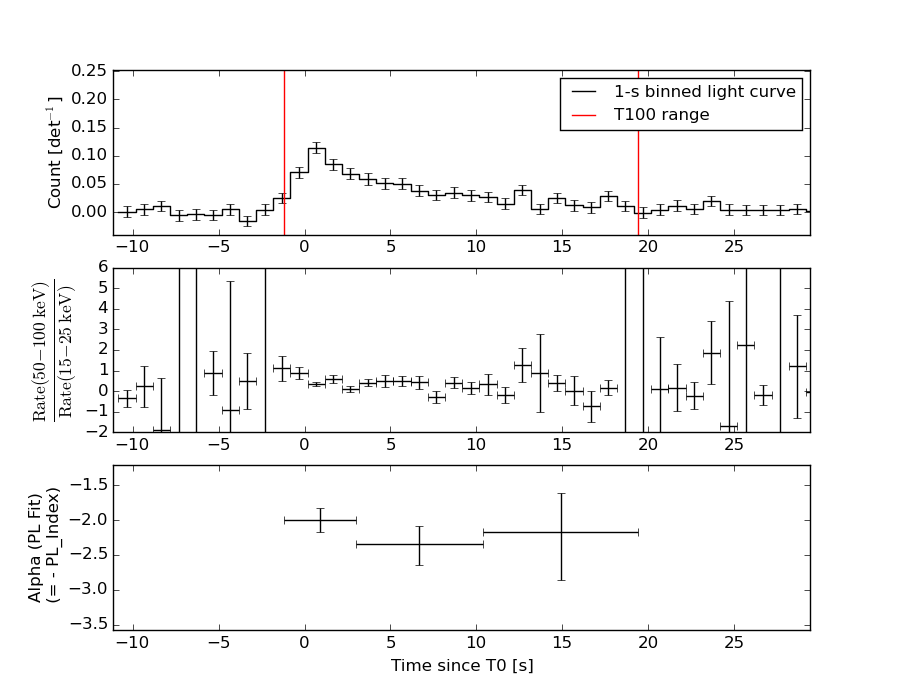
T100 20.584 -1.172 19.412
T90 17.736 -0.452 17.284
T50 7.952 1.188 9.140
Peak 1.000 0.140 1.140
====== Spectral Analysis Summary =====================================
Model : spectral model: simple power-law (PL) and cutoff power-law (CPL)
Ph_index : photon index: E^{Ph_index}
Ph_90err : 90% error of the photon index
Epeak : Epeak in keV
Epeak_90err: 90% error of Epeak
Norm : normalization at 50 keV in both the PL model and CPL model
Nomr_90err : 90% error of the normalization
chi2 : Chi-Squared
dof : degree of freedo
=== Time-averaged spectral analysis ===
(Best model with acceptable fit: PL)
Model Ph_index Ph_90err_low Ph_90err_hi Epeak Epeak_90err_low Epeak_90err_hi Norm Nomr_90err_low Norm_90err_hi chi2 dof
PL -2.168 -0.181 0.172 - - - 2.14e-03 -2.61e-04 2.56e-04 54.350 57
CPL -1.823 -0.218 0.830 19.831 -19.222 -19.831 3.45e-03 -1.16e-03 7.62e-03 53.640 56
=== 1-s peak spectral analysis ===
(Best model with acceptable fit: PL)
Model Ph_index Ph_90err_low Ph_90err_hi Epeak Epeak_90err_low Epeak_90err_hi Norm Nomr_90err_low Norm_90err_hi chi2 dof
PL -2.138 -0.308 0.277 - - - 6.01e-03 -1.26e-03 1.21e-03 59.750 57
CPL -2.204 -0.273 1.116 123.342 N/A N/A 5.48e-03 N/A N/A 59.730 56
=== Fluence/Peak Flux Summary ===
Model Band1 Band2 Band3 Band4 Band5 Total
15-25 25-50 50-100 100-350 15-150 15-350 keV
Fluence PL 1.06e-07 1.29e-07 1.15e-07 1.77e-07 4.11e-07 5.27e-07 erg/cm2
90%_error_low -1.24e-08 -1.15e-08 -1.91e-08 -5.13e-08 -4.32e-08 -7.57e-08 erg/cm2
90%_error_hi 1.26e-08 1.15e-08 1.97e-08 6.42e-08 4.43e-08 8.55e-08 erg/cm2
Peak flux PL 4.58e-01 3.17e-01 1.44e-01 9.11e-02 9.63e-01 1.01e+00 ph/cm2/s
90%_error_low -8.72e-02 -4.64e-02 -3.87e-02 -3.93e-02 -1.36e-01 -1.45e-01 ph/cm2/s
90%_error_hi 8.93e-02 4.60e-02 4.02e-02 5.43e-02 1.36e-01 1.46e-01 ph/cm2/s
Fluence CPL 1.03e-07 1.35e-07 1.11e-07 8.76e-08 3.94e-07 4.36e-07 erg/cm2
90%_error_low -1.35e-08 -1.35e-08 -2.43e-08 -6.45e-08 -5.30e-08 -8.81e-08 erg/cm2
90%_error_hi 1.30e-08 1.59e-08 2.19e-08 1.60e-07 5.36e-08 1.50e-07 erg/cm2
Peak flux CPL 4.60e-01 3.14e-01 1.44e-01 1.03e-01 9.65e-01 1.02e+00 ph/cm2/s
90%_error_low -9.16e-02 -7.35e-02 N/A -5.03e-02 -2.20e-01 -3.33e-01 ph/cm2/s
90%_error_hi 4.52e-02 4.85e-02 N/A 4.98e-02 1.36e-01 1.48e-01 ph/cm2/s
======================================================================
Image
Pre-slew 15.0-350.0 keV image (Event data)
#   RAcent    DECcent   POSerr    Theta     Phi              Peak Cts       SNR   Name
   20.7048     5.8473   0.0104    23.9756  -174.5894         0.6624661     18.565 TRIG_00432420

Foreground time interval of the image:
 -1.172  10.877 (delta_t =  12.049 [sec])
Background time interval of the image:
-371.523 -324.793 (delta_t =  46.731 [sec])
-239.824  -1.172 (delta_t = 238.652 [sec])
Light Curves
Note: The mask-weighted lightcurves have units of either count/det or counts/sec/det, where a det is 0.4 x 0.4 = 0.16 sq cm.
Full-time range; 1 s binning
Other quick-look light curves:
- 64 ms binning (zoomed)
- 16 ms binning (zoomed)
- 8 ms binning (zoomed)
- 2 ms binning (zoomed)
- SN=5 or 10 s binning (full-time range)
- Raw light curve
Spectra
- 64 ms binning (zoomed)
- 16 ms binning (zoomed)
- 8 ms binning (zoomed)
- 2 ms binning (zoomed)
- SN=5 or 10 s binning (full-time range)
- Raw light curve
Spectra
Notes:
- 1) The fitting includes the systematic errors.
- 2) When the burst includes telescope slew time periods, the fitting uses an average response file made from multiple 5-s response files through out the slew time plus single time preiod for the non-slew times, and weighted by the total counts in the corresponding time period using addrmf. An average response file is needed becuase a spectral fit using the pre-slew DRM will introduce some errors in both a spectral shape and a normalization if the PHA file contains a lot of the slew/post-slew time interval.
- 3) For fits to more complicated models (e.g. a power-law over a cutoff power-law), the BAT team has decided to require a chi-square improvement of more than 6 for each extra dof.
Time averaged spectrum fit using the average DRM
Power-law model
Time interval is from   -1.172 sec. to   19.412 sec.

Spectral model in power-law:
------------------------------------------------------------
Parameters  : value       lower 90%   higher 90%
Photon index: -2.16843     ( -0.181097   0.171717 )
Norm@50keV  : 2.13507E-03    ( -0.000260766   0.000255937 )
------------------------------------------------------------
#Fit statistic : Chi-Squared =          54.35 using 59 PHA bins.
# Reduced chi-squared =         0.9535 for     57 degrees of freedom
# Null hypothesis probability =   5.751408e-01

Photon flux (15-150 keV)    in 20.58 sec: 0.347737 ( -0.029891  0.029895 ) ph/cm2/s
Energy fluence (15-150 keV)             : 4.11468e-07 ( -4.3233e-08  4.42698e-08 ) ergs/cm2
Cutoff power-law model
Time interval is from   -1.172 sec. to   19.412 sec.
Spectral model in the cutoff power-law:
------------------------------------------------------------
Parameters  : value       lower 90%   higher 90%
Photon index: -1.82321     ( -0.218279   0.829354 )
Epeak [keV] : 19.8315      ( -19.2767 -19.8861 )
Norm@50keV  : 3.45387E-03    ( -0.00116413   0.00761867 )
------------------------------------------------------------
#Fit statistic : Chi-Squared =          53.64 using 59 PHA bins.
# Reduced chi-squared =         0.9578 for     56 degrees of freedom
# Null hypothesis probability =   5.648802e-01

Photon flux (15-150 keV)    in 20.58 sec: 0.342723 ( -0.031438  0.030939 ) ph/cm2/s
Energy fluence (15-150 keV)             : 3.93909e-07 ( -5.29715e-08  5.3593e-08 ) ergs/cm2
1-s peak spectrum fit
Power-law model
Time interval is from    0.140 sec. to    1.140 sec.

Spectral model in power-law:
------------------------------------------------------------
Parameters  : value       lower 90%   higher 90%
Photon index: -2.13831     ( -0.307512   0.277482 )
Norm@50keV  : 6.00716E-03    ( -0.00125836   0.00121217 )
------------------------------------------------------------
#Fit statistic : Chi-Squared =          59.75 using 59 PHA bins.
# Reduced chi-squared =          1.048 for     57 degrees of freedom
# Null hypothesis probability =   3.762125e-01

Photon flux (15-150 keV)    in 1 sec: 0.963437 ( -0.135876  0.135883 ) ph/cm2/s
Energy fluence (15-150 keV)             : 5.60493e-08 ( -1.00597e-08  1.04275e-08 ) ergs/cm2
Cutoff power-law model
Time interval is from    0.140 sec. to    1.140 sec.
Spectral model in the cutoff power-law:
------------------------------------------------------------
Parameters  : value       lower 90%   higher 90%
Photon index: -2.20403     ( -0.271449   1.1169 )
Epeak [keV] : 123.342      (   )
Norm@50keV  : 5.48242E-03    (     )
------------------------------------------------------------
#Fit statistic : Chi-Squared =          59.73 using 59 PHA bins.
# Reduced chi-squared =          1.067 for     56 degrees of freedom
# Null hypothesis probability =   3.418431e-01

Photon flux (15-150 keV)    in 1 sec: 0.965042 ( -0.220383  0.136218 ) ph/cm2/s
Energy fluence (15-150 keV)             : 0 ( 0  0 ) ergs/cm2
Time-resolved spectra
Distribution
T90 vs. Hardness ratio plot
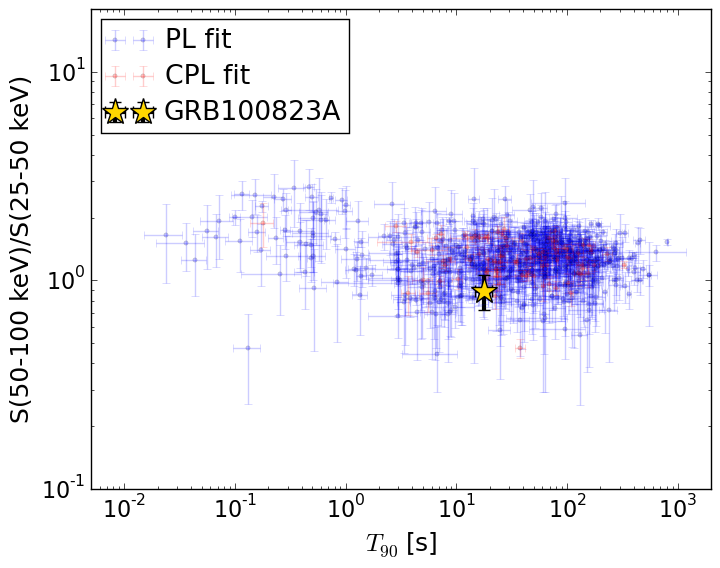
T90                                   = 17.736 sec.
Hardness ratio (energy fluence ratio) = 0.889856212565
S(15-50 keV) vs. S(50-150 keV) plot
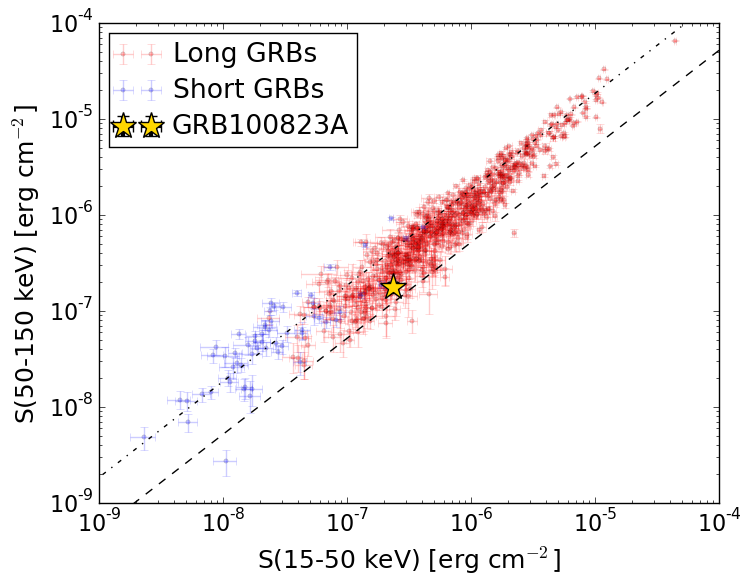
S(15-50 keV)  = 2.349337e-07
S(50-150 keV) = 1.7653561e-07
The dash-dotted line and the dashed line traces the fluences calculated from the Band function with Epeak = 15 and 150 keV, respectively. Both lines assume a canonical values of alpha = -1 and beta = -2.5.
Mask shadow pattern
IMX = -4.427365595017845E-01, IMY = 4.193319806749431E-02
Spacecraft aspect plot
Bright source in the pre-burst/pre-slew/post-slew images
Pre-burst image of 15-350 keV band
Time interval of the image:
-371.523400 -324.792700
-239.824000 -1.172000

# RAcent  DECcent POSerr Theta    Phi  PeakCts   SNR AngSep     Name
#  [deg]    [deg]    ['] [deg]  [deg]                   [']
358.3073  -7.8609    3.0  25.8  120.3   0.9429   3.8  482.4	UNKNOWN
  5.9271  33.9219    3.0  54.4  173.0   3.2434   3.9 ------	UNKNOWN
 36.5532 -72.8597    2.6  55.4    5.2   3.9489   4.4 ------	UNKNOWN
 40.3658 -58.4445    2.9  42.4   -3.6   1.1347   4.0 ------	UNKNOWN
 36.0347 -51.2220    3.0  34.8   -4.6   0.8715   3.8 ------	UNKNOWN
 55.5336 -56.5210    2.4  45.7  -14.7   1.5182   4.9 ------	UNKNOWN
Pre-slew background subtracted image of 15-350 keV band
Time interval of the image:
-1.172000 10.876600

# RAcent  DECcent POSerr Theta    Phi  PeakCts   SNR AngSep     Name
#  [deg]    [deg]    ['] [deg]  [deg]                   [']
 20.7048   5.8473    0.6  24.0 -174.6   0.6624  18.6 ------	UNKNOWN
 69.4656 -40.4824    2.2  45.9  -40.5   0.3933   5.2 ------	UNKNOWN
 47.3802  28.6389    2.8  52.5 -142.3   0.6665   4.1 ------	UNKNOWN
Post-slew image of 15-350 keV band
Time interval of the image:
58.076600 894.676600

# RAcent  DECcent POSerr Theta    Phi  PeakCts   SNR AngSep     Name
#  [deg]    [deg]    ['] [deg]  [deg]                   [']
346.6945  -5.2013    3.0  35.7   92.6   3.6385   3.9 ------	UNKNOWN
 33.4360 -19.3554    3.0  28.1   -6.2   1.5051   3.8 ------	UNKNOWN
 56.5132 -34.9183    2.7  52.9  -17.0   3.9201   4.2 ------	UNKNOWN