Analysis Summary
Notes:
- 1) No attempt has been made to eliminate the non-significant decimal places.
- 2) This batgrbproduct analysis is done using the HEASARC data.
- 3) This batgrbproduct analysis is using the flight position for the mask-weighting calculation.
======================================================================
BAT GRB EVENT DATA PROCESSING REPORT
Process Script Ver: batgrbproduct v2.46
Process Start Time: Fri Jan 17 16:28:41 EST 2014
Host Name: batevent1
Current Working Dir: /local/data/batevent/batevent_reproc/trigger433065
======================================================================
Trigger: 00433065 Segment: 000
BAT Trigger Time: 305040856.512 [s; MET]
Trigger Stop: 305040864.704 [s; MET]
UTC: 2010-09-01T13:34:10.376100 [includes UTCF correction]
Where From?: TDRSS position message
BAT
RA: 27.2446729253292 Dec: 22.7443520105249 [deg; J2000]
Catalogged Source?: NO
Point Source?: YES
GRB Indicated?: YES [ by BAT flight software ]
Image S/N Ratio: 7.7
Image Trigger?: NO
Rate S/N Ratio: 10.1980390271856 [ if not an image trigger ]
Image S/N Ratio: 7.7
Analysis Position: [ source = BAT ]
RA: 27.2446729253292 Dec: 22.7443520105249 [deg; J2000]
Refined Position: [ source = BAT pre-slew burst ]
RA: 27.2447 Dec: 22.7443 [deg; J2000]
{ 01h 48m 58.7s , +22d 44' 39.5" }
+/- 2.36429637896 [arcmin] (estimated 90% radius based on SNR)
SNR: 8.89846949821
Angular difference between the analysis and refined position is 0.003462 arcmin
Partial Coding Fraction: 0.4023438 [ including projection effects ]
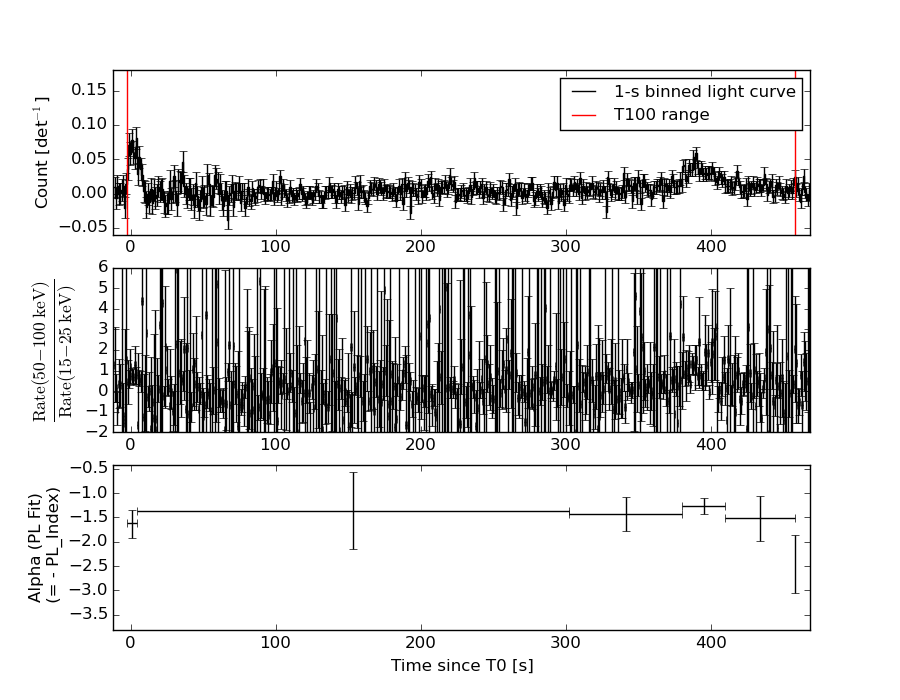
Duration
T90: 436.655999958515 +/- 21.7875108881231
Measured from: 0.287999987602234
to: 436.943999946117 [s; relative to TRIGTIME]
T50: 198.155999958515 +/- 192.654618203612
Measured from: 199.543999969959
to: 397.699999928474 [s; relative to TRIGTIME]
Fluence
Peak Flux (peak 1 second)
Measured from: -1.80800002813339
to: -0.808000028133392 [s; relative to TRIGTIME]
Total Fluence
Measured from: -2.4200000166893
to: 458.423999965191 [s; relative to TRIGTIME]
Band 1 Band 2 Band 3 Band 4
15-25 25-50 50-100 100-350 keV
Total 0.813924 1.161621 0.893494 0.239063
0.118239 0.123275 0.111186 0.102030 [error]
Peak 0.029326 0.034461 0.016573 0.014175
0.008345 0.008604 0.007799 0.007138 [error]
[ fluence units of on-axis counts / fully illuminated detector ]
======================================================================
====== Table of the duration information =============================
Value tstart tstop
T100 460.844 -2.420 458.424
T90 436.656 0.288 436.944
T50 198.156 199.544 397.700
Peak 1.000 -1.808 -0.808
====== Spectral Analysis Summary =====================================
Model : spectral model: simple power-law (PL) and cutoff power-law (CPL)
Ph_index : photon index: E^{Ph_index}
Ph_90err : 90% error of the photon index
Epeak : Epeak in keV
Epeak_90err: 90% error of Epeak
Norm : normalization at 50 keV in both the PL model and CPL model
Nomr_90err : 90% error of the normalization
chi2 : Chi-Squared
dof : degree of freedo
=== Time-averaged spectral analysis ===
(Best model with acceptable fit: PL)
Model Ph_index Ph_90err_low Ph_90err_hi Epeak Epeak_90err_low Epeak_90err_hi Norm Nomr_90err_low Norm_90err_hi chi2 dof
PL -1.402 -0.204 0.204 - - - 4.39e-04 -5.18e-05 5.14e-05 50.260 57
CPL -1.372 -0.724 0.609 996.920 -996.920 -996.920 4.56e-04 -6.70e-05 3.54e-05 50.320 56
=== 1-s peak spectral analysis ===
(Best model with acceptable fit: PL)
Model Ph_index Ph_90err_low Ph_90err_hi Epeak Epeak_90err_low Epeak_90err_hi Norm Nomr_90err_low Norm_90err_hi chi2 dof
PL -1.840 -0.650 0.577 - - - 5.65e-03 -2.05e-03 1.82e-03 56.440 57
CPL -1.839 -1.568 0.467 9999.340 N/A N/A 5.65e-03 N/A N/A 56.440 56
=== Fluence/Peak Flux Summary ===
Model Band1 Band2 Band3 Band4 Band5 Total
15-25 25-50 50-100 100-350 15-150 15-350 keV
Fluence PL 2.36e-07 4.60e-07 6.96e-07 2.29e-06 1.95e-06 3.68e-06 erg/cm2
90%_error_low -4.57e-08 -5.56e-08 -1.07e-07 -6.75e-07 -2.59e-07 -7.70e-07 erg/cm2
90%_error_hi 4.76e-08 5.50e-08 1.07e-07 8.54e-07 2.62e-07 9.21e-07 erg/cm2
Peak flux PL 3.22e-01 2.66e-01 1.48e-01 1.22e-01 7.90e-01 8.58e-01 ph/cm2/s
90%_error_low -1.42e-01 -7.43e-02 -6.88e-02 -8.40e-02 -2.21e-01 -2.40e-01 ph/cm2/s
90%_error_hi 1.53e-01 7.37e-02 6.70e-02 1.53e-01 2.21e-01 2.41e-01 ph/cm2/s
Fluence CPL 2.37e-07 4.57e-07 6.96e-07 2.27e-06 1.95e-06 3.70e-06 erg/cm2
90%_error_low N/A N/A N/A N/A N/A -1.53e-06 erg/cm2
90%_error_hi N/A N/A N/A N/A N/A 4.12e-07 erg/cm2
Peak flux CPL 2.93e-01 2.02e-01 1.09e-01 9.15e-02 8.04e-01 8.65e-01 ph/cm2/s
90%_error_low N/A -1.16e-01 -6.19e-02 -4.61e-02 -2.31e-01 -2.49e-01 ph/cm2/s
90%_error_hi N/A 1.25e-01 3.72e-02 4.65e-02 2.10e-01 2.31e-01 ph/cm2/s
======================================================================
Image
Pre-slew 25.0-100.0 keV image (Event data)
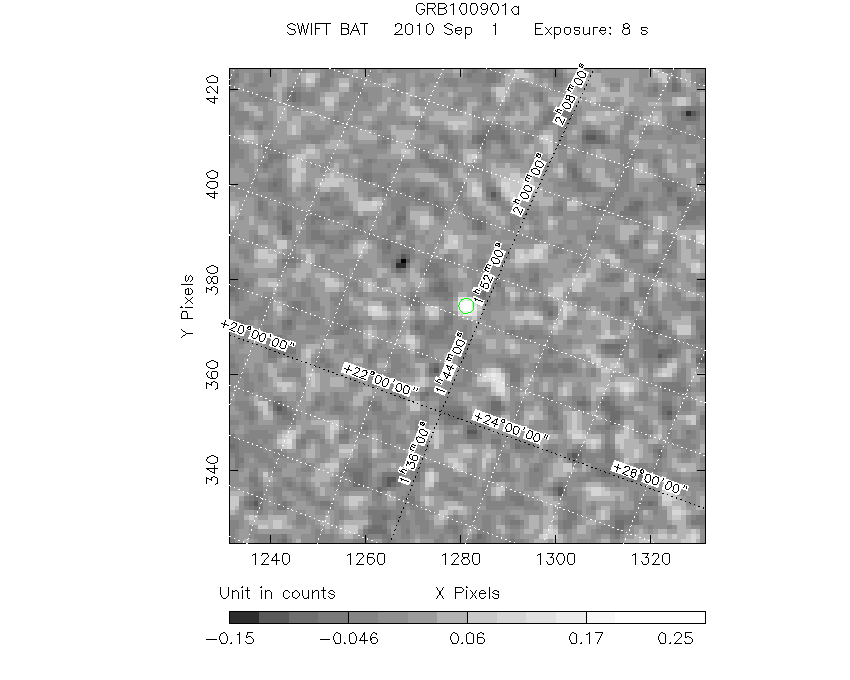
#RAcent DECcent POSerr Theta  Phi  Peak_Cts  SNR Name
27.245 22.744 0.000 41.044 165.735 0.318 8.898 TRIG_00433065

Image time interval: 0.000 to 8.192 [sec]
Light Curves
Note: The mask-weighted lightcurves have units of either count/det or counts/sec/det, where a det is 0.4 x 0.4 = 0.16 sq cm.
Full-time range; 1 s binning
Other quick-look light curves:
- 64 ms binning (zoomed)
- 16 ms binning (zoomed)
- 8 ms binning (zoomed)
- 2 ms binning (zoomed)
- SN=5 or 10 s binning (full-time range)
- Raw light curve
Spectra
- 64 ms binning (zoomed)
- 16 ms binning (zoomed)
- 8 ms binning (zoomed)
- 2 ms binning (zoomed)
- SN=5 or 10 s binning (full-time range)
- Raw light curve
Spectra
Notes:
- 1) The fitting includes the systematic errors.
- 2) When the burst includes telescope slew time periods, the fitting uses an average response file made from multiple 5-s response files through out the slew time plus single time preiod for the non-slew times, and weighted by the total counts in the corresponding time period using addrmf. An average response file is needed becuase a spectral fit using the pre-slew DRM will introduce some errors in both a spectral shape and a normalization if the PHA file contains a lot of the slew/post-slew time interval.
- 3) For fits to more complicated models (e.g. a power-law over a cutoff power-law), the BAT team has decided to require a chi-square improvement of more than 6 for each extra dof.
Time averaged spectrum fit using the average DRM
Power-law model
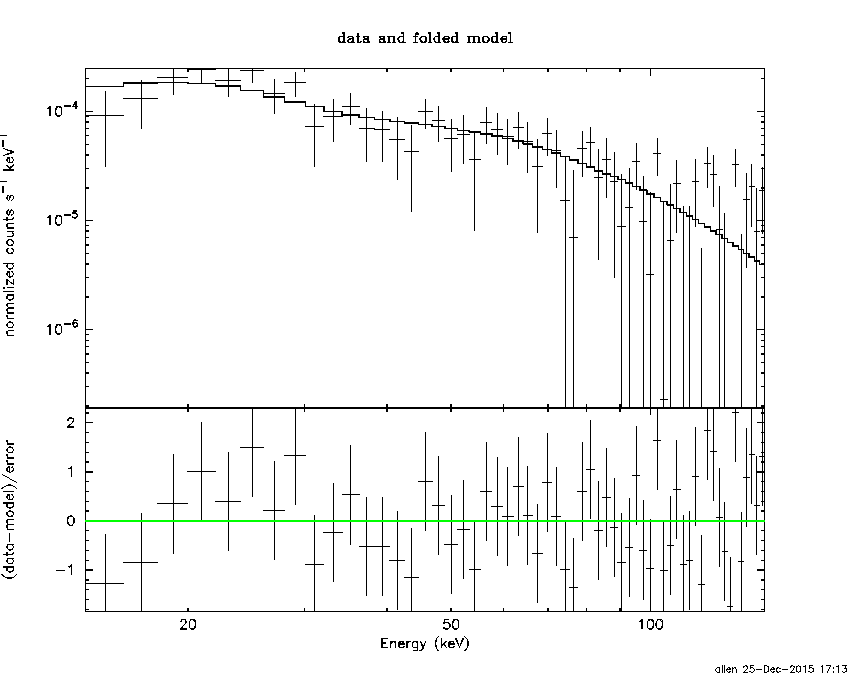
Time interval is from   -2.420 sec. to  458.424 sec.

Spectral model in power-law:
------------------------------------------------------------
Parameters  : value       lower 90%   higher 90%
Photon index: -1.40216     ( -0.204133   0.204463 )
Norm@50keV  : 4.39118E-04    ( -5.17692e-05   5.14189e-05 )
------------------------------------------------------------
#Fit statistic : Chi-Squared =          50.26 using 59 PHA bins.
# Reduced chi-squared =         0.8817 for     57 degrees of freedom
# Null hypothesis probability =   7.240799e-01

Photon flux (15-150 keV)    in 460.8 sec: 5.35036E-02 ( -0.0061795  0.0061854 ) ph/cm2/s
Energy fluence (15-150 keV)             : 1.95458e-06 ( -2.58706e-07  2.62357e-07 ) ergs/cm2
Cutoff power-law model

Time interval is from   -2.420 sec. to  458.424 sec.
Spectral model in the cutoff power-law:
------------------------------------------------------------
Parameters  : value       lower 90%   higher 90%
Photon index: -1.39937     ( -0.72388   0.60934 )
Epeak [keV] : 1.00000E+04      ( -10000 -10000 )
Norm@50keV  : 4.40667E-04    ( -5.21036e-05   5.02664e-05 )
------------------------------------------------------------
#Fit statistic : Chi-Squared =          50.26 using 59 PHA bins.
# Reduced chi-squared =         0.8976 for     56 degrees of freedom
# Null hypothesis probability =   6.907942e-01

Photon flux (15-150 keV)    in 460.8 sec: 5.36158E-02 ( -0.0065386  0.006268 ) ph/cm2/s
Energy fluence (15-150 keV)             : 1.9539e-06 ( 0  0 ) ergs/cm2
1-s peak spectrum fit
Power-law model
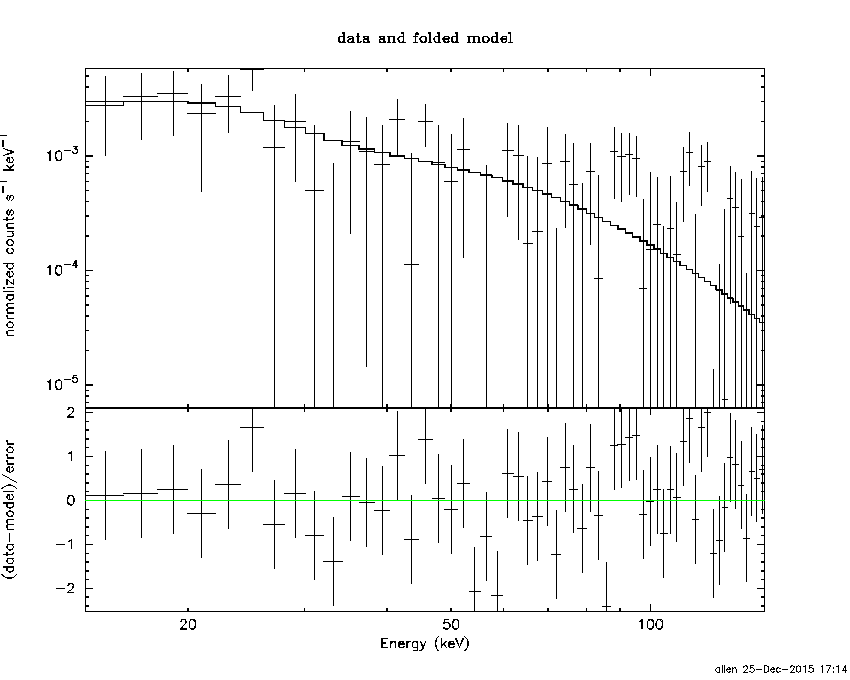
Time interval is from   -1.808 sec. to   -0.808 sec.

Spectral model in power-law:
------------------------------------------------------------
Parameters  : value       lower 90%   higher 90%
Photon index: -1.8402     ( -0.650236   0.576779 )
Norm@50keV  : 5.64543E-03    ( -0.00204903   0.00182125 )
------------------------------------------------------------
#Fit statistic : Chi-Squared =          56.44 using 59 PHA bins.
# Reduced chi-squared =         0.9901 for     57 degrees of freedom
# Null hypothesis probability =   4.961470e-01

Photon flux (15-150 keV)    in 1 sec: 0.790444 ( -0.221211  0.220976 ) ph/cm2/s
Energy fluence (15-150 keV)             : 5.19194e-08 ( -1.74003e-08  1.79537e-08 ) ergs/cm2
Cutoff power-law model
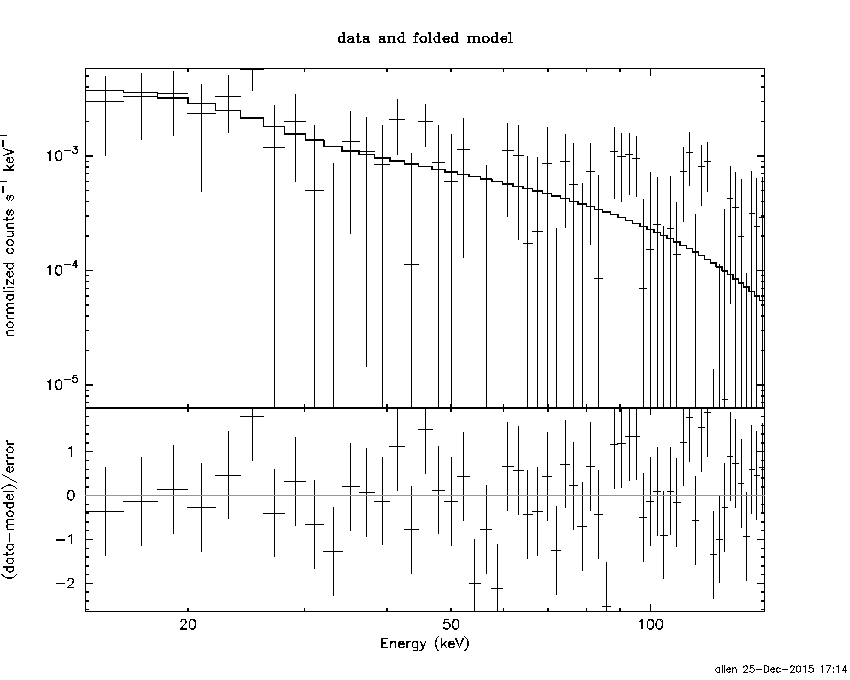
Time interval is from   -1.808 sec. to   -0.808 sec.
Spectral model in the cutoff power-law:
------------------------------------------------------------
Parameters  : value       lower 90%   higher 90%
Photon index: -3.07133     ( -0.333438   1.70169 )
Epeak [keV] : 317.469      (   )
Norm@50keV  : 1.43987E-03    (     )
------------------------------------------------------------
#Fit statistic : Chi-Squared =          54.97 using 59 PHA bins.
# Reduced chi-squared =         0.9816 for     56 degrees of freedom
# Null hypothesis probability =   5.137924e-01

Photon flux (15-150 keV)    in 1 sec: 0.803740 ( -0.230933  0.21014 ) ph/cm2/s
Energy fluence (15-150 keV)             : 4.27533e-08 ( -2.34407e-08  1.10526e-08 ) ergs/cm2
Time-resolved spectra
Distribution
T90 vs. Hardness ratio plot
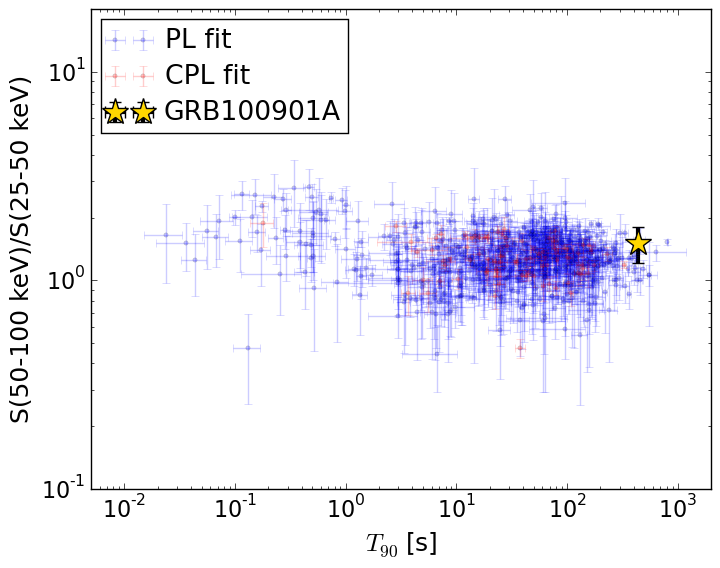
T90                                   = 436.656 sec.
Hardness ratio (energy fluence ratio) = 1.51345680698
S(15-50 keV) vs. S(50-150 keV) plot
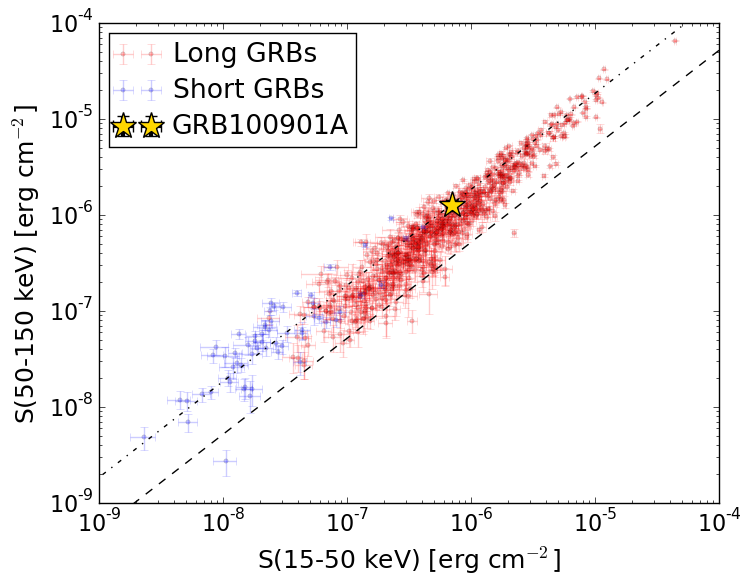
S(15-50 keV)  = 6.956758e-07
S(50-150 keV) = 1.2588964e-06
The dash-dotted line and the dashed line traces the fluences calculated from the Band function with Epeak = 15 and 150 keV, respectively. Both lines assume a canonical values of alpha = -1 and beta = -2.5.
Mask shadow pattern
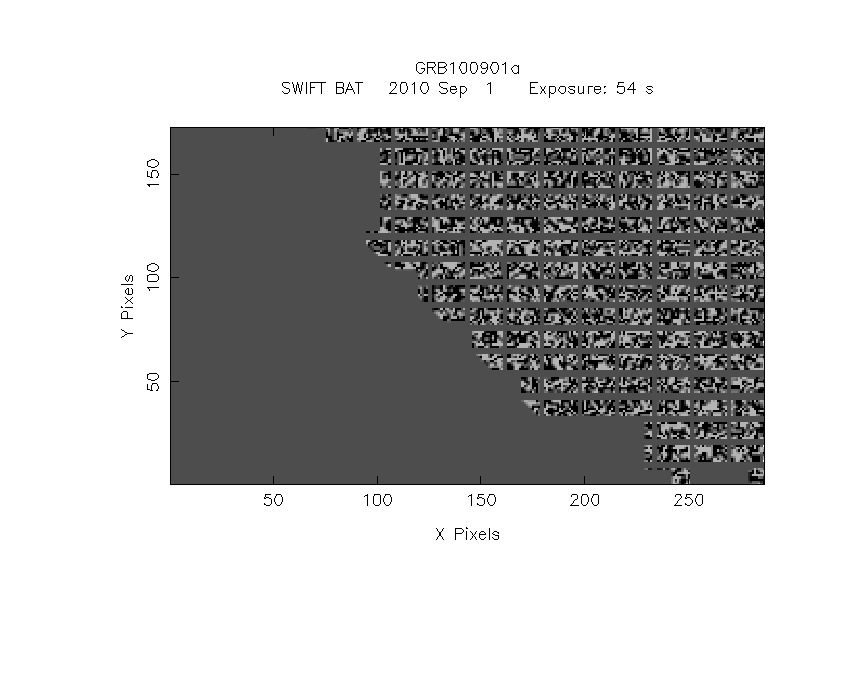
IMX = -0.843794285758, IMY = -0.214535657933
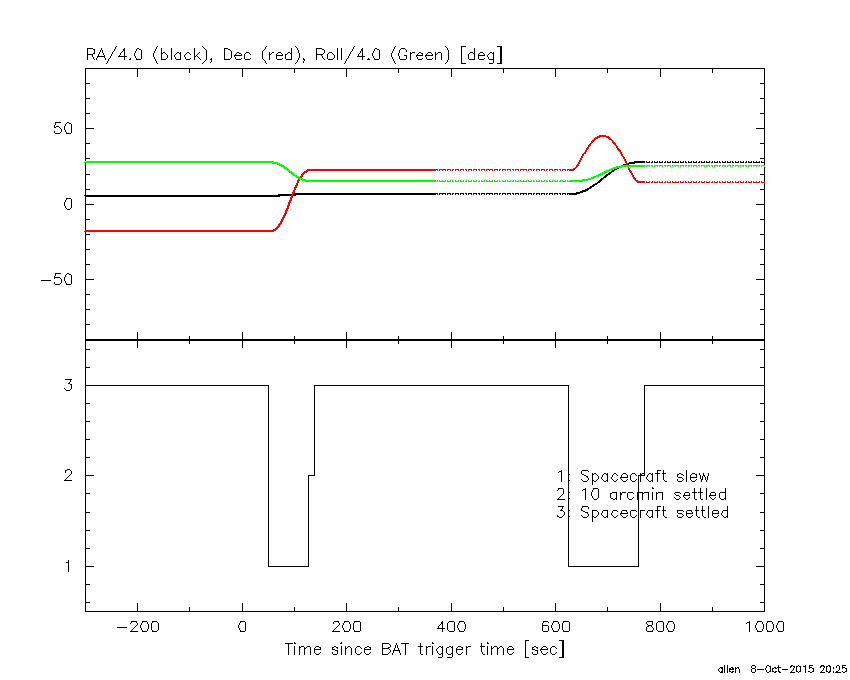
Spacecraft aspect plot
Bright source in the pre-burst/pre-slew/post-slew images
Pre-burst image of 15-350 keV band
Time interval of the image:
-239.512000 -2.420000

# RAcent  DECcent POSerr Theta    Phi  PeakCts   SNR AngSep     Name
#  [deg]    [deg]    ['] [deg]  [deg]                   [']
 39.8396  33.6801    3.1  54.3  176.9   2.3632   3.7 ------	UNKNOWN
 54.4826  32.0424    3.2  58.7 -169.2   3.5980   3.6 ------	UNKNOWN
Pre-slew background subtracted image of 15-350 keV band
Time interval of the image:
-2.420000 51.388600

# RAcent  DECcent POSerr Theta    Phi  PeakCts   SNR AngSep     Name
#  [deg]    [deg]    ['] [deg]  [deg]                   [']
 27.2549  22.7543    2.2  41.1  165.7   0.6884   5.2 ------	UNKNOWN
 27.2924  11.3554    2.1  29.8  168.5   0.4801   5.4 ------	UNKNOWN
 24.5745  -3.7907    2.4  14.4  167.2   0.3600   4.9 ------	UNKNOWN
 63.0742 -55.6500    2.5  48.4  -50.1   1.5872   4.7 ------	UNKNOWN
Post-slew image of 15-350 keV band
Time interval of the image:
127.588610 625.388600

# RAcent  DECcent POSerr Theta    Phi  PeakCts   SNR AngSep     Name
#  [deg]    [deg]    ['] [deg]  [deg]                   [']
 27.2676  22.7560    1.3   0.1 -167.3   2.6975   9.2 ------	UNKNOWN