Analysis Summary
Notes:
- 1) No attempt has been made to eliminate the non-significant decimal places.
- 2) This batgrbproduct analysis is done using the HEASARC data.
- 3) This batgrbproduct analysis is using the flight position for the mask-weighting calculation.
======================================================================
BAT GRB EVENT DATA PROCESSING REPORT
Process Script Ver: batgrbproduct v2.46
Process Start Time: Fri Jan 17 16:22:42 EST 2014
Host Name: batevent1
Current Working Dir: /local/data/batevent/batevent_reproc/trigger433160
======================================================================
Trigger: 00433160 Segment: 000
BAT Trigger Time: 305148720 [s; MET]
Trigger Stop: 305148784 [s; MET]
UTC: 2010-09-02T19:31:53.860200 [includes UTCF correction]
Where From?: TDRSS position message
BAT
RA: 48.6459500577974 Dec: 30.9725418949067 [deg; J2000]
Catalogged Source?: NO
Point Source?: YES
GRB Indicated?: YES [ by BAT flight software ]
Image S/N Ratio: 7.19
Image Trigger?: YES
Rate S/N Ratio: 0 [ if not an image trigger ]
Image S/N Ratio: 7.19
Analysis Position: [ source = BAT ]
RA: 48.6459500577974 Dec: 30.9725418949067 [deg; J2000]
Refined Position: [ source = BAT pre-slew burst ]
RA: 48.625072523013 Dec: 30.9696182703291 [deg; J2000]
{ 03h 14m 30.0s , +30d 58' 10.6" }
+/- 1.29755643064696 [arcmin] (estimated 90% radius based on SNR)
+/- 0.539213148555257 [arcmin] (formal 1-sigma fit error)
SNR: 20.9657037666019
Angular difference between the analysis and refined position is 1.088288 arcmin
Partial Coding Fraction: 0.7265625 [ including projection effects ]
Duration
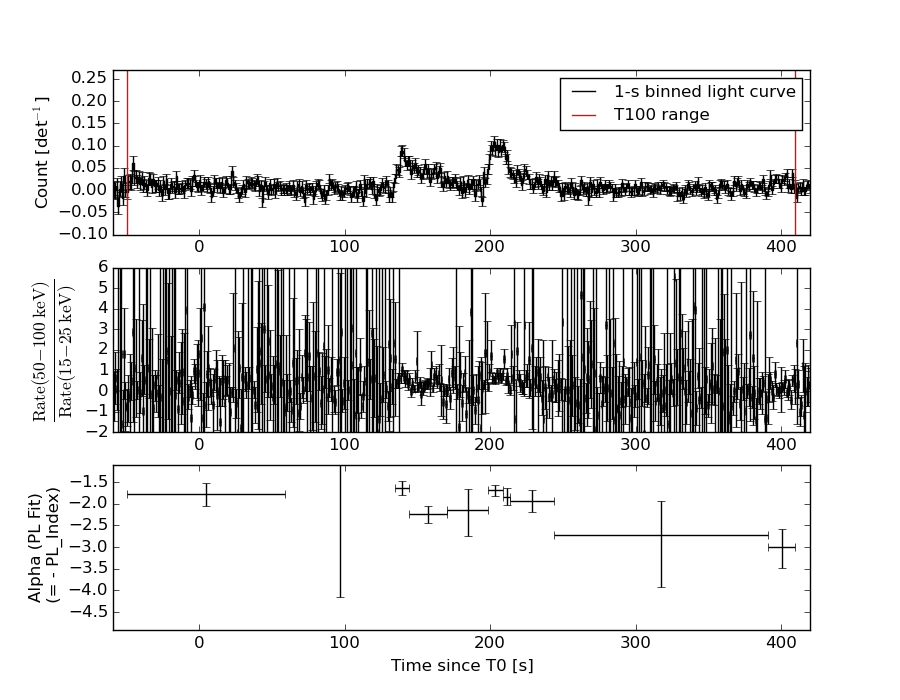
T90: 428.827999949455 +/- 47.2738088716741
Measured from: -35.972000002861
to: 392.855999946594 [s; relative to TRIGTIME]
T50: 75.1559999585152 +/- 13.4249177505554
Measured from: 138.603999972343
to: 213.759999930859 [s; relative to TRIGTIME]
Fluence
Peak Flux (peak 1 second)
Measured from: 207.888000011444
to: 208.888000011444 [s; relative to TRIGTIME]
Total Fluence
Measured from: -49.4279999732971
to: 409.632000029087 [s; relative to TRIGTIME]
Band 1 Band 2 Band 3 Band 4
15-25 25-50 50-100 100-350 keV
Total 2.407341 2.232833 1.338019 0.161921
0.118979 0.123421 0.110959 0.101978 [error]
Peak 0.033816 0.041938 0.032888 0.010653
0.006152 0.006385 0.005691 0.005080 [error]
[ fluence units of on-axis counts / fully illuminated detector ]
======================================================================
====== Table of the duration information =============================
Value tstart tstop
T100 459.060 -49.428 409.632
T90 428.828 -35.972 392.856
T50 75.156 138.604 213.760
Peak 1.000 207.888 208.888
====== Spectral Analysis Summary =====================================
Model : spectral model: simple power-law (PL) and cutoff power-law (CPL)
Ph_index : photon index: E^{Ph_index}
Ph_90err : 90% error of the photon index
Epeak : Epeak in keV
Epeak_90err: 90% error of Epeak
Norm : normalization at 50 keV in both the PL model and CPL model
Nomr_90err : 90% error of the normalization
chi2 : Chi-Squared
dof : degree of freedo
=== Time-averaged spectral analysis ===
(Best model with acceptable fit: PL)
Model Ph_index Ph_90err_low Ph_90err_hi Epeak Epeak_90err_low Epeak_90err_hi Norm Nomr_90err_low Norm_90err_hi chi2 dof
PL -1.985 -0.134 0.130 - - - 7.61e-04 -6.06e-05 5.96e-05 55.420 57
CPL -1.970 -0.354 0.468 84.772 -84.761 -84.772 7.76e-04 -2.84e-04 6.08e-04 55.420 56
=== 1-s peak spectral analysis ===
(Best model with acceptable fit: PL)
Model Ph_index Ph_90err_low Ph_90err_hi Epeak Epeak_90err_low Epeak_90err_hi Norm Nomr_90err_low Norm_90err_hi chi2 dof
PL -1.630 -0.294 0.281 - - - 7.43e-03 -1.30e-03 1.27e-03 54.320 57
CPL -1.452 -1.102 1.236 142.678 -142.678 -142.678 9.27e-03 -9.27e-03 3.28e-02 54.230 56
=== Fluence/Peak Flux Summary ===
Model Band1 Band2 Band3 Band4 Band5 Total
15-25 25-50 50-100 100-350 15-150 15-350 keV
Fluence PL 7.05e-07 9.65e-07 9.75e-07 1.79e-06 3.22e-06 4.43e-06 erg/cm2
90%_error_low -6.91e-08 -6.07e-08 -1.09e-07 -3.79e-07 -2.41e-07 -4.92e-07 erg/cm2
90%_error_hi 7.09e-08 6.07e-08 1.10e-07 4.46e-07 2.45e-07 5.43e-07 erg/cm2
Peak flux PL 3.46e-01 3.23e-01 2.09e-01 2.08e-01 9.64e-01 1.09e+00 ph/cm2/s
90%_error_low -8.36e-02 -5.09e-02 -4.76e-02 -8.16e-02 -1.50e-01 -1.73e-01 ph/cm2/s
90%_error_hi 8.85e-02 5.06e-02 4.75e-02 1.09e-01 1.50e-01 1.76e-01 ph/cm2/s
Fluence CPL 7.04e-07 9.66e-07 9.74e-07 1.75e-06 3.22e-06 4.39e-06 erg/cm2
90%_error_low -7.88e-08 -9.79e-08 -1.08e-07 -9.76e-07 -2.86e-07 -1.04e-06 erg/cm2
90%_error_hi 7.63e-08 7.52e-08 1.10e-07 1.19e-06 2.46e-07 5.61e-07 erg/cm2
Peak flux CPL 3.38e-01 3.29e-01 2.10e-01 1.62e-01 9.56e-01 1.04e+00 ph/cm2/s
90%_error_low -9.78e-02 -5.65e-02 -4.89e-02 -1.62e-01 -1.56e-01 -2.14e-01 ph/cm2/s
90%_error_hi 8.78e-02 6.51e-02 5.07e-02 9.78e-02 1.54e-01 2.16e-01 ph/cm2/s
======================================================================
Image
Pre-slew 15.0-350.0 keV image (Event data)
#   RAcent    DECcent   POSerr    Theta     Phi              Peak Cts       SNR   Name
   48.6251    30.9696   0.0092    20.6896   -76.6603         5.0215982     20.966 TRIG_00433160

Foreground time interval of the image:
 -3.899 260.301 (delta_t = 264.200 [sec])
Background time interval of the image:
Light Curves
Note: The mask-weighted lightcurves have units of either count/det or counts/sec/det, where a det is 0.4 x 0.4 = 0.16 sq cm.
Full-time range; 1 s binning
Other quick-look light curves:
- 64 ms binning (zoomed)
- 16 ms binning (zoomed)
- 8 ms binning (zoomed)
- 2 ms binning (zoomed)
- SN=5 or 10 s binning (full-time range)
- Raw light curve
Spectra
- 64 ms binning (zoomed)
- 16 ms binning (zoomed)
- 8 ms binning (zoomed)
- 2 ms binning (zoomed)
- SN=5 or 10 s binning (full-time range)
- Raw light curve
Spectra
Notes:
- 1) The fitting includes the systematic errors.
- 2) When the burst includes telescope slew time periods, the fitting uses an average response file made from multiple 5-s response files through out the slew time plus single time preiod for the non-slew times, and weighted by the total counts in the corresponding time period using addrmf. An average response file is needed becuase a spectral fit using the pre-slew DRM will introduce some errors in both a spectral shape and a normalization if the PHA file contains a lot of the slew/post-slew time interval.
- 3) For fits to more complicated models (e.g. a power-law over a cutoff power-law), the BAT team has decided to require a chi-square improvement of more than 6 for each extra dof.
Time averaged spectrum fit using the average DRM
Power-law model
Time interval is from  -49.428 sec. to  409.632 sec.

Spectral model in power-law:
------------------------------------------------------------
Parameters  : value       lower 90%   higher 90%
Photon index: -1.98536     ( -0.133837   0.12974 )
Norm@50keV  : 7.60747E-04    ( -6.06308e-05   5.95991e-05 )
------------------------------------------------------------
#Fit statistic : Chi-Squared =          55.42 using 59 PHA bins.
# Reduced chi-squared =         0.9723 for     57 degrees of freedom
# Null hypothesis probability =   5.344779e-01

Photon flux (15-150 keV)    in 459.1 sec: 0.113359 ( -0.007252  0.007265 ) ph/cm2/s
Energy fluence (15-150 keV)             : 3.21905e-06 ( -2.40893e-07  2.44628e-07 ) ergs/cm2
Cutoff power-law model

Time interval is from  -49.428 sec. to  409.632 sec.
Spectral model in the cutoff power-law:
------------------------------------------------------------
Parameters  : value       lower 90%   higher 90%
Photon index: -1.97004     ( -0.349328   0.472156 )
Epeak [keV] : 84.7724      ( -104.558 -104.57 )
Norm@50keV  : 7.75649E-04    ( -0.000279933   0.000612456 )
------------------------------------------------------------
#Fit statistic : Chi-Squared =          55.42 using 59 PHA bins.
# Reduced chi-squared =         0.9897 for     56 degrees of freedom
# Null hypothesis probability =   4.967334e-01

Photon flux (15-150 keV)    in 459.1 sec: 0.113286 ( -0.007822  0.007635 ) ph/cm2/s
Energy fluence (15-150 keV)             : 3.21512e-06 ( -2.8647e-07  2.45608e-07 ) ergs/cm2
1-s peak spectrum fit
Power-law model
Time interval is from  207.888 sec. to  208.888 sec.

Spectral model in power-law:
------------------------------------------------------------
Parameters  : value       lower 90%   higher 90%
Photon index: -1.63038     ( -0.293518   0.280898 )
Norm@50keV  : 7.42688E-03    ( -0.00130443   0.00126941 )
------------------------------------------------------------
#Fit statistic : Chi-Squared =          54.32 using 59 PHA bins.
# Reduced chi-squared =         0.9530 for     57 degrees of freedom
# Null hypothesis probability =   5.762593e-01

Photon flux (15-150 keV)    in 1 sec: 0.963622 ( -0.149538  0.149618 ) ph/cm2/s
Energy fluence (15-150 keV)             : 6.92245e-08 ( -1.28659e-08  1.32083e-08 ) ergs/cm2
Cutoff power-law model
Time interval is from  207.888 sec. to  208.888 sec.
Spectral model in the cutoff power-law:
------------------------------------------------------------
Parameters  : value       lower 90%   higher 90%
Photon index: -1.45212     ( -1.10192   1.2364 )
Epeak [keV] : 142.678      ( -142.665 -142.665 )
Norm@50keV  : 9.26632E-03    ( -0.00926661   0.0328226 )
------------------------------------------------------------
#Fit statistic : Chi-Squared =          54.23 using 59 PHA bins.
# Reduced chi-squared =         0.9685 for     56 degrees of freedom
# Null hypothesis probability =   5.419891e-01

Photon flux (15-150 keV)    in 1 sec: 0.956228 ( -0.156027  0.154202 ) ph/cm2/s
Energy fluence (15-150 keV)             : 6.7997e-08 ( -8.19854e-09  1.41629e-08 ) ergs/cm2
Time-resolved spectra
Distribution
T90 vs. Hardness ratio plot
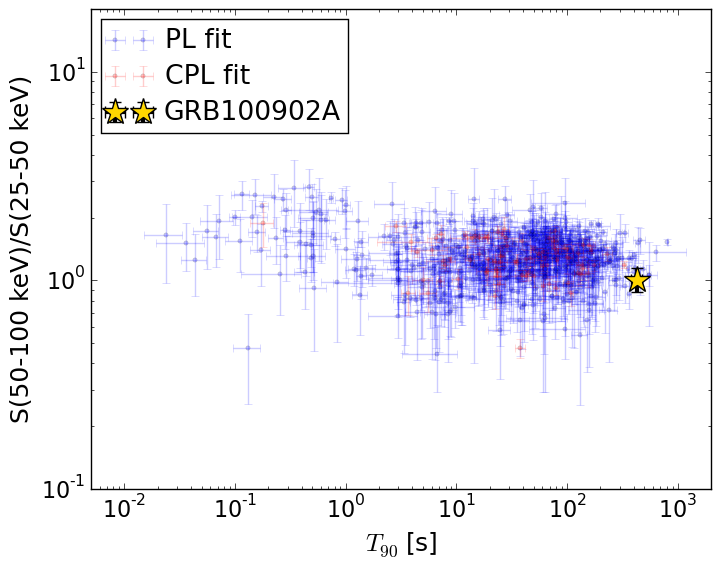
T90                                   = 428.828 sec.
Hardness ratio (energy fluence ratio) = 1.01022937396
S(15-50 keV) vs. S(50-150 keV) plot
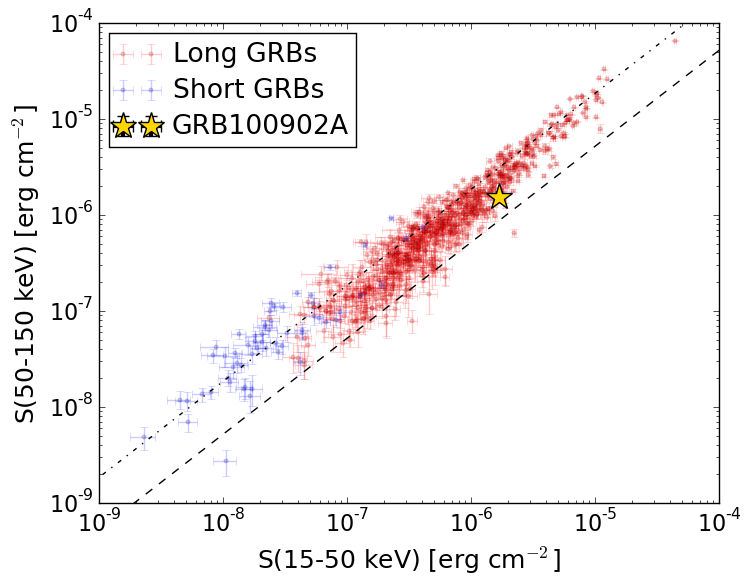
S(15-50 keV)  = 1.6696512e-06
S(50-150 keV) = 1.5493904e-06
The dash-dotted line and the dashed line traces the fluences calculated from the Band function with Epeak = 15 and 150 keV, respectively. Both lines assume a canonical values of alpha = -1 and beta = -2.5.
Mask shadow pattern
IMX = 8.713579396343785E-02, IMY = 3.674718432211420E-01
Spacecraft aspect plot
Bright source in the pre-burst/pre-slew/post-slew images
Pre-burst image of 15-350 keV band
Time interval of the image:
Pre-slew background subtracted image of 15-350 keV band
Time interval of the image:
-3.899400 260.300600

# RAcent  DECcent POSerr Theta    Phi  PeakCts   SNR AngSep     Name
#  [deg]    [deg]    ['] [deg]  [deg]                   [']
326.1173  38.4044   74.4  53.9  163.2  -0.1835  -0.2    5.6	Cyg X-2
 11.5054  40.4861    2.8  22.2 -171.9   0.7640   4.1 ------	UNKNOWN
320.8428  56.4945    2.4  58.3 -175.2   6.0551   4.8 ------	UNKNOWN
 42.9649  24.8621    3.1  14.5  -60.2   0.6922   3.7 ------	UNKNOWN
 48.6251  30.9696    0.6  20.7  -76.7   5.0211  21.0 ------	UNKNOWN
341.2657  64.0825    3.3  51.1 -162.5   1.6558   3.5 ------	UNKNOWN
356.2604  66.6551    2.8  48.1 -154.6   1.8972   4.1 ------	UNKNOWN
 77.4939  18.4142    7.3  47.0  -53.1   2.1932   2.1 ------	UNKNOWN
 77.7048  18.4628    7.2  47.2  -53.3   2.6192   2.4 ------	UNKNOWN
Post-slew image of 15-350 keV band
Time interval of the image:
305.500600 963.038100

# RAcent  DECcent POSerr Theta    Phi  PeakCts   SNR AngSep     Name
#  [deg]    [deg]    ['] [deg]  [deg]                   [']
 83.6323  22.0190    0.3  32.4  -63.3  25.0812  39.9    0.3	Crab
 72.4815  -8.8764    3.0  45.9  -14.5   2.5591   3.9 ------	UNKNOWN