Analysis Summary
Notes:
- 1) No attempt has been made to eliminate the non-significant decimal places.
- 2) This batgrbproduct analysis is done using the HEASARC data.
- 3) This batgrbproduct analysis is using the flight position for the mask-weighting calculation.
======================================================================
                  BAT GRB EVENT DATA PROCESSING REPORT
    Process Script Ver: batgrbproduct v2.46
    Process Start Time: Fri Jan 17 16:14:51 EST 2014
             Host Name: batevent1
   Current Working Dir: /local/data/batevent/batevent_reproc/trigger433442
======================================================================

  Trigger: 00433442      Segment: 000

  BAT Trigger Time: 305392100.864   [s; MET]
      Trigger Stop: 305392101.888   [s; MET]
               UTC: 2010-09-05T15:08:14.715440    [includes UTCF correction]
       Where From?: TDRSS position message

  BAT
    RA: 31.5300993876886   Dec: 14.9318648275642  [deg; J2000]

     Catalogged Source?: NO
     Point Source?:      YES
     GRB Indicated?:     YES    [ by BAT flight software ]
     Image S/N Ratio:    8.53
     Image Trigger?:     NO
     Rate S/N Ratio:     14.0356688476182  [ if not an image trigger ]
     Image S/N Ratio:    8.53

  Analysis Position:   [ source = BAT ]
    RA: 31.5300993876886   Dec: 14.9318648275642  [deg; J2000]

  Refined Position:   [ source = BAT pre-slew burst ]
    RA: 31.5408658320379   Dec: 14.9202012509081  [deg; J2000]
        { 02h 06m 09.8s , +14d 55' 12.7" }
         +/- 1.71112821237917 [arcmin] (estimated 90% radius based on SNR)
         +/- 0.86645675641838 [arcmin] (formal 1-sigma fit error)
    SNR: 14.1207443918381

  Angular difference between the analysis and refined position is 0.937739 arcmin

  Partial Coding Fraction: 1.015625    [ including projection effects ]

  Duration
     T90: 3.39599996805191 +/- 0.503698317939263
        Measured from: -1.52000004053116
                   to: 1.87599992752075     [s; relative to TRIGTIME]
     T50: 1.59199994802475 +/- 0.480337404463937
        Measured from: -0.60400003194809
                   to: 0.98799991607666     [s; relative to TRIGTIME]


  Fluence
     Peak Flux  (peak 1 second)
        Measured from: 0.0320000052452087
                   to: 1.03200000524521     [s; relative to TRIGTIME]
     Total Fluence
        Measured from: -1.64000004529953
                   to: 2.13999998569489     [s; relative to TRIGTIME]

             Band 1     Band 2     Band 3     Band 4
              15-25      25-50     50-100    100-350     keV
 Total     0.044207   0.103269   0.082903   0.025004
           0.009410   0.010073   0.009018   0.007356 [error]
 Peak      0.009367   0.034462   0.030413   0.009903
           0.004889   0.005234   0.004803   0.003756 [error]

     [ fluence units of on-axis counts / fully illuminated detector ]

======================================================================


====== Table of the duration information =============================

        Value   tstart    tstop
T100    3.780   -1.640    2.140
T90     3.396   -1.520    1.876
T50     1.592   -0.604    0.988
Peak    1.000    0.032    1.032


====== Spectral Analysis Summary =====================================

Model      : spectral model: simple power-law (PL) and cutoff power-law (CPL)
Ph_index   : photon index: E^{Ph_index}
Ph_90err   : 90% error of the photon index
Epeak      : Epeak in keV
Epeak_90err: 90% error of Epeak
Norm       : normalization at 50 keV in both the PL model and CPL model
Nomr_90err : 90% error of the normalization
chi2       : Chi-Squared
dof        : degree of freedo

=== Time-averaged spectral analysis ===
(Best model with acceptable fit: PL)

Model Ph_index Ph_90err_low Ph_90err_hi  Epeak  Epeak_90err_low  Epeak_90err_hi  Norm       Nomr_90err_low    Norm_90err_hi    chi2    dof
PL      -1.088    -0.186      0.192       -           -               -         4.37e-03     -4.90e-04          4.90e-04      54.580   57
CPL     -0.411    -0.735      0.845      126.929     -45.006      -126.929      9.12e-03     -4.90e-03          1.41e-02      52.200   56


=== 1-s peak spectral analysis ===
(Best model with acceptable fit: PL)

Model Ph_index Ph_90err_low Ph_90err_hi  Epeak  Epeak_90err_low  Epeak_90err_hi  Norm       Nomr_90err_low    Norm_90err_hi    chi2    dof
PL      -0.876     -0.280     0.300       -           -               -         5.23e-03     -9.80e-04          9.70e-04      56.830   57
CPL      0.882     -1.372     2.026       94.114     -24.743       121.882      3.10e-02     -3.10e-02          1.89e-01      51.620   56


=== Fluence/Peak Flux Summary ===

              Model    Band1     Band2     Band3     Band4     Band5     Total
                       15-25     25-50    50-100    100-350    15-150    15-350    keV
Fluence         PL   1.43e-08  3.40e-08  6.39e-08  2.91e-07  1.73e-07  4.04e-07   erg/cm2
      90%_error_low -2.98e-09 -4.47e-09 -8.22e-09 -7.48e-08 -2.12e-08 -8.08e-08   erg/cm2
      90%_error_hi   3.17e-09  4.40e-09  8.15e-09  9.15e-08  2.14e-08  9.50e-08   erg/cm2
Peak flux       PL   1.19e-01  1.74e-01  1.89e-01  3.86e-01  6.00e-01  8.68e-01   ph/cm2/s
      90%_error_low -4.07e-02 -4.07e-02 -3.51e-02 -1.28e-01 -1.11e-01 -1.67e-01   ph/cm2/s
      90%_error_hi   4.66e-02  4.03e-02  3.49e-02  1.65e-01  1.12e-01  1.76e-01   ph/cm2/s

Fluence        CPL   1.25e-08  3.61e-08  6.80e-08  1.22e-07  1.66e-07  2.38e-07   erg/cm2
      90%_error_low -3.56e-09 -5.17e-09 -9.49e-09 -6.95e-08 -2.32e-08 -7.22e-08   erg/cm2
      90%_error_hi   3.75e-09  5.35e-09  9.75e-09  1.75e-07  2.31e-08  1.95e-07   erg/cm2
Peak flux      CPL   7.43e-02  1.88e-01  2.27e-01  1.12e-01  5.69e-01  6.01e-01   ph/cm2/s
      90%_error_low -4.21e-02 -5.00e-02 -4.58e-02 -7.13e-02 -1.12e-01 -1.33e-01   ph/cm2/s
      90%_error_hi   5.41e-02  5.03e-02  4.76e-02  1.67e-01  1.14e-01  1.82e-01   ph/cm2/s

======================================================================
Image
Pre-slew 15.0-350.0 keV image (Event data)
#   RAcent    DECcent   POSerr    Theta     Phi              Peak Cts       SNR   Name
   31.5409    14.9202   0.0135     8.7935    12.5106         0.2632925     14.121 TRIG_00433442

Foreground time interval of the image:
 -1.640   2.140 (delta_t =   3.780 [sec])
Background time interval of the image:
-134.963  -1.640 (delta_t = 133.323 [sec])
Light Curves
Note: The mask-weighted lightcurves have units of either count/det or counts/sec/det, where a det is 0.4 x 0.4 = 0.16 sq cm.
Full-time range; 1 s binning
Other quick-look light curves:
- 64 ms binning (zoomed)
- 16 ms binning (zoomed)
- 8 ms binning (zoomed)
- 2 ms binning (zoomed)
- SN=5 or 10 s binning (full-time range)
- Raw light curve
Spectra
- 64 ms binning (zoomed)
- 16 ms binning (zoomed)
- 8 ms binning (zoomed)
- 2 ms binning (zoomed)
- SN=5 or 10 s binning (full-time range)
- Raw light curve
Spectra
Notes:
- 1) The fitting includes the systematic errors.
- 2) When the burst includes telescope slew time periods, the fitting uses an average response file made from multiple 5-s response files through out the slew time plus single time preiod for the non-slew times, and weighted by the total counts in the corresponding time period using addrmf. An average response file is needed becuase a spectral fit using the pre-slew DRM will introduce some errors in both a spectral shape and a normalization if the PHA file contains a lot of the slew/post-slew time interval.
- 3) For fits to more complicated models (e.g. a power-law over a cutoff power-law), the BAT team has decided to require a chi-square improvement of more than 6 for each extra dof.
Time averaged spectrum fit using the average DRM
Power-law model
Time interval is from   -1.640 sec. to    2.140 sec.

Spectral model in power-law:
------------------------------------------------------------
Parameters  : value       lower 90%   higher 90%
Photon index: -1.08769     ( -0.186361   0.19159 )
Norm@50keV  : 4.36817E-03    ( -0.000490327   0.00048958 )
------------------------------------------------------------
#Fit statistic : Chi-Squared =          54.58 using 59 PHA bins.
# Reduced chi-squared =         0.9575 for     57 degrees of freedom
# Null hypothesis probability =   5.663925e-01

Photon flux (15-150 keV)    in 3.78 sec: 0.506092 ( -0.058046  0.058161 ) ph/cm2/s
Energy fluence (15-150 keV)             : 1.73337e-07 ( -2.12328e-08  2.13878e-08 ) ergs/cm2
Cutoff power-law model
Time interval is from   -1.640 sec. to    2.140 sec.
Spectral model in the cutoff power-law:
------------------------------------------------------------
Parameters  : value       lower 90%   higher 90%
Photon index: -0.411417     ( -0.734644   0.844682 )
Epeak [keV] : 126.929      ( -45.0065 -126.93 )
Norm@50keV  : 9.12362E-03    ( -0.00490333   0.014092 )
------------------------------------------------------------
#Fit statistic : Chi-Squared =          52.20 using 59 PHA bins.
# Reduced chi-squared =         0.9322 for     56 degrees of freedom
# Null hypothesis probability =   6.194244e-01

Photon flux (15-150 keV)    in 3.78 sec: 0.493621 ( -0.059861  0.059851 ) ph/cm2/s
Energy fluence (15-150 keV)             : 1.66185e-07 ( -2.31832e-08  2.30501e-08 ) ergs/cm2
1-s peak spectrum fit
Power-law model
Time interval is from    0.032 sec. to    1.032 sec.

Spectral model in power-law:
------------------------------------------------------------
Parameters  : value       lower 90%   higher 90%
Photon index: -0.875971     ( -0.280479   0.299884 )
Norm@50keV  : 5.22938E-03    ( -0.000980094   0.000970001 )
------------------------------------------------------------
#Fit statistic : Chi-Squared =          56.83 using 59 PHA bins.
# Reduced chi-squared =         0.9970 for     57 degrees of freedom
# Null hypothesis probability =   4.814469e-01

Photon flux (15-150 keV)    in 1 sec: 0.600138 ( -0.111262  0.111951 ) ph/cm2/s
Energy fluence (15-150 keV)             : 5.9253e-08 ( -1.1127e-08  1.11985e-08 ) ergs/cm2
Cutoff power-law model
Time interval is from    0.032 sec. to    1.032 sec.
Spectral model in the cutoff power-law:
------------------------------------------------------------
Parameters  : value       lower 90%   higher 90%
Photon index: 0.881916     ( -1.37211   2.02545 )
Epeak [keV] : 94.1143      ( -24.7411 121.883 )
Norm@50keV  : 3.10010E-02    ( -0.0310054   0.188951 )
------------------------------------------------------------
#Fit statistic : Chi-Squared =          51.62 using 59 PHA bins.
# Reduced chi-squared =         0.9218 for     56 degrees of freedom
# Null hypothesis probability =   6.410954e-01

Photon flux (15-150 keV)    in 1 sec: 0.568719 ( -0.112429  0.114119 ) ph/cm2/s
Energy fluence (15-150 keV)             : 5.48264e-08 ( -1.21537e-08  1.21019e-08 ) ergs/cm2
Time-resolved spectra
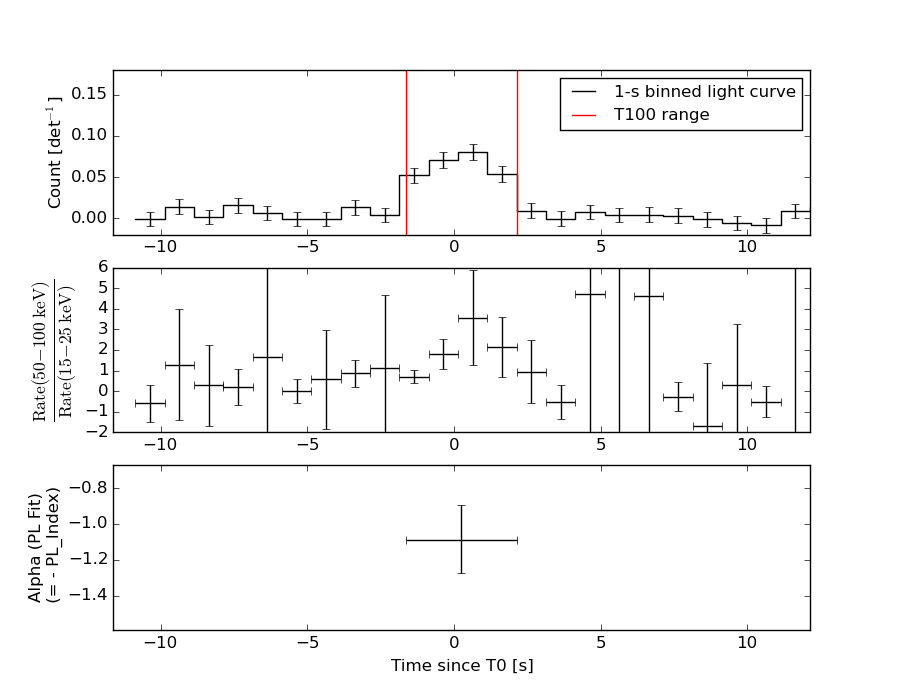
Distribution
T90 vs. Hardness ratio plot
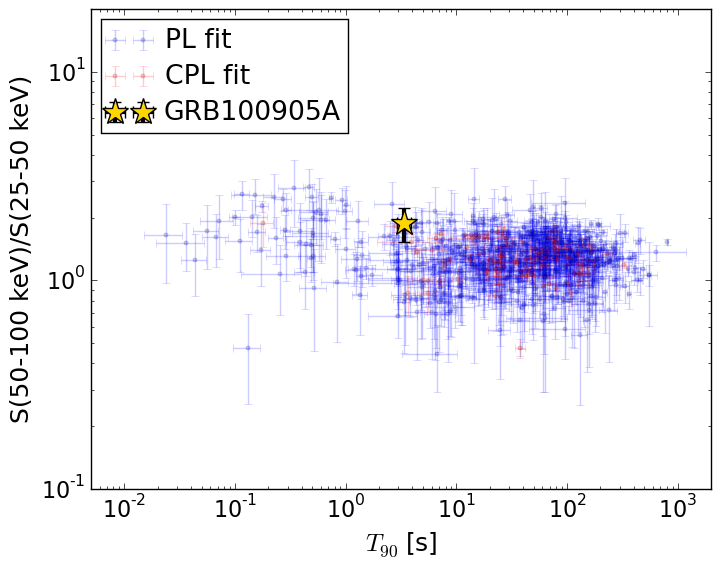
T90                                   = 3.396 sec.
Hardness ratio (energy fluence ratio) = 1.88204506937
S(15-50 keV) vs. S(50-150 keV) plot
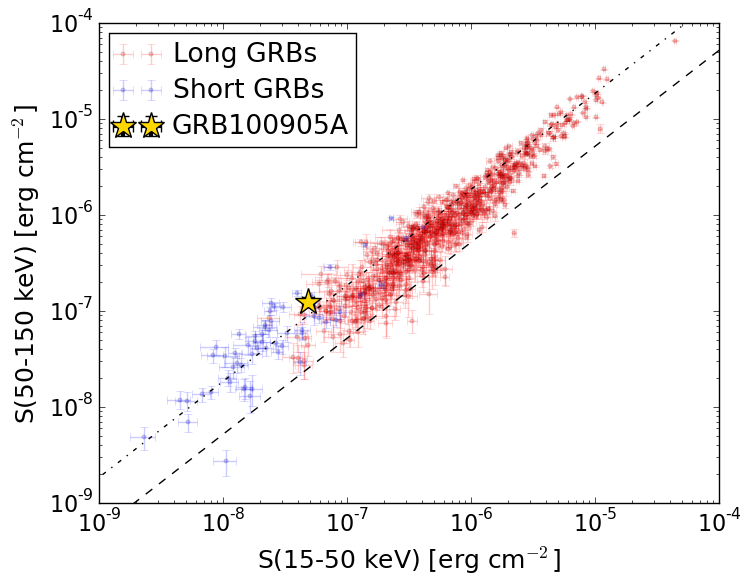
S(15-50 keV)  = 4.832452e-08
S(50-150 keV) = 1.2501197e-07
The dash-dotted line and the dashed line traces the fluences calculated from the Band function with Epeak = 15 and 150 keV, respectively. Both lines assume a canonical values of alpha = -1 and beta = -2.5.
Mask shadow pattern
IMX = 1.510184813019935E-01, IMY = -3.350921789987814E-02
Spacecraft aspect plot
Bright source in the pre-burst/pre-slew/post-slew images
Pre-burst image of 15-350 keV band
Time interval of the image:
-134.963400 -1.640000

# RAcent  DECcent POSerr Theta    Phi  PeakCts   SNR AngSep     Name
#  [deg]    [deg]    ['] [deg]  [deg]                   [']
326.2406  38.3128    5.0  53.8  162.2   1.3851   2.3    3.3	Cyg X-2
 27.5439 -25.9926    2.6  48.7   40.2   2.4007   4.3 ------	UNKNOWN
 25.9359   5.9401    2.1  16.9   45.1   0.6260   5.4 ------	UNKNOWN
Pre-slew background subtracted image of 15-350 keV band
Time interval of the image:
-1.640000 2.140000

# RAcent  DECcent POSerr Theta    Phi  PeakCts   SNR AngSep     Name
#  [deg]    [deg]    ['] [deg]  [deg]                   [']
326.1674  38.4304   19.2  53.9  162.4   0.0596   0.6    6.5	Cyg X-2
 22.6907   8.3445    2.8  15.1   58.2   0.0796   4.2 ------	UNKNOWN
 17.3483  15.3746    2.3  11.9   94.1   0.0940   5.0 ------	UNKNOWN
 31.5409  14.9202    0.8   8.8   12.5   0.2632  14.1 ------	UNKNOWN
Post-slew image of 15-350 keV band
Time interval of the image:
57.836600 962.236700

# RAcent  DECcent POSerr Theta    Phi  PeakCts   SNR AngSep     Name
#  [deg]    [deg]    ['] [deg]  [deg]                   [']
349.2564  59.8058    2.8  54.4  177.1   6.6977   4.2 ------	UNKNOWN
 46.9583 -16.6265    3.0  35.0   -4.7   2.1966   3.9 ------	UNKNOWN
  1.7461  69.0411    2.7  57.3 -170.5   9.2371   4.3 ------	UNKNOWN