Analysis Summary
Notes:
- 1) No attempt has been made to eliminate the non-significant decimal places.
- 2) This batgrbproduct analysis is done using the HEASARC data.
- 3) This batgrbproduct analysis is using the flight position for the mask-weighting calculation.
======================================================================
                  BAT GRB EVENT DATA PROCESSING REPORT
    Process Script Ver: batgrbproduct v2.46
    Process Start Time: Fri Jan 17 16:11:03 EST 2014
             Host Name: batevent1
   Current Working Dir: /local/data/batevent/batevent_reproc/trigger433509
======================================================================

  Trigger: 00433509      Segment: 000

  BAT Trigger Time: 305473773.568   [s; MET]
      Trigger Stop: 305473774.08   [s; MET]
               UTC: 2010-09-06T13:49:27.416480    [includes UTCF correction]
       Where From?: TDRSS position message

  BAT
    RA: 28.7092893597252   Dec: 55.6138119348437  [deg; J2000]

     Catalogged Source?: NO
     Point Source?:      YES
     GRB Indicated?:     YES    [ by BAT flight software ]
     Image S/N Ratio:    10.5
     Image Trigger?:     NO
     Rate S/N Ratio:     22.6936114358204  [ if not an image trigger ]
     Image S/N Ratio:    10.5

  Analysis Position:   [ source = BAT ]
    RA: 28.7092893597252   Dec: 55.6138119348437  [deg; J2000]

  Refined Position:   [ source = BAT pre-slew burst ]
    RA: 28.6975930422741   Dec: 55.6340175239447  [deg; J2000]
        { 01h 54m 47.4s , +55d 38' 02.5" }
         +/- 0.5428358946804 [arcmin] (estimated 90% radius based on SNR)
         +/- 0.189423184990397 [arcmin] (formal 1-sigma fit error)
    SNR: 72.8053506697827

  Angular difference between the analysis and refined position is 1.275446 arcmin

  Partial Coding Fraction: 0.46875    [ including projection effects ]

  Duration
     T90: 114.631999969482 +/- 1.45567579568409
        Measured from: 1.72799998521805
                   to: 116.3599999547     [s; relative to TRIGTIME]
     T50: 60.8839999437332 +/- 9.62651423071575
        Measured from: 7.4559999704361
                   to: 68.3399999141693     [s; relative to TRIGTIME]


  Fluence
     Peak Flux  (peak 1 second)
        Measured from: 10.4799999594688
                   to: 11.4799999594688     [s; relative to TRIGTIME]
     Total Fluence
        Measured from: -0.220000028610229
                   to: 130.455999970436     [s; relative to TRIGTIME]

             Band 1     Band 2     Band 3     Band 4
              15-25      25-50     50-100    100-350     keV
 Total     6.150371   7.283245   5.090590   1.191241
           0.074590   0.079412   0.070977   0.055400 [error]
 Peak      0.261982   0.429478   0.373102   0.103917
           0.012324   0.014421   0.014066   0.009715 [error]

     [ fluence units of on-axis counts / fully illuminated detector ]

======================================================================


====== Table of the duration information =============================

        Value   tstart    tstop
T100  130.676   -0.220  130.456
T90   114.632    1.728  116.360
T50    60.884    7.456   68.340
Peak    1.000   10.480   11.480


====== Spectral Analysis Summary =====================================

Model      : spectral model: simple power-law (PL) and cutoff power-law (CPL)
Ph_index   : photon index: E^{Ph_index}
Ph_90err   : 90% error of the photon index
Epeak      : Epeak in keV
Epeak_90err: 90% error of Epeak
Norm       : normalization at 50 keV in both the PL model and CPL model
Nomr_90err : 90% error of the normalization
chi2       : Chi-Squared
dof        : degree of freedo

=== Time-averaged spectral analysis ===
(Best model with acceptable fit: PL)

Model Ph_index Ph_90err_low Ph_90err_hi  Epeak  Epeak_90err_low  Epeak_90err_hi  Norm       Nomr_90err_low    Norm_90err_hi    chi2    dof
PL      -1.723    -0.035      0.035       -           -               -         9.85e-03     -1.73e-04          1.73e-04      55.580   57
CPL     -1.722    -0.035      0.041     9998.780    -9998.770      -9998.780      9.86e-03     -1.70e-04          1.13e-03      55.590   56


=== 1-s peak spectral analysis ===
(Best model with acceptable fit: CPL)

Model Ph_index Ph_90err_low Ph_90err_hi  Epeak  Epeak_90err_low  Epeak_90err_hi  Norm       Nomr_90err_low    Norm_90err_hi    chi2    dof
PL      -1.399     -0.067     0.067       -           -               -         8.38e-02     -3.23e-03          3.23e-03      48.150   57
CPL     -1.008     -0.265     0.282      138.371     -36.454       163.144      1.28e-01     -3.12e-02          4.41e-02      41.650   56


=== Fluence/Peak Flux Summary ===

              Model    Band1     Band2     Band3     Band4     Band5     Total
                       15-25     25-50    50-100    100-350    15-150    15-350    keV
Fluence         PL   2.03e-06  3.25e-06  3.94e-06  9.36e-06  1.19e-05  1.86e-05   erg/cm2
      90%_error_low -7.73e-08 -7.06e-08 -8.31e-08 -4.61e-07 -2.09e-07 -4.91e-07   erg/cm2
      90%_error_hi   7.87e-08  7.04e-08  8.29e-08  4.78e-07  2.09e-07  5.02e-07   erg/cm2
Peak flux       PL   3.13e+00  3.35e+00  2.54e+00  3.13e+00  1.02e+01  1.21e+01   ph/cm2/s
      90%_error_low -2.24e-01 -1.48e-01 -1.16e-01 -2.89e-01 -4.14e-01 -4.73e-01   ph/cm2/s
      90%_error_hi   2.30e-01  1.48e-01  1.15e-01  3.06e-01  4.14e-01  4.73e-01   ph/cm2/s

Fluence        CPL   2.03e-06  3.25e-06  3.93e-06  9.58e-06  1.19e-05  1.89e-05   erg/cm2
      90%_error_low -7.74e-08 -9.18e-08 -1.05e-07    N/A    -3.18e-07 -1.54e-06   erg/cm2
      90%_error_hi   7.88e-08  9.60e-08  1.33e-07    N/A     2.53e-07  1.65e-07   erg/cm2
Peak flux      CPL   2.86e+00  3.44e+00  2.65e+00  2.14e+00  1.00e+01  1.11e+01   ph/cm2/s
      90%_error_low -2.79e-01 -1.63e-01 -1.39e-01 -4.73e-01 -4.31e-01 -6.62e-01   ph/cm2/s
      90%_error_hi   2.86e-01  1.65e-01  1.40e-01  6.33e-01  4.31e-01  7.65e-01   ph/cm2/s

======================================================================
Image
Pre-slew 15.0-350.0 keV image (Event data)
#   RAcent    DECcent   POSerr    Theta     Phi              Peak Cts       SNR   Name
   28.6976    55.6340   0.0026    40.7779  -150.4510         7.6037461     72.805 TRIG_00433509

Foreground time interval of the image:
 -0.220   9.933 (delta_t =  10.153 [sec])
Background time interval of the image:
-239.568  -0.220 (delta_t = 239.348 [sec])
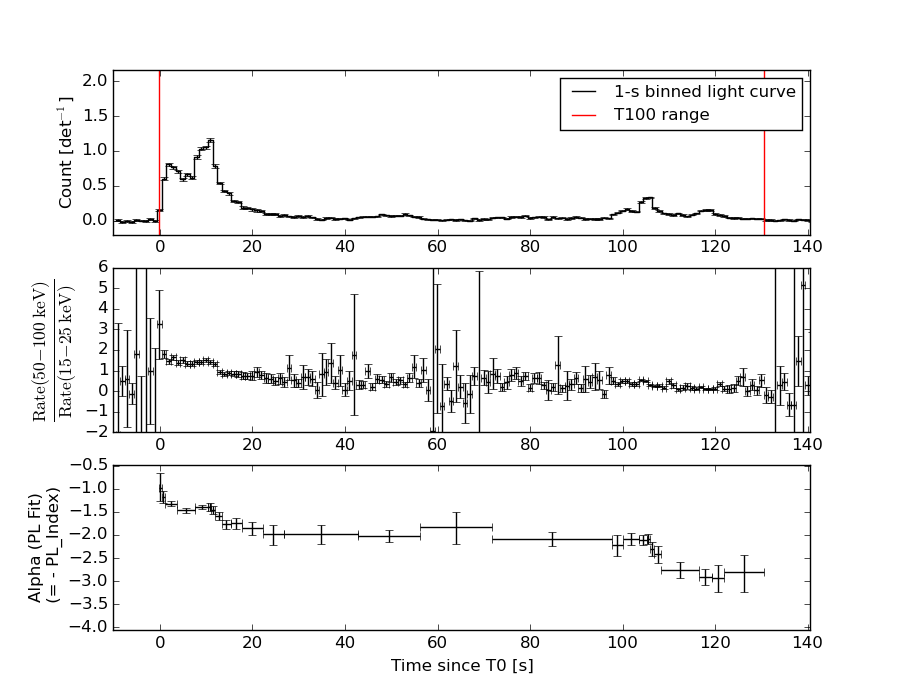
Light Curves
Note: The mask-weighted lightcurves have units of either count/det or counts/sec/det, where a det is 0.4 x 0.4 = 0.16 sq cm.
Full-time range; 1 s binning
Other quick-look light curves:
- 64 ms binning (zoomed)
- 16 ms binning (zoomed)
- 8 ms binning (zoomed)
- 2 ms binning (zoomed)
- SN=5 or 10 s binning (full-time range)
- Raw light curve
Spectra
- 64 ms binning (zoomed)
- 16 ms binning (zoomed)
- 8 ms binning (zoomed)
- 2 ms binning (zoomed)
- SN=5 or 10 s binning (full-time range)
- Raw light curve
Spectra
Notes:
- 1) The fitting includes the systematic errors.
- 2) When the burst includes telescope slew time periods, the fitting uses an average response file made from multiple 5-s response files through out the slew time plus single time preiod for the non-slew times, and weighted by the total counts in the corresponding time period using addrmf. An average response file is needed becuase a spectral fit using the pre-slew DRM will introduce some errors in both a spectral shape and a normalization if the PHA file contains a lot of the slew/post-slew time interval.
- 3) For fits to more complicated models (e.g. a power-law over a cutoff power-law), the BAT team has decided to require a chi-square improvement of more than 6 for each extra dof.
Time averaged spectrum fit using the average DRM
Power-law model
Time interval is from   -0.220 sec. to  130.456 sec.

Spectral model in power-law:
------------------------------------------------------------
Parameters  : value       lower 90%   higher 90%
Photon index: -1.72288     ( -0.0354203   0.035363 )
Norm@50keV  : 9.84613E-03    ( -0.000172642   0.000172626 )
------------------------------------------------------------
#Fit statistic : Chi-Squared =          55.58 using 59 PHA bins.
# Reduced chi-squared =         0.9751 for     57 degrees of freedom
# Null hypothesis probability =   5.285587e-01

Photon flux (15-150 keV)    in 130.7 sec: 1.31836 ( -0.02915  0.02933 ) ph/cm2/s
Energy fluence (15-150 keV)             : 1.18967e-05 ( -2.09073e-07  2.09179e-07 ) ergs/cm2
Cutoff power-law model
Time interval is from   -0.220 sec. to  130.456 sec.
Spectral model in the cutoff power-law:
------------------------------------------------------------
Parameters  : value       lower 90%   higher 90%
Photon index: -1.72157     ( -0.0354148   0.0407789 )
Epeak [keV] : 9998.78      ( -9998.98 -9998.99 )
Norm@50keV  : 9.85985E-03    ( -0.000172666   0.00112753 )
------------------------------------------------------------
#Fit statistic : Chi-Squared =          55.59 using 59 PHA bins.
# Reduced chi-squared =         0.9927 for     56 degrees of freedom
# Null hypothesis probability =   4.901883e-01

Photon flux (15-150 keV)    in 130.7 sec: 1.32242 ( -0.04901  0.03666 ) ph/cm2/s
Energy fluence (15-150 keV)             : 1.192e-05 ( -3.18445e-07  2.53239e-07 ) ergs/cm2
1-s peak spectrum fit
Power-law model
Time interval is from   10.480 sec. to   11.480 sec.

Spectral model in power-law:
------------------------------------------------------------
Parameters  : value       lower 90%   higher 90%
Photon index: -1.39885     ( -0.0667566   0.0666405 )
Norm@50keV  : 8.37969E-02    ( -0.0032347   0.00323417 )
------------------------------------------------------------
#Fit statistic : Chi-Squared =          48.15 using 59 PHA bins.
# Reduced chi-squared =         0.8447 for     57 degrees of freedom
# Null hypothesis probability =   7.918262e-01

Photon flux (15-150 keV)    in 1 sec: 10.2024 ( -0.41355  0.4142 ) ph/cm2/s
Energy fluence (15-150 keV)             : 8.09991e-07 ( -3.37618e-08  3.38294e-08 ) ergs/cm2
Cutoff power-law model
Time interval is from   10.480 sec. to   11.480 sec.
Spectral model in the cutoff power-law:
------------------------------------------------------------
Parameters  : value       lower 90%   higher 90%
Photon index: -1.00777     ( -0.265455   0.281911 )
Epeak [keV] : 138.371      ( -36.454 163.144 )
Norm@50keV  : 0.127910    ( -0.0311682   0.0441454 )
------------------------------------------------------------
#Fit statistic : Chi-Squared =          41.65 using 59 PHA bins.
# Reduced chi-squared =         0.7438 for     56 degrees of freedom
# Null hypothesis probability =   9.233404e-01

Photon flux (15-150 keV)    in 1 sec: 10.0165 ( -0.43058  0.4311 ) ph/cm2/s
Energy fluence (15-150 keV)             : 7.94603e-07 ( -3.58507e-08  3.57065e-08 ) ergs/cm2
Time-resolved spectra
Distribution
T90 vs. Hardness ratio plot
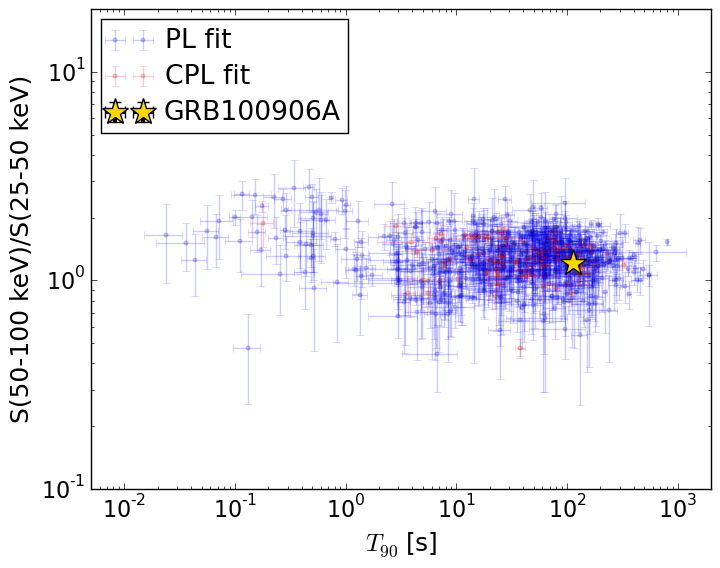
T90                                   = 114.632 sec.
Hardness ratio (energy fluence ratio) = 1.21179722312
S(15-50 keV) vs. S(50-150 keV) plot
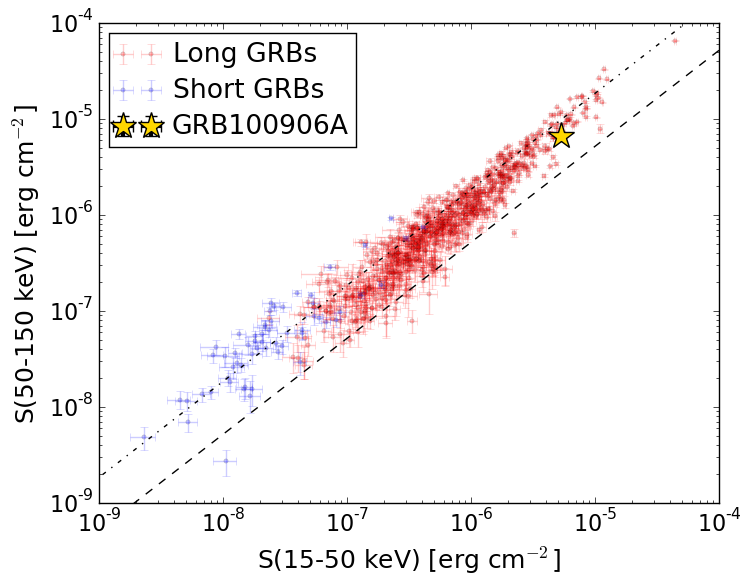
S(15-50 keV)  = 5.277074e-06
S(50-150 keV) = 6.619643e-06
The dash-dotted line and the dashed line traces the fluences calculated from the Band function with Epeak = 15 and 150 keV, respectively. Both lines assume a canonical values of alpha = -1 and beta = -2.5.
Mask shadow pattern
IMX = -7.503218835992842E-01, IMY = 4.253591034882063E-01
Spacecraft aspect plot
Bright source in the pre-burst/pre-slew/post-slew images
Pre-burst image of 15-350 keV band
Time interval of the image:
-239.568000 -0.220000

# RAcent  DECcent POSerr Theta    Phi  PeakCts   SNR AngSep     Name
#  [deg]    [deg]    ['] [deg]  [deg]                   [']
  4.6816  -3.0756    2.6  32.1   90.1   1.4847   4.4  336.0	UNKNOWN
338.8633  55.0988    3.2  56.9  179.1   3.5912   3.6 ------	UNKNOWN
 51.6414  -3.2609    2.3  27.0  -17.2   0.8409   5.0 ------	UNKNOWN
346.6147  63.0392    3.2  57.3 -170.3   2.8555   3.6 ------	UNKNOWN
 71.7380  19.7532    3.3  38.6  -71.1   1.6383   3.5 ------	UNKNOWN
 78.8954   6.7995    3.3  47.1  -53.4   2.6575   3.5 ------	UNKNOWN
 71.7772  33.6110    3.3  40.8  -92.6   2.8851   3.5 ------	UNKNOWN
 54.7276  62.5648    2.7  50.4 -134.4   3.5156   4.3 ------	UNKNOWN
Pre-slew background subtracted image of 15-350 keV band
Time interval of the image:
-0.220000 9.932590

# RAcent  DECcent POSerr Theta    Phi  PeakCts   SNR AngSep     Name
#  [deg]    [deg]    ['] [deg]  [deg]                   [']
 42.6433 -21.0567    2.5  37.6   14.9   0.3803   4.5 ------	UNKNOWN
 44.9803  10.0558    2.7  14.0  -39.2   0.2677   4.3 ------	UNKNOWN
 52.0409  22.8074    2.6  20.9  -83.3   0.3540   4.5 ------	UNKNOWN
 67.3651  -9.8638    2.7  43.3  -25.2   0.4770   4.3 ------	UNKNOWN
 28.6976  55.6340    0.2  40.8 -150.5   7.6024  72.8 ------	UNKNOWN
Post-slew image of 15-350 keV band
Time interval of the image:
69.132590 962.458600

# RAcent  DECcent POSerr Theta    Phi  PeakCts   SNR AngSep     Name
#  [deg]    [deg]    ['] [deg]  [deg]                   [']
 83.6318  22.0169    0.6  52.4  -29.3  30.9807  20.1    0.2	Crab
308.1185  40.9485    8.5  52.4  153.8   3.7181   1.3    0.4	Cyg X-3
325.9850  38.4422  103.3  44.3  138.5   0.1844   0.1   11.4	Cyg X-2
 28.6616  55.6469    1.1   0.0 -156.2   5.6072  10.8 ------	UNKNOWN
 54.2624  56.3139    2.8  14.3  -59.4   1.9394   4.1 ------	UNKNOWN
 95.4402  37.8918    3.0  46.9  -53.1  10.2289   3.9 ------	UNKNOWN
 95.9492  38.0212    3.2  47.1  -53.6   9.3968   3.6 ------	UNKNOWN