Analysis Summary
Notes:
- 1) No attempt has been made to eliminate the non-significant decimal places.
- 2) This batgrbproduct analysis is done using the HEASARC data.
- 3) This batgrbproduct analysis is using the flight position for the mask-weighting calculation.
======================================================================
BAT GRB EVENT DATA PROCESSING REPORT
Process Script Ver: batgrbproduct v2.46
Process Start Time: Fri Jan 17 16:05:00 EST 2014
Host Name: batevent1
Current Working Dir: /local/data/batevent/batevent_reproc/trigger434178
======================================================================
Trigger: 00434178 Segment: 000
BAT Trigger Time: 306207072 [s; MET]
Trigger Stop: 306207136 [s; MET]
UTC: 2010-09-15T01:31:05.822060 [includes UTCF correction]
Where From?: TDRSS position message
BAT
RA: 315.648430088771 Dec: 65.6666778587913 [deg; J2000]
Catalogged Source?: NO
Point Source?: YES
GRB Indicated?: YES [ by BAT flight software ]
Image S/N Ratio: 8.67
Image Trigger?: YES
Rate S/N Ratio: 0 [ if not an image trigger ]
Image S/N Ratio: 8.67
Analysis Position: [ source = BAT ]
RA: 315.648430088771 Dec: 65.6666778587913 [deg; J2000]
Refined Position: [ source = BAT pre-slew burst ]
RA: 315.668971063575 Dec: 65.6831438613723 [deg; J2000]
{ 21h 02m 40.6s , +65d 40' 59.3" }
+/- 1.96083564054061 [arcmin] (estimated 90% radius based on SNR)
+/- 1.00571384314772 [arcmin] (formal 1-sigma fit error)
SNR: 11.6237229045367
Angular difference between the analysis and refined position is 1.110761 arcmin
Partial Coding Fraction: 0.546875 [ including projection effects ]
Duration
T90: 199.195999920368 +/- 26.1886720109784
Measured from: -28.2639999985695
to: 170.931999921799 [s; relative to TRIGTIME]
T50: 74.6999999284744 +/- 44.7318905947454
Measured from: -4.24000000953674
to: 70.4599999189377 [s; relative to TRIGTIME]
Fluence
Peak Flux (peak 1 second)
Measured from: 8.75999999046326
to: 9.75999999046326 [s; relative to TRIGTIME]
Total Fluence
Measured from: -36.3040000200272
to: 185.84399998188 [s; relative to TRIGTIME]
Band 1 Band 2 Band 3 Band 4
15-25 25-50 50-100 100-350 keV
Total 0.752220 0.829151 0.704758 0.309393
0.091951 0.094342 0.084187 0.075489 [error]
Peak 0.024448 0.007320 0.019966 0.014234
0.006898 0.007078 0.006518 0.005852 [error]
[ fluence units of on-axis counts / fully illuminated detector ]
======================================================================
====== Table of the duration information =============================
Value tstart tstop
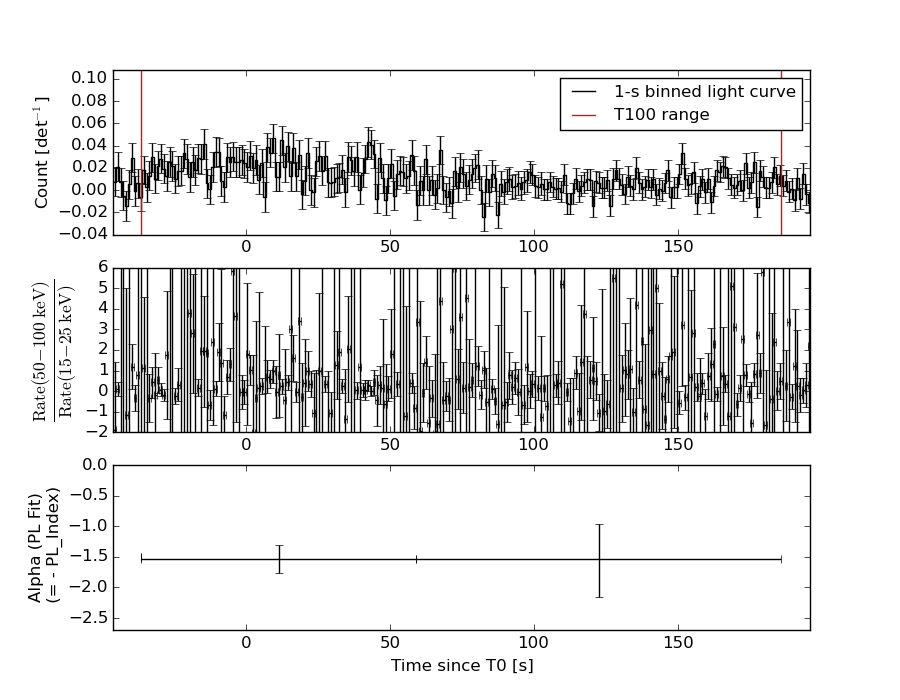
T100 222.148 -36.304 185.844
T90 199.196 -28.264 170.932
T50 74.700 -4.240 70.460
Peak 1.000 8.760 9.760
====== Spectral Analysis Summary =====================================
Model : spectral model: simple power-law (PL) and cutoff power-law (CPL)
Ph_index : photon index: E^{Ph_index}
Ph_90err : 90% error of the photon index
Epeak : Epeak in keV
Epeak_90err: 90% error of Epeak
Norm : normalization at 50 keV in both the PL model and CPL model
Nomr_90err : 90% error of the normalization
chi2 : Chi-Squared
dof : degree of freedo
=== Time-averaged spectral analysis ===
(Best model with acceptable fit: PL)
Model Ph_index Ph_90err_low Ph_90err_hi Epeak Epeak_90err_low Epeak_90err_hi Norm Nomr_90err_low Norm_90err_hi chi2 dof
PL -1.521 -0.236 0.231 - - - 7.13e-04 -8.60e-05 8.44e-05 70.740 57
CPL -1.545 -2.423 -0.660 9999.360 -9683.318 -9506.040 7.06e-04 -7.06e-04 -4.02e-04 70.820 56
=== 1-s peak spectral analysis ===
(Best model with acceptable fit: N/A)
Model Ph_index Ph_90err_low Ph_90err_hi Epeak Epeak_90err_low Epeak_90err_hi Norm Nomr_90err_low Norm_90err_hi chi2 dof
PL -1.604 -3.207 1.124 - - - 3.65e-03 -3.65e-03 1.44e-03 72.020 57
CPL -1.635 N/A N/A 9999.310 N/A N/A 3.63e-03 N/A N/A 72.030 56
=== Fluence/Peak Flux Summary ===
Model Band1 Band2 Band3 Band4 Band5 Total
15-25 25-50 50-100 100-350 15-150 15-350 keV
Fluence PL 2.06e-07 3.74e-07 5.22e-07 1.52e-06 1.50e-06 2.62e-06 erg/cm2
90%_error_low -4.23e-08 -4.48e-08 -8.79e-08 -5.01e-07 -2.01e-07 -5.74e-07 erg/cm2
90%_error_hi 4.47e-08 4.42e-08 8.64e-08 6.52e-07 2.04e-07 6.99e-07 erg/cm2
Peak flux PL 1.69e-01 1.58e-01 1.02e-01 1.03e-01 4.71e-01 5.32e-01 ph/cm2/s
90%_error_low -1.69e-01 -7.65e-02 -1.02e-01 -1.03e-01 -1.75e-01 -2.02e-01 ph/cm2/s
90%_error_hi 1.75e-01 5.82e-02 6.29e-02 3.00e-01 1.71e-01 2.18e-01 ph/cm2/s
Fluence CPL 2.07e-07 1.36e-07 2.83e-07 1.51e-06 1.50e-06 2.57e-06 erg/cm2
90%_error_low -4.26e-08 -9.08e-08 -6.81e-08 N/A -2.12e-07 -5.97e-07 erg/cm2
90%_error_hi 4.45e-08 1.04e-07 5.06e-08 N/A 2.16e-07 7.43e-07 erg/cm2
Peak flux CPL 1.48e-01 9.93e-02 4.55e-02 3.49e-02 3.08e-01 3.29e-01 ph/cm2/s
90%_error_low -7.22e-02 -9.93e-02 -4.55e-02 -3.49e-02 -2.30e-01 N/A ph/cm2/s
90%_error_hi 1.55e-01 -4.92e-02 -4.00e-02 -3.41e-02 3.07e-02 N/A ph/cm2/s
======================================================================
Image
Pre-slew 15.0-350.0 keV image (Event data)
#   RAcent    DECcent   POSerr    Theta     Phi              Peak Cts       SNR   Name
  315.6690    65.6831   0.0166    26.8537  -103.6419         2.0279576     11.624 TRIG_00434178

Foreground time interval of the image:
-36.304  73.101 (delta_t = 109.405 [sec])
Background time interval of the image:
-693.599 -681.917 (delta_t =  11.682 [sec])
-239.000 -36.304 (delta_t = 202.696 [sec])
Light Curves
Note: The mask-weighted lightcurves have units of either count/det or counts/sec/det, where a det is 0.4 x 0.4 = 0.16 sq cm.
Full-time range; 1 s binning
Other quick-look light curves:
- 64 ms binning (zoomed)
- 16 ms binning (zoomed)
- 8 ms binning (zoomed)
- 2 ms binning (zoomed)
- SN=5 or 10 s binning (full-time range)
- Raw light curve
Spectra
- 64 ms binning (zoomed)
- 16 ms binning (zoomed)
- 8 ms binning (zoomed)
- 2 ms binning (zoomed)
- SN=5 or 10 s binning (full-time range)
- Raw light curve
Spectra
Notes:
- 1) The fitting includes the systematic errors.
- 2) When the burst includes telescope slew time periods, the fitting uses an average response file made from multiple 5-s response files through out the slew time plus single time preiod for the non-slew times, and weighted by the total counts in the corresponding time period using addrmf. An average response file is needed becuase a spectral fit using the pre-slew DRM will introduce some errors in both a spectral shape and a normalization if the PHA file contains a lot of the slew/post-slew time interval.
- 3) For fits to more complicated models (e.g. a power-law over a cutoff power-law), the BAT team has decided to require a chi-square improvement of more than 6 for each extra dof.
Time averaged spectrum fit using the average DRM
Power-law model
Time interval is from  -36.304 sec. to  185.844 sec.

Spectral model in power-law:
------------------------------------------------------------
Parameters  : value       lower 90%   higher 90%
Photon index: -1.52129     ( -0.235684   0.231294 )
Norm@50keV  : 7.13491E-04    ( -8.5991e-05   8.44357e-05 )
------------------------------------------------------------
#Fit statistic : Chi-Squared =          70.74 using 59 PHA bins.
# Reduced chi-squared =          1.241 for     57 degrees of freedom
# Null hypothesis probability =   1.042585e-01

Photon flux (15-150 keV)    in 222.1 sec: 8.95939E-02 ( -0.0103383  0.0103625 ) ph/cm2/s
Energy fluence (15-150 keV)             : 1.49837e-06 ( -2.01044e-07  2.03784e-07 ) ergs/cm2
Cutoff power-law model
Time interval is from  -36.304 sec. to  185.844 sec.
Spectral model in the cutoff power-law:
------------------------------------------------------------
Parameters  : value       lower 90%   higher 90%
Photon index: -3.48933     ( -0.484835   1.27833 )
Epeak [keV] : 386.211      ( -68.1138 109.165 )
Norm@50keV  : 8.84591E-05    ( -9.00594e-05   0.000214362 )
------------------------------------------------------------
#Fit statistic : Chi-Squared =          63.38 using 59 PHA bins.
# Reduced chi-squared =          1.132 for     56 degrees of freedom
# Null hypothesis probability =   2.322711e-01

Photon flux (15-150 keV)    in 222.1 sec: 8.96023E-02 ( -0.0103648  0.0103408 ) ph/cm2/s
Energy fluence (15-150 keV)             : 1.49744e-06 ( -2.1168e-07  2.15608e-07 ) ergs/cm2
1-s peak spectrum fit
Power-law model
Time interval is from    8.760 sec. to    9.760 sec.

Spectral model in power-law:
------------------------------------------------------------
Parameters  : value       lower 90%   higher 90%
Photon index: -1.60372     ( -3.19809   1.13258 )
Norm@50keV  : 3.65410E-03    ( -0.00364167   0.00145217 )
------------------------------------------------------------
#Fit statistic : Chi-Squared =          72.02 using 59 PHA bins.
# Reduced chi-squared =          1.264 for     57 degrees of freedom
# Null hypothesis probability =   8.682196e-02

Photon flux (15-150 keV)    in 1 sec: 0.470899 ( -0.174826  0.171228 ) ph/cm2/s
Energy fluence (15-150 keV)             : 3.37746e-08 ( -2.30453e-08  1.77791e-08 ) ergs/cm2
Cutoff power-law model
Time interval is from    8.760 sec. to    9.760 sec.
Spectral model in the cutoff power-law:
------------------------------------------------------------
Parameters  : value       lower 90%   higher 90%
Photon index: -7.954     (       )
Epeak [keV] : 776.480      (   )
Norm@50keV  : 5.03134E-06    (     )
------------------------------------------------------------
#Fit statistic : Chi-Squared =          62.03 using 59 PHA bins.
# Reduced chi-squared =          1.108 for     56 degrees of freedom
# Null hypothesis probability =   2.699655e-01

Photon flux (15-150 keV)    in 1 sec: 0.308493 ( -0.229983  0.030675 ) ph/cm2/s
Energy fluence (15-150 keV)             : 1.81589e-08 ( -1.52729e-08  1.68227e-08 ) ergs/cm2
Time-resolved spectra
Distribution
T90 vs. Hardness ratio plot
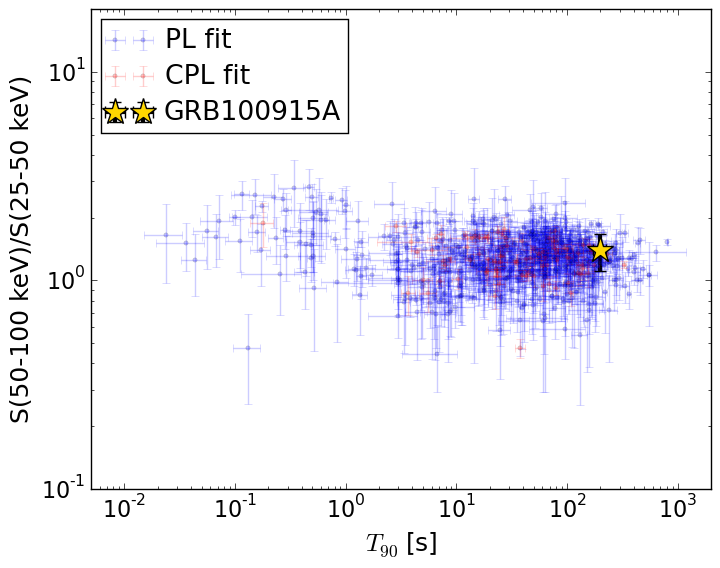
T90                                   = 199.196 sec.
Hardness ratio (energy fluence ratio) = 1.3934779038
S(15-50 keV) vs. S(50-150 keV) plot
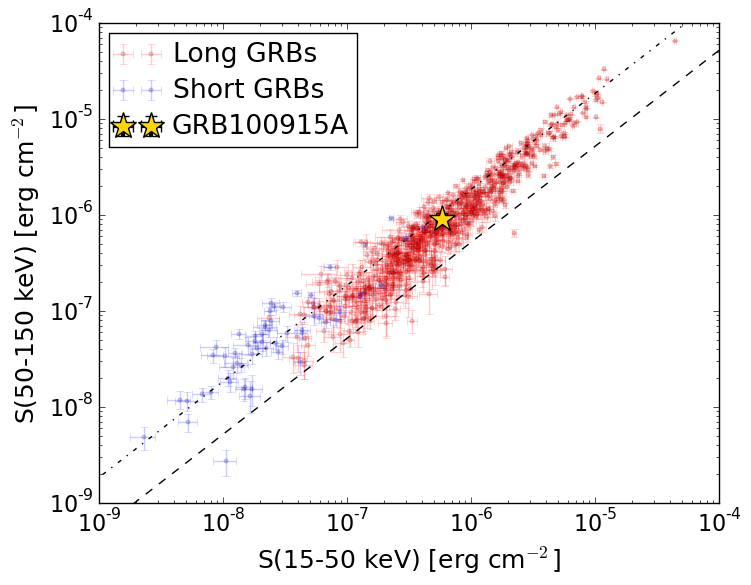
S(15-50 keV)  = 5.808475e-07
S(50-150 keV) = 9.175295e-07
The dash-dotted line and the dashed line traces the fluences calculated from the Band function with Epeak = 15 and 150 keV, respectively. Both lines assume a canonical values of alpha = -1 and beta = -2.5.
Mask shadow pattern
IMX = -1.194153001834824E-01, IMY = 4.920300537634579E-01
Spacecraft aspect plot
Bright source in the pre-burst/pre-slew/post-slew images
Pre-burst image of 15-350 keV band
Time interval of the image:
-693.599400 -681.917100
-239.000000 -36.304000

# RAcent  DECcent POSerr Theta    Phi  PeakCts   SNR AngSep     Name
#  [deg]    [deg]    ['] [deg]  [deg]                   [']
299.5873  35.1915    1.6  38.2 -161.9   1.8868   7.3    0.6	Cyg X-1
308.1148  40.9531    1.3  29.6 -158.1   1.7408   8.6    0.2	Cyg X-3
326.1521  38.3224    6.2  18.2 -179.3   0.3030   1.8    0.9	Cyg X-2
 32.6295  32.6342    2.1  35.9   21.6   1.4270   5.5 ------	UNKNOWN
305.8865  23.9161    2.3  40.6  178.7   1.3716   5.1 ------	UNKNOWN
 35.4359  47.9060    2.9  31.6   -5.3   0.8444   4.1 ------	UNKNOWN
288.8653  16.6142    2.8  57.2 -173.7   3.8656   4.1 ------	UNKNOWN
 83.7475  70.7134    3.1  49.2  -48.1   3.5968   3.7 ------	UNKNOWN
273.9093  50.8527    2.8  47.9 -129.0   3.3432   4.0 ------	UNKNOWN
Pre-slew background subtracted image of 15-350 keV band
Time interval of the image:
-36.304000 73.100590

# RAcent  DECcent POSerr Theta    Phi  PeakCts   SNR AngSep     Name
#  [deg]    [deg]    ['] [deg]  [deg]                   [']
299.4720  35.2752    5.8  38.2 -161.6   0.3551   2.0    7.3	Cyg X-1
307.9157  40.8954    7.9  29.8 -158.0   0.2041   1.5    9.5	Cyg X-3
326.0283  38.3637    4.2  18.3 -178.9  -0.3358  -2.8    7.2	Cyg X-2
281.5361  21.2711    2.6  59.2 -164.1   3.6699   4.5 ------	UNKNOWN
315.6690  65.6831    1.0  26.9 -103.6   2.0287  11.6 ------	UNKNOWN
Post-slew image of 15-350 keV band
Time interval of the image:
121.300600 500.606000
502.000000 963.100000

# RAcent  DECcent POSerr Theta    Phi  PeakCts   SNR AngSep     Name
#  [deg]    [deg]    ['] [deg]  [deg]                   [']
254.6280  35.2154    7.8  46.5 -150.7  -1.5644  -1.5   11.3	Her X-1
299.5727  35.1880    1.0  31.9  154.4   7.6683  12.0    1.2	Cyg X-1
308.0777  40.9539    1.0  25.1  142.7   5.8427  11.7    1.5	Cyg X-3
326.2052  38.3160    4.4  28.0  111.3   1.6890   2.6    1.6	Cyg X-2
261.4089  26.7955    2.7  51.3 -162.7   4.8994   4.3 ------	UNKNOWN