Analysis Summary
Notes:
- 1) No attempt has been made to eliminate the non-significant decimal places.
- 2) This batgrbproduct analysis is done using the HEASARC data.
- 3) This batgrbproduct analysis is using the flight position for the mask-weighting calculation.
======================================================================
                  BAT GRB EVENT DATA PROCESSING REPORT
    Process Script Ver: batgrbproduct v2.46
    Process Start Time: Fri Jan 17 15:56:59 EST 2014
             Host Name: batevent1
   Current Working Dir: /local/data/batevent/batevent_reproc/trigger434360
======================================================================

  Trigger: 00434360      Segment: 000

  BAT Trigger Time: 306392611.968   [s; MET]
      Trigger Stop: 306392616.064   [s; MET]
               UTC: 2010-09-17T05:03:25.783360    [includes UTCF correction]
       Where From?: TDRSS position message

  BAT
    RA: 289.264654463964   Dec: -17.1044750247871  [deg; J2000]

     Catalogged Source?: NO
     Point Source?:      YES
     GRB Indicated?:     YES    [ by BAT flight software ]
     Image S/N Ratio:    7.15
     Image Trigger?:     NO
     Rate S/N Ratio:     7.87400787401181  [ if not an image trigger ]
     Image S/N Ratio:    7.15

  Analysis Position:   [ source = BAT ]
    RA: 289.264654463964   Dec: -17.1044750247871  [deg; J2000]

  Refined Position:   [ source = BAT pre-slew burst ]
    RA: 289.245015480821   Dec: -17.1145190496547  [deg; J2000]
        { 19h 16m 58.8s , -17d 06' 52.3" }
         +/- 2.02941237603008 [arcmin] (estimated 90% radius based on SNR)
         +/- 0.85007181876365 [arcmin] (formal 1-sigma fit error)
    SNR: 11.066695103936

  Angular difference between the analysis and refined position is 1.277295 arcmin

  Partial Coding Fraction: 0.625    [ including projection effects ]

  Duration
     T90: 63.8159999251366 +/- 21.5559585471355
        Measured from: -0.755999982357025
                   to: 63.0599999427795     [s; relative to TRIGTIME]
     T50: 19.095999956131 +/- 8.08033788468745
        Measured from: 4.66000002622604
                   to: 23.755999982357     [s; relative to TRIGTIME]


  Fluence
     Peak Flux  (peak 1 second)
        Measured from: 3.22000002861023
                   to: 4.22000002861023     [s; relative to TRIGTIME]
     Total Fluence
        Measured from: -2.21200001239777
                   to: 66.2239999771118     [s; relative to TRIGTIME]

             Band 1     Band 2     Band 3     Band 4
              15-25      25-50     50-100    100-350     keV
 Total     0.492077   0.472441   0.381378   0.085281
           0.055022   0.055659   0.048648   0.042845 [error]
 Peak      0.014026   0.031949   0.018047   0.016462
           0.006982   0.007115   0.006355   0.005415 [error]

     [ fluence units of on-axis counts / fully illuminated detector ]

======================================================================


====== Table of the duration information =============================

        Value   tstart    tstop
T100   68.436   -2.212   66.224
T90    63.816   -0.756   63.060
T50    19.096    4.660   23.756
Peak    1.000    3.220    4.220


====== Spectral Analysis Summary =====================================

Model      : spectral model: simple power-law (PL) and cutoff power-law (CPL)
Ph_index   : photon index: E^{Ph_index}
Ph_90err   : 90% error of the photon index
Epeak      : Epeak in keV
Epeak_90err: 90% error of Epeak
Norm       : normalization at 50 keV in both the PL model and CPL model
Nomr_90err : 90% error of the normalization
chi2       : Chi-Squared
dof        : degree of freedo

=== Time-averaged spectral analysis ===
(Best model with acceptable fit: PL)

Model Ph_index Ph_90err_low Ph_90err_hi  Epeak  Epeak_90err_low  Epeak_90err_hi  Norm       Nomr_90err_low    Norm_90err_hi    chi2    dof
PL      -1.614    -0.223      0.218       -           -               -         1.33e-03     -1.66e-04          1.63e-04      69.190   57
CPL     -1.622    -0.216      0.228     9999.340    -9999.340      -9999.340      1.33e-03     -1.33e-03          6.99e-04      69.210   56


=== 1-s peak spectral analysis ===
(Best model with acceptable fit: PL)

Model Ph_index Ph_90err_low Ph_90err_hi  Epeak  Epeak_90err_low  Epeak_90err_hi  Norm       Nomr_90err_low    Norm_90err_hi    chi2    dof
PL      -1.661     -0.596     0.556       -           -               -         4.65e-03     -1.55e-03          1.42e-03      67.170   57
CPL     -1.693      N/A       N/A        9999.360      N/A           N/A         4.56e-03        N/A               N/A         67.190   56


=== Fluence/Peak Flux Summary ===

              Model    Band1     Band2     Band3     Band4     Band5     Total
                       15-25     25-50    50-100    100-350    15-150    15-350    keV
Fluence         PL   1.30e-07  2.22e-07  2.90e-07  7.69e-07  8.52e-07  1.41e-06   erg/cm2
      90%_error_low -2.46e-08 -2.57e-08 -4.97e-08 -2.49e-07 -1.14e-07 -2.95e-07   erg/cm2
      90%_error_hi   2.56e-08  2.56e-08  4.94e-08  3.21e-07  1.16e-07  3.53e-07   erg/cm2
Peak flux       PL   2.24e-01  2.05e-01  1.29e-01  1.25e-01  6.10e-01  6.83e-01   ph/cm2/s
      90%_error_low -9.82e-02 -5.74e-02 -5.54e-02 -8.17e-02 -1.67e-01 -1.92e-01   ph/cm2/s
      90%_error_hi   1.06e-01  5.65e-02  5.44e-02  1.47e-01  1.67e-01  1.97e-01   ph/cm2/s

Fluence        CPL   1.31e-07  1.66e-07  2.87e-07  8.69e-07  8.60e-07  1.40e-06   erg/cm2
      90%_error_low -2.65e-08 -4.01e-08 -4.63e-08 -4.84e-07 -1.22e-07 -3.84e-07   erg/cm2
      90%_error_hi   2.47e-08  3.10e-08  5.28e-08  4.16e-08  1.08e-07  3.44e-07   erg/cm2
Peak flux      CPL   1.97e-01  1.46e-01  7.50e-02  6.55e-02  4.45e-01  4.83e-01   ph/cm2/s
      90%_error_low     N/A   -8.98e-02 -4.50e-02 -2.10e-02 -2.71e-01 -2.96e-01   ph/cm2/s
      90%_error_hi      N/A    9.32e-02  2.94e-02  3.29e-02  2.60e-01  2.76e-01   ph/cm2/s

======================================================================
Image
Pre-slew 15.0-350.0 keV image (Event data)
#   RAcent    DECcent   POSerr    Theta     Phi              Peak Cts       SNR   Name
  289.2450   -17.1145   0.0174    24.5648  -106.0921         1.3105564     11.067 TRIG_00434360

Foreground time interval of the image:
 -2.212  66.224 (delta_t =  68.436 [sec])
Background time interval of the image:
-235.867  -2.212 (delta_t = 233.655 [sec])
Light Curves
Note: The mask-weighted lightcurves have units of either count/det or counts/sec/det, where a det is 0.4 x 0.4 = 0.16 sq cm.
Full-time range; 1 s binning
Other quick-look light curves:
- 64 ms binning (zoomed)
- 16 ms binning (zoomed)
- 8 ms binning (zoomed)
- 2 ms binning (zoomed)
- SN=5 or 10 s binning (full-time range)
- Raw light curve
Spectra
- 64 ms binning (zoomed)
- 16 ms binning (zoomed)
- 8 ms binning (zoomed)
- 2 ms binning (zoomed)
- SN=5 or 10 s binning (full-time range)
- Raw light curve
Spectra
Notes:
- 1) The fitting includes the systematic errors.
- 2) When the burst includes telescope slew time periods, the fitting uses an average response file made from multiple 5-s response files through out the slew time plus single time preiod for the non-slew times, and weighted by the total counts in the corresponding time period using addrmf. An average response file is needed becuase a spectral fit using the pre-slew DRM will introduce some errors in both a spectral shape and a normalization if the PHA file contains a lot of the slew/post-slew time interval.
- 3) For fits to more complicated models (e.g. a power-law over a cutoff power-law), the BAT team has decided to require a chi-square improvement of more than 6 for each extra dof.
Time averaged spectrum fit using the average DRM
Power-law model
Time interval is from   -2.212 sec. to   66.224 sec.

Spectral model in power-law:
------------------------------------------------------------
Parameters  : value       lower 90%   higher 90%
Photon index: -1.61438     ( -0.223454   0.218264 )
Norm@50keV  : 1.33349E-03    ( -0.000166006   0.000162573 )
------------------------------------------------------------
#Fit statistic : Chi-Squared =          69.19 using 59 PHA bins.
# Reduced chi-squared =          1.214 for     57 degrees of freedom
# Null hypothesis probability =   1.290772e-01

Photon flux (15-150 keV)    in 68.44 sec: 0.172137 ( -0.019718  0.019751 ) ph/cm2/s
Energy fluence (15-150 keV)             : 8.52181e-07 ( -1.14124e-07  1.15874e-07 ) ergs/cm2
Cutoff power-law model
Time interval is from   -2.212 sec. to   66.224 sec.
Spectral model in the cutoff power-law:
------------------------------------------------------------
Parameters  : value       lower 90%   higher 90%
Photon index: -1.6216     ( -0.216656   0.22761 )
Epeak [keV] : 9999.34      ( -9999.36 -9999.36 )
Norm@50keV  : 1.33341E-03    ( -0.00133396   0.000698709 )
------------------------------------------------------------
#Fit statistic : Chi-Squared =          69.21 using 59 PHA bins.
# Reduced chi-squared =          1.236 for     56 degrees of freedom
# Null hypothesis probability =   1.105798e-01

Photon flux (15-150 keV)    in 68.44 sec: 0.172143 ( -0.019748  0.019726 ) ph/cm2/s
Energy fluence (15-150 keV)             : 8.59723e-07 ( -1.22057e-07  1.07998e-07 ) ergs/cm2
1-s peak spectrum fit
Power-law model
Time interval is from    3.220 sec. to    4.220 sec.

Spectral model in power-law:
------------------------------------------------------------
Parameters  : value       lower 90%   higher 90%
Photon index: -1.66119     ( -0.595394   0.556308 )
Norm@50keV  : 4.65190E-03    ( -0.00154892   0.00142265 )
------------------------------------------------------------
#Fit statistic : Chi-Squared =          67.17 using 59 PHA bins.
# Reduced chi-squared =          1.178 for     57 degrees of freedom
# Null hypothesis probability =   1.678871e-01

Photon flux (15-150 keV)    in 1 sec: 0.609710 ( -0.167275  0.167349 ) ph/cm2/s
Energy fluence (15-150 keV)             : 4.32205e-08 ( -1.44299e-08  1.51106e-08 ) ergs/cm2
Cutoff power-law model
Time interval is from    3.220 sec. to    4.220 sec.
Spectral model in the cutoff power-law:
------------------------------------------------------------
Parameters  : value       lower 90%   higher 90%
Photon index: -1.69304     (       )
Epeak [keV] : 9999.36      (   )
Norm@50keV  : 4.56002E-03    (     )
------------------------------------------------------------
#Fit statistic : Chi-Squared =          67.19 using 59 PHA bins.
# Reduced chi-squared =          1.200 for     56 degrees of freedom
# Null hypothesis probability =   1.455091e-01

Photon flux (15-150 keV)    in 1 sec: 0.444507 ( -0.271184  0.260128 ) ph/cm2/s
Energy fluence (15-150 keV)             : 0 ( 0  0 ) ergs/cm2
Time-resolved spectra
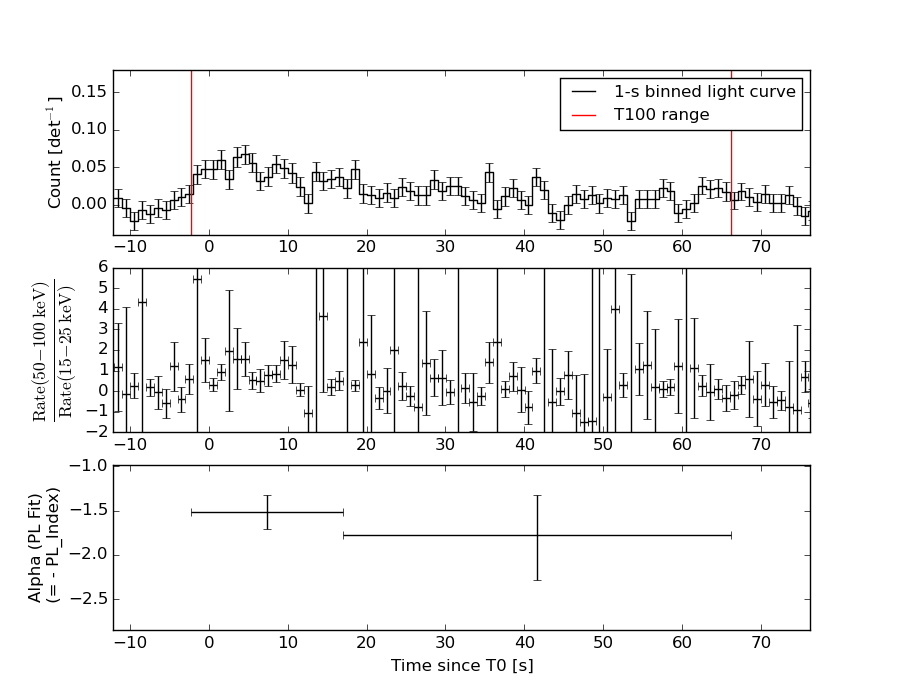
Distribution
T90 vs. Hardness ratio plot
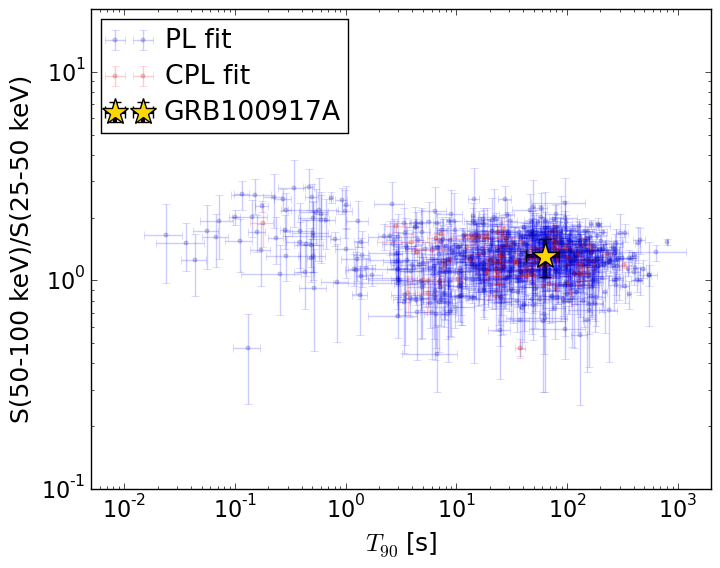
T90                                   = 63.816 sec.
Hardness ratio (energy fluence ratio) = 1.30644121065
S(15-50 keV) vs. S(50-150 keV) plot
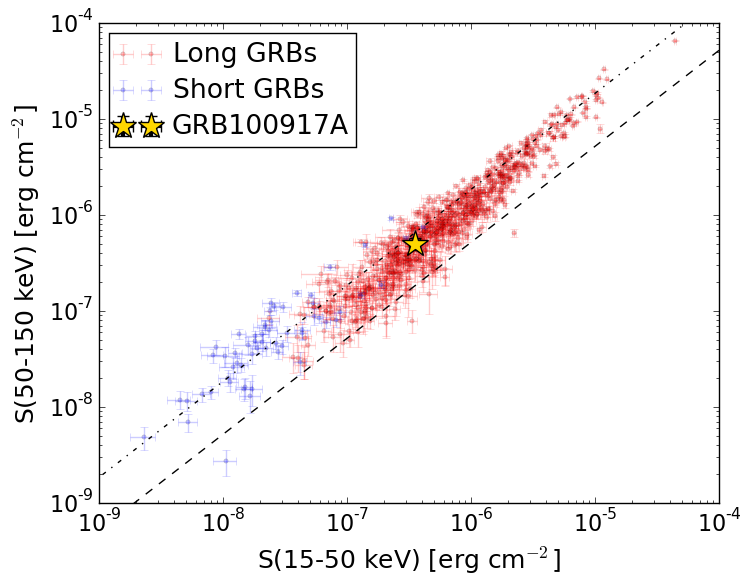
S(15-50 keV)  = 3.520942e-07
S(50-150 keV) = 5.000722e-07
The dash-dotted line and the dashed line traces the fluences calculated from the Band function with Epeak = 15 and 150 keV, respectively. Both lines assume a canonical values of alpha = -1 and beta = -2.5.
Mask shadow pattern
IMX = -1.266979308608149E-01, IMY = 4.391831519623013E-01
Spacecraft aspect plot
Bright source in the pre-burst/pre-slew/post-slew images
Pre-burst image of 15-350 keV band
Time interval of the image:
-235.867400 -2.212000

# RAcent  DECcent POSerr Theta    Phi  PeakCts   SNR AngSep     Name
#  [deg]    [deg]    ['] [deg]  [deg]                   [']
274.0272 -14.0136    4.3  37.7  -92.0   1.7341   2.7    1.9	GX 17+2
276.0136 -30.3329   19.8  41.5 -117.2   0.3574   0.6    5.0	H1820-303
285.2240 -25.0449    0.0  31.8 -116.8   0.2127   0.8   12.7	HT1900.1-2455
288.7660  10.9472    0.7  27.9  -40.0   3.4055  16.6    1.9	GRS 1915+105
299.5792  35.2159    1.1  42.3   -0.7   3.4038  10.9    1.0	Cyg X-1
308.1339  40.9763    2.4  46.6   10.4   1.8993   4.8    1.8	Cyg X-3
326.2122  38.3019    6.8  46.0   30.0  -0.8405  -1.7    2.2	Cyg X-2
336.5629 -12.4908    2.8  25.8  121.1   1.0725   4.2 ------	UNKNOWN
324.4043  -8.7494    2.6  13.3  118.4   0.8089   4.5 ------	UNKNOWN
290.9330 -14.5350    2.2  22.0 -101.8   1.0128   5.3 ------	UNKNOWN
284.3918 -58.4227    3.1  56.8 -149.7   4.6069   3.8 ------	UNKNOWN
279.6944 -52.0846    2.7  53.4 -142.5   4.7737   4.3 ------	UNKNOWN
267.8220  12.6174    2.6  47.0  -53.2   3.5916   4.4 ------	UNKNOWN
Pre-slew background subtracted image of 15-350 keV band
Time interval of the image:
-2.212000 66.224000

# RAcent  DECcent POSerr Theta    Phi  PeakCts   SNR AngSep     Name
#  [deg]    [deg]    ['] [deg]  [deg]                   [']
273.9195 -14.1654    9.3  37.9  -92.2  -0.3408  -1.2    9.2	GX 17+2
275.8492 -30.4828    6.1  41.7 -117.3   0.5206   1.9    8.0	H1820-303
285.0344 -24.9185  284.8  31.8 -116.4   0.0059   0.0    0.1	HT1900.1-2455
288.9059  11.1312    0.0  27.9  -39.5   0.2790   2.6   12.8	GRS 1915+105
299.4669  35.3274    5.3  42.4   -0.7  -0.3202  -2.2    9.7	Cyg X-1
308.2100  41.0543   15.5  46.7   10.4   0.1643   0.7    7.6	Cyg X-3
326.1773  38.2934   22.6  46.0   29.9   0.1293   0.5    1.7	Cyg X-2
289.2450 -17.1145    1.0  24.6 -106.1   1.3100  11.0 ------	UNKNOWN
Post-slew image of 15-350 keV band
Time interval of the image:
406.132600 962.118400

# RAcent  DECcent POSerr Theta    Phi  PeakCts   SNR AngSep     Name
#  [deg]    [deg]    ['] [deg]  [deg]                   [']
326.1441  38.3176    3.1  53.9  170.9   4.7857   3.7    1.3	Cyg X-2
  5.3317  10.4421    2.2  24.3  112.4   1.8464   5.2 ------	UNKNOWN
335.1627  42.4695    2.9  47.3  176.7   2.5543   3.9 ------	UNKNOWN
 47.7265  -0.5283    3.1  30.6    5.8   1.2874   3.7 ------	UNKNOWN
  1.6085  65.9790    2.9  46.3 -145.0   2.8900   4.0 ------	UNKNOWN
 78.7970  24.0798    5.7  47.0  -53.3   3.2475   2.1 ------	UNKNOWN
 70.9249  42.3792    2.7  41.1  -80.0   6.1181   4.3 ------	UNKNOWN
 30.6569  70.8547    2.7  48.2 -129.4   6.1898   4.3 ------	UNKNOWN