Analysis Summary
Notes:
- 1) No attempt has been made to eliminate the non-significant decimal places.
- 2) This batgrbproduct analysis is done using the HEASARC data.
- 3) This batgrbproduct analysis is using the flight position for the mask-weighting calculation.
======================================================================
                  BAT GRB EVENT DATA PROCESSING REPORT
    Process Script Ver: batgrbproduct v2.46
    Process Start Time: Fri Jan 17 15:53:44 EST 2014
             Host Name: batevent1
   Current Working Dir: /local/data/batevent/batevent_reproc/trigger434843
======================================================================

  Trigger: 00434843      Segment: 000

  BAT Trigger Time: 306993495.104   [s; MET]
      Trigger Stop: 306993496.128   [s; MET]
               UTC: 2010-09-24T03:58:08.897460    [includes UTCF correction]
       Where From?: TDRSS position message

  BAT
    RA: 0.671341527158533   Dec: 7.01503025438085  [deg; J2000]

     Catalogged Source?: NO
     Point Source?:      YES
     GRB Indicated?:     YES    [ by BAT flight software ]
     Image S/N Ratio:    12.02
     Image Trigger?:     NO
     Rate S/N Ratio:     40.8900966005217  [ if not an image trigger ]
     Image S/N Ratio:    12.02

  Analysis Position:   [ source = BAT ]
    RA: 0.671341527158533   Dec: 7.01503025438085  [deg; J2000]

  Refined Position:   [ source = BAT pre-slew burst ]
    RA: 0.669313351519286   Dec: 7.00727606825314  [deg; J2000]
        { 00h 02m 40.6s , +07d 00' 26.2" }
         +/- 0.844914524402186 [arcmin] (estimated 90% radius based on SNR)
         +/- 0.314573504768447 [arcmin] (formal 1-sigma fit error)
    SNR: 38.6964885380114

  Angular difference between the analysis and refined position is 0.480673 arcmin

  Partial Coding Fraction: 0.25    [ including projection effects ]

  Duration
     T90: 71.9479999542236 +/- 4.00963842367137
        Measured from: 0.52400004863739
                   to: 72.472000002861     [s; relative to TRIGTIME]
     T50: 20.4719999432564 +/- 1.38575607047419
        Measured from: 36.7120000123978
                   to: 57.1839999556541     [s; relative to TRIGTIME]


  Fluence
     Peak Flux  (peak 1 second)
        Measured from: 44.460000038147
                   to: 45.460000038147     [s; relative to TRIGTIME]
     Total Fluence
        Measured from: -1.75999999046326
                   to: 87.244000017643     [s; relative to TRIGTIME]

             Band 1     Band 2     Band 3     Band 4
              15-25      25-50     50-100    100-350     keV
 Total     3.347469   4.708069   3.659290   0.862588
           0.106221   0.113459   0.103828   0.090683 [error]
 Peak      0.112685   0.183683   0.213813   0.055810
           0.013647   0.015439   0.015646   0.011859 [error]

     [ fluence units of on-axis counts / fully illuminated detector ]

======================================================================


====== Table of the duration information =============================

        Value   tstart    tstop
T100   89.004   -1.760   87.244
T90    71.948    0.524   72.472
T50    20.472   36.712   57.184
Peak    1.000   44.460   45.460


====== Spectral Analysis Summary =====================================

Model      : spectral model: simple power-law (PL) and cutoff power-law (CPL)
Ph_index   : photon index: E^{Ph_index}
Ph_90err   : 90% error of the photon index
Epeak      : Epeak in keV
Epeak_90err: 90% error of Epeak
Norm       : normalization at 50 keV in both the PL model and CPL model
Nomr_90err : 90% error of the normalization
chi2       : Chi-Squared
dof        : degree of freedo

=== Time-averaged spectral analysis ===
(Best model with acceptable fit: PL)

Model Ph_index Ph_90err_low Ph_90err_hi  Epeak  Epeak_90err_low  Epeak_90err_hi  Norm       Nomr_90err_low    Norm_90err_hi    chi2    dof
PL      -1.516    -0.056      0.056       -           -               -         9.58e-03     -2.85e-04          2.85e-04      63.200   57
CPL     -1.243    -0.226      0.238      149.468     -45.387       378.216      1.28e-02     -2.69e-03          3.62e-03      58.890   56


=== 1-s peak spectral analysis ===
(Best model with acceptable fit: PL)

Model Ph_index Ph_90err_low Ph_90err_hi  Epeak  Epeak_90err_low  Epeak_90err_hi  Norm       Nomr_90err_low    Norm_90err_hi    chi2    dof
PL      -1.158     -0.138     0.139       -           -               -         3.80e-02     -3.14e-03          3.14e-03      68.850   57
CPL     -0.473     -0.593     0.684      126.338     -36.945       367.446      7.77e-02     -3.53e-02          7.58e-02      64.900   56


=== Fluence/Peak Flux Summary ===

              Model    Band1     Band2     Band3     Band4     Band5     Total
                       15-25     25-50    50-100    100-350    15-150    15-350    keV
Fluence         PL   1.11e-06  2.01e-06  2.81e-06  8.22e-06  8.07e-06  1.41e-05   erg/cm2
      90%_error_low -6.37e-08 -6.76e-08 -1.06e-07 -6.84e-07 -2.56e-07 -7.49e-07   erg/cm2
      90%_error_hi   6.51e-08  6.74e-08  1.06e-07  7.26e-07  2.57e-07  7.82e-07   erg/cm2
Peak flux       PL   1.13e+00  1.39e+00  1.25e+00  1.94e+00  4.44e+00  5.70e+00   ph/cm2/s
      90%_error_low -1.73e-01 -1.36e-01 -1.17e-01 -3.55e-01 -3.76e-01 -4.98e-01   ph/cm2/s
      90%_error_hi   1.82e-01  1.35e-01  1.16e-01  3.99e-01  3.77e-01  5.05e-01   ph/cm2/s

Fluence        CPL   1.04e-06  2.05e-06  2.87e-06  5.69e-06  7.91e-06  1.16e-05   erg/cm2
      90%_error_low -8.24e-08 -7.41e-08 -1.17e-07 -1.42e-06 -2.87e-07 -1.44e-06   erg/cm2
      90%_error_hi   8.41e-08  7.47e-08  1.19e-07  2.00e-06  2.86e-07  2.00e-06   erg/cm2
Peak flux      CPL   9.51e-01  1.45e+00  1.36e+00  1.06e+00  4.33e+00  4.82e+00   ph/cm2/s
      90%_error_low -2.21e-01 -1.51e-01 -1.50e-01 -4.04e-01 -3.88e-01 -5.79e-01   ph/cm2/s
      90%_error_hi   2.32e-01  1.54e-01  1.54e-01  7.26e-01  3.88e-01  7.93e-01   ph/cm2/s

======================================================================
Image
Pre-slew 15.0-350.0 keV image (Event data)
#   RAcent    DECcent   POSerr    Theta     Phi              Peak Cts       SNR   Name
    0.6693     7.0073   0.0050    33.1059    99.4698        13.2954125     38.696 TRIG_00434843

Foreground time interval of the image:
 -1.760  87.244 (delta_t =  89.004 [sec])
Background time interval of the image:
-239.104  -1.760 (delta_t = 237.344 [sec])
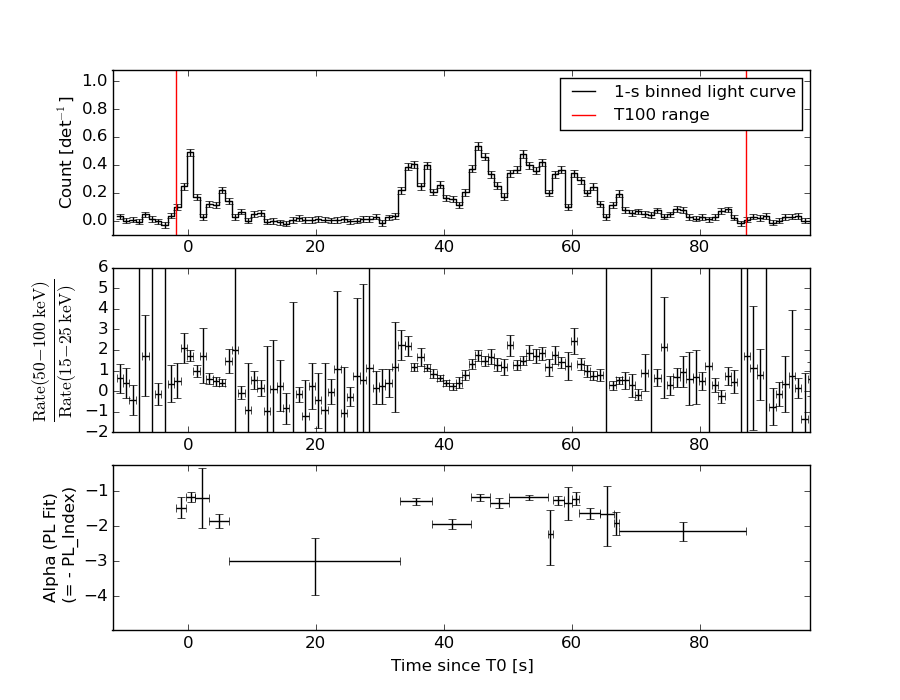
Light Curves
Note: The mask-weighted lightcurves have units of either count/det or counts/sec/det, where a det is 0.4 x 0.4 = 0.16 sq cm.
Full-time range; 1 s binning
Other quick-look light curves:
- 64 ms binning (zoomed)
- 16 ms binning (zoomed)
- 8 ms binning (zoomed)
- 2 ms binning (zoomed)
- SN=5 or 10 s binning (full-time range)
- Raw light curve
Spectra
- 64 ms binning (zoomed)
- 16 ms binning (zoomed)
- 8 ms binning (zoomed)
- 2 ms binning (zoomed)
- SN=5 or 10 s binning (full-time range)
- Raw light curve
Spectra
Notes:
- 1) The fitting includes the systematic errors.
- 2) When the burst includes telescope slew time periods, the fitting uses an average response file made from multiple 5-s response files through out the slew time plus single time preiod for the non-slew times, and weighted by the total counts in the corresponding time period using addrmf. An average response file is needed becuase a spectral fit using the pre-slew DRM will introduce some errors in both a spectral shape and a normalization if the PHA file contains a lot of the slew/post-slew time interval.
- 3) For fits to more complicated models (e.g. a power-law over a cutoff power-law), the BAT team has decided to require a chi-square improvement of more than 6 for each extra dof.
Time averaged spectrum fit using the average DRM
Power-law model
Time interval is from   -1.760 sec. to   87.244 sec.

Spectral model in power-law:
------------------------------------------------------------
Parameters  : value       lower 90%   higher 90%
Photon index: -1.51633     ( -0.056395   0.0562688 )
Norm@50keV  : 9.57661E-03    ( -0.000285061   0.000284991 )
------------------------------------------------------------
#Fit statistic : Chi-Squared =          63.20 using 59 PHA bins.
# Reduced chi-squared =          1.109 for     57 degrees of freedom
# Null hypothesis probability =   2.668113e-01

Photon flux (15-150 keV)    in 89 sec: 1.20089 ( -0.03876  0.03887 ) ph/cm2/s
Energy fluence (15-150 keV)             : 8.06547e-06 ( -2.56032e-07  2.5657e-07 ) ergs/cm2
Cutoff power-law model
Time interval is from   -1.760 sec. to   87.244 sec.
Spectral model in the cutoff power-law:
------------------------------------------------------------
Parameters  : value       lower 90%   higher 90%
Photon index: -1.24266     ( -0.225752   0.237746 )
Epeak [keV] : 149.468      ( -45.3865 378.216 )
Norm@50keV  : 1.28370E-02    ( -0.00269383   0.00361599 )
------------------------------------------------------------
#Fit statistic : Chi-Squared =          58.89 using 59 PHA bins.
# Reduced chi-squared =          1.052 for     56 degrees of freedom
# Null hypothesis probability =   3.703100e-01

Photon flux (15-150 keV)    in 89 sec: 1.17729 ( -0.04294  0.04315 ) ph/cm2/s
Energy fluence (15-150 keV)             : 7.91061e-06 ( -2.87191e-07  2.86293e-07 ) ergs/cm2
1-s peak spectrum fit
Power-law model
Time interval is from   44.460 sec. to   45.460 sec.

Spectral model in power-law:
------------------------------------------------------------
Parameters  : value       lower 90%   higher 90%
Photon index: -1.15815     ( -0.137867   0.138645 )
Norm@50keV  : 3.80065E-02    ( -0.0031388   0.0031382 )
------------------------------------------------------------
#Fit statistic : Chi-Squared =          68.85 using 59 PHA bins.
# Reduced chi-squared =          1.208 for     57 degrees of freedom
# Null hypothesis probability =   1.351358e-01

Photon flux (15-150 keV)    in 1 sec: 4.43670 ( -0.37614  0.37662 ) ph/cm2/s
Energy fluence (15-150 keV)             : 3.90346e-07 ( -3.53692e-08  3.55661e-08 ) ergs/cm2
Cutoff power-law model
Time interval is from   44.460 sec. to   45.460 sec.
Spectral model in the cutoff power-law:
------------------------------------------------------------
Parameters  : value       lower 90%   higher 90%
Photon index: -0.472784     ( -0.5926   0.684067 )
Epeak [keV] : 126.338      ( -36.9441 367.447 )
Norm@50keV  : 7.77472E-02    ( -0.035265   0.0757852 )
------------------------------------------------------------
#Fit statistic : Chi-Squared =          64.90 using 59 PHA bins.
# Reduced chi-squared =          1.159 for     56 degrees of freedom
# Null hypothesis probability =   1.941445e-01

Photon flux (15-150 keV)    in 1 sec: 4.33145 ( -0.38818  0.38781 ) ph/cm2/s
Energy fluence (15-150 keV)             : 3.80487e-07 ( -3.72137e-08  3.70837e-08 ) ergs/cm2
Time-resolved spectra
Distribution
T90 vs. Hardness ratio plot
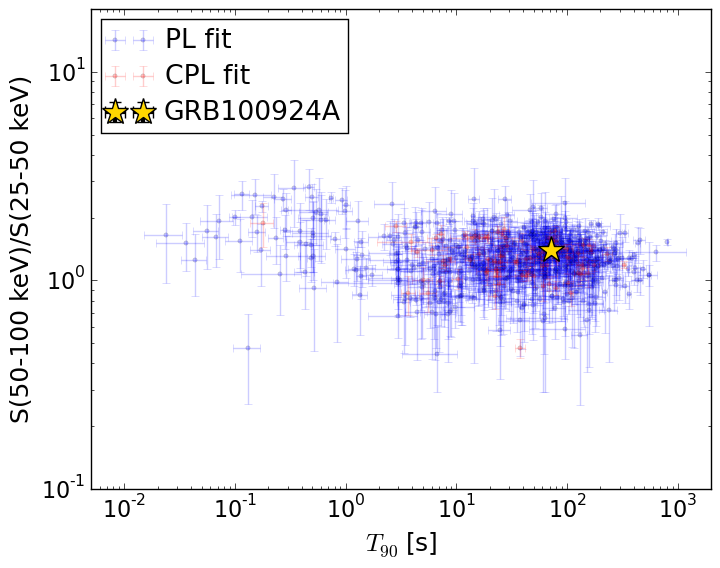
T90                                   = 71.948 sec.
Hardness ratio (energy fluence ratio) = 1.39833068726
S(15-50 keV) vs. S(50-150 keV) plot
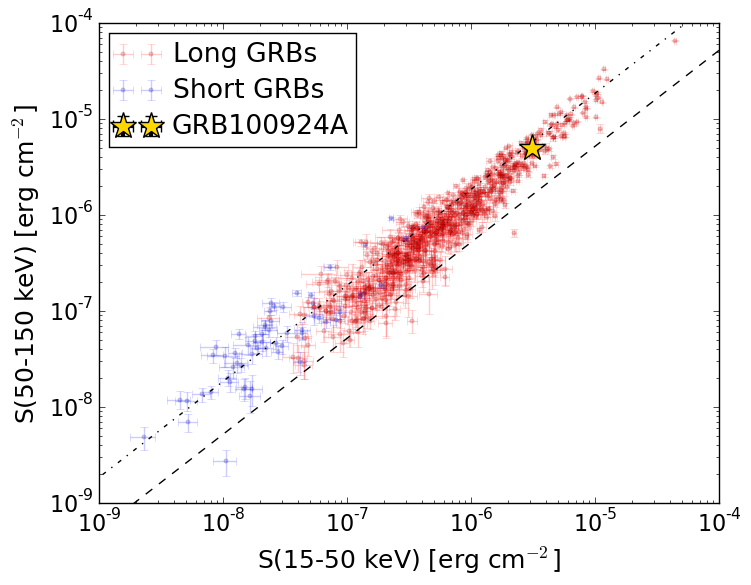
S(15-50 keV)  = 3.115649e-06
S(50-150 keV) = 4.949788e-06
The dash-dotted line and the dashed line traces the fluences calculated from the Band function with Epeak = 15 and 150 keV, respectively. Both lines assume a canonical values of alpha = -1 and beta = -2.5.
Mask shadow pattern
IMX = -1.072788815451070E-01, IMY = -6.431526300249275E-01
Spacecraft aspect plot
Bright source in the pre-burst/pre-slew/post-slew images
Pre-burst image of 15-350 keV band
Time interval of the image:
-239.104000 -1.760000

# RAcent  DECcent POSerr Theta    Phi  PeakCts   SNR AngSep     Name
#  [deg]    [deg]    ['] [deg]  [deg]                   [']
 27.6204  18.1960    2.5  36.6  150.2   1.6195   4.6 ------	UNKNOWN
 49.0951  16.1531    2.2  43.0 -178.9   1.7543   5.1 ------	UNKNOWN
  6.6964 -38.3796    3.1  24.6   -6.8   0.7684   3.7 ------	UNKNOWN
 46.9565 -61.8656    3.4  47.0  -53.2   3.4363   3.5 ------	UNKNOWN
 68.4826 -23.8455    3.1  43.1 -111.9   3.6053   3.7 ------	UNKNOWN
Pre-slew background subtracted image of 15-350 keV band
Time interval of the image:
-1.760000 87.244000

# RAcent  DECcent POSerr Theta    Phi  PeakCts   SNR AngSep     Name
#  [deg]    [deg]    ['] [deg]  [deg]                   [']
  0.6693   7.0073    0.3  33.1   99.5  13.2943  38.6  422.3	UNKNOWN
332.3156 -42.2708    2.5  48.8   11.3   1.7737   4.7 ------	UNKNOWN
 55.3566   8.4278    2.5  41.8 -164.4   0.9411   4.6 ------	UNKNOWN
 17.2799 -69.2963    2.2  51.4  -35.4   1.9615   5.2 ------	UNKNOWN
Post-slew image of 15-350 keV band
Time interval of the image:
-239.104000 962.923400

# RAcent  DECcent POSerr Theta    Phi  PeakCts   SNR AngSep     Name
#  [deg]    [deg]    ['] [deg]  [deg]                   [']
  0.6836   7.0235    1.2  33.1   99.5  13.2552   9.9  423.4	UNKNOWN
 27.6032  18.1972    2.4  36.6  150.2   5.8134   4.8 ------	UNKNOWN
 23.0505  -5.8085    2.5  12.2  144.3   2.8755   4.7 ------	UNKNOWN
  6.7522 -38.4042    2.9  24.6   -6.9   2.6550   4.0 ------	UNKNOWN
 49.0835 -12.1019    2.6  26.2 -137.2   3.0815   4.4 ------	UNKNOWN
343.0727 -63.6274    2.8  52.9  -17.0   6.3085   4.1 ------	UNKNOWN
 47.0214 -61.9174    9.1  47.1  -53.2   4.4454   1.3 ------	UNKNOWN
 71.7804 -11.1619    2.4  48.0 -128.9  14.5686   4.7 ------	UNKNOWN
 72.8954  -6.9589    2.6  50.2 -133.9  16.8347   4.5 ------	UNKNOWN