Analysis Summary
Notes:
- 1) No attempt has been made to eliminate the non-significant decimal places.
- 2) This batgrbproduct analysis is done using the HEASARC data.
- 3) This batgrbproduct analysis is using the flight position for the mask-weighting calculation.
======================================================================
BAT GRB EVENT DATA PROCESSING REPORT
Process Script Ver: batgrbproduct v2.46
Process Start Time: Fri Jan 17 15:50:21 EST 2014
Host Name: batevent1
Current Working Dir: /local/data/batevent/batevent_reproc/trigger435160
======================================================================
Trigger: 00435160 Segment: 000
BAT Trigger Time: 307333198.976 [s; MET]
Trigger Stop: 307333203.072 [s; MET]
UTC: 2010-09-28T02:19:52.757060 [includes UTCF correction]
Where From?: TDRSS position message
BAT
RA: 223.036447846036 Dec: -28.5612167730146 [deg; J2000]
Catalogged Source?: NO
Point Source?: YES
GRB Indicated?: YES [ by BAT flight software ]
Image S/N Ratio: 6.79
Image Trigger?: NO
Rate S/N Ratio: 9.16515138991168 [ if not an image trigger ]
Image S/N Ratio: 6.79
Analysis Position: [ source = BAT ]
RA: 223.036447846036 Dec: -28.5612167730146 [deg; J2000]
Refined Position: [ source = BAT pre-slew burst ]
RA: 223.040691104306 Dec: -28.5441154179116 [deg; J2000]
{ 14h 52m 09.8s , -28d 32' 38.8" }
+/- 2.2353246800407 [arcmin] (estimated 90% radius based on SNR)
+/- 1.35851160532715 [arcmin] (formal 1-sigma fit error)
SNR: 9.63962992433249
Angular difference between the analysis and refined position is 1.050168 arcmin
Partial Coding Fraction: 0.1523438 [ including projection effects ]
Duration
T90: 4.16000002622604 +/- 1.0160944903206
Measured from: 0.0239999890327454
to: 4.18400001525879 [s; relative to TRIGTIME]
T50: 1.9200000166893 +/- 0.754082232309191
Measured from: 1.43199998140335
to: 3.35199999809265 [s; relative to TRIGTIME]
Fluence
Peak Flux (peak 1 second)
Measured from: 1.30799996852875
to: 2.30799996852875 [s; relative to TRIGTIME]
Total Fluence
Measured from: -0.296000003814697
to: 4.42399996519089 [s; relative to TRIGTIME]
Band 1 Band 2 Band 3 Band 4
15-25 25-50 50-100 100-350 keV
Total 0.211116 0.245989 0.185206 0.028495
0.041529 0.035279 0.030190 0.023473 [error]
Peak 0.101767 0.099009 0.059171 0.010502
0.019701 0.017547 0.014402 0.010983 [error]
[ fluence units of on-axis counts / fully illuminated detector ]
======================================================================
====== Table of the duration information =============================
Value tstart tstop
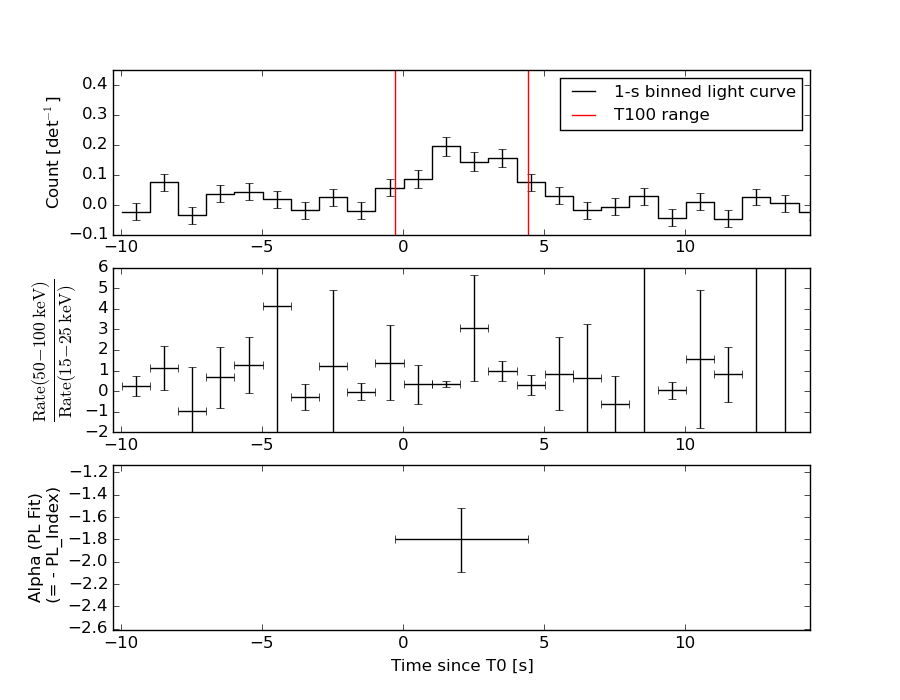
T100 4.720 -0.296 4.424
T90 4.160 0.024 4.184
T50 1.920 1.432 3.352
Peak 1.000 1.308 2.308
====== Spectral Analysis Summary =====================================
Model : spectral model: simple power-law (PL) and cutoff power-law (CPL)
Ph_index : photon index: E^{Ph_index}
Ph_90err : 90% error of the photon index
Epeak : Epeak in keV
Epeak_90err: 90% error of Epeak
Norm : normalization at 50 keV in both the PL model and CPL model
Nomr_90err : 90% error of the normalization
chi2 : Chi-Squared
dof : degree of freedo
=== Time-averaged spectral analysis ===
(Best model with acceptable fit: PL)
Model Ph_index Ph_90err_low Ph_90err_hi Epeak Epeak_90err_low Epeak_90err_hi Norm Nomr_90err_low Norm_90err_hi chi2 dof
PL -1.796 -0.292 0.280 - - - 8.99e-03 -1.52e-03 1.49e-03 55.660 57
CPL -1.365 -0.895 1.287 73.317 N/A N/A 1.48e-02 N/A N/A 55.200 56
=== 1-s peak spectral analysis ===
(Best model with acceptable fit: PL)
Model Ph_index Ph_90err_low Ph_90err_hi Epeak Epeak_90err_low Epeak_90err_hi Norm Nomr_90err_low Norm_90err_hi chi2 dof
PL -2.117 -0.407 0.362 - - - 1.52e-02 -3.79e-03 3.57e-03 65.630 57
CPL -1.994 -0.020 0.303 4.277 N/A N/A 1.69e-02 N/A N/A 65.790 56
=== Fluence/Peak Flux Summary ===
Model Band1 Band2 Band3 Band4 Band5 Total
15-25 25-50 50-100 100-350 15-150 15-350 keV
Fluence PL 7.16e-08 1.10e-07 1.26e-07 2.79e-07 3.91e-07 5.87e-07 erg/cm2
90%_error_low -1.80e-08 -1.78e-08 -2.82e-08 -1.12e-07 -6.65e-08 -1.41e-07 erg/cm2
90%_error_hi 1.94e-08 1.77e-08 2.80e-08 1.51e-07 6.72e-08 1.69e-07 erg/cm2
Peak flux PL 1.14e+00 7.97e-01 3.67e-01 2.37e-01 2.42e+00 2.54e+00 ph/cm2/s
90%_error_low -3.19e-01 -1.52e-01 -1.17e-01 -1.21e-01 -4.72e-01 -4.85e-01 ph/cm2/s
90%_error_hi 3.41e-01 1.52e-01 1.18e-01 1.75e-01 4.73e-01 4.85e-01 ph/cm2/s
Fluence CPL 6.64e-08 1.15e-07 1.30e-07 1.55e-07 3.80e-07 4.66e-07 erg/cm2
90%_error_low -2.19e-08 -1.97e-08 -3.02e-08 -1.15e-07 -7.17e-08 -1.41e-07 erg/cm2
90%_error_hi 2.27e-08 2.19e-08 3.13e-08 2.73e-07 7.19e-08 1.85e-07 erg/cm2
Peak flux CPL 1.10e+00 6.83e-01 3.76e-01 2.28e-01 2.39e+00 2.50e+00 ph/cm2/s
90%_error_low -3.18e-01 -3.94e-01 -1.21e-01 N/A -4.54e-01 -4.93e-01 ph/cm2/s
90%_error_hi 2.98e-01 1.56e-01 1.12e-01 N/A 4.64e-01 5.08e-01 ph/cm2/s
======================================================================
Image
Pre-slew 15.0-350.0 keV image (Event data)
#   RAcent    DECcent   POSerr    Theta     Phi              Peak Cts       SNR   Name
  223.0407   -28.5441   0.0199    37.7504   -93.1662         0.6932722      9.640 TRIG_00435160

Foreground time interval of the image:
 -0.296   4.424 (delta_t =   4.720 [sec])
Background time interval of the image:
-239.976  -0.296 (delta_t = 239.680 [sec])
Light Curves
Note: The mask-weighted lightcurves have units of either count/det or counts/sec/det, where a det is 0.4 x 0.4 = 0.16 sq cm.
Full-time range; 1 s binning
Other quick-look light curves:
- 64 ms binning (zoomed)
- 16 ms binning (zoomed)
- 8 ms binning (zoomed)
- 2 ms binning (zoomed)
- SN=5 or 10 s binning (full-time range)
- Raw light curve
Spectra
- 64 ms binning (zoomed)
- 16 ms binning (zoomed)
- 8 ms binning (zoomed)
- 2 ms binning (zoomed)
- SN=5 or 10 s binning (full-time range)
- Raw light curve
Spectra
Notes:
- 1) The fitting includes the systematic errors.
- 2) When the burst includes telescope slew time periods, the fitting uses an average response file made from multiple 5-s response files through out the slew time plus single time preiod for the non-slew times, and weighted by the total counts in the corresponding time period using addrmf. An average response file is needed becuase a spectral fit using the pre-slew DRM will introduce some errors in both a spectral shape and a normalization if the PHA file contains a lot of the slew/post-slew time interval.
- 3) For fits to more complicated models (e.g. a power-law over a cutoff power-law), the BAT team has decided to require a chi-square improvement of more than 6 for each extra dof.
Time averaged spectrum fit using the average DRM
Power-law model
Time interval is from   -0.296 sec. to    4.424 sec.

Spectral model in power-law:
------------------------------------------------------------
Parameters  : value       lower 90%   higher 90%
Photon index: -1.796     ( -0.292341   0.279759 )
Norm@50keV  : 8.98611E-03    ( -0.00152014   0.00149413 )
------------------------------------------------------------
#Fit statistic : Chi-Squared =          55.66 using 59 PHA bins.
# Reduced chi-squared =         0.9766 for     57 degrees of freedom
# Null hypothesis probability =   5.253008e-01

Photon flux (15-150 keV)    in 4.72 sec: 1.23642 ( -0.20395  0.20523 ) ph/cm2/s
Energy fluence (15-150 keV)             : 3.90582e-07 ( -6.64722e-08  6.7193e-08 ) ergs/cm2
Cutoff power-law model

Time interval is from   -0.296 sec. to    4.424 sec.
Spectral model in the cutoff power-law:
------------------------------------------------------------
Parameters  : value       lower 90%   higher 90%
Photon index: -1.36513     ( -0.894858   1.28689 )
Epeak [keV] : 73.3168      (   )
Norm@50keV  : 1.48491E-02    (     )
------------------------------------------------------------
#Fit statistic : Chi-Squared =          55.20 using 59 PHA bins.
# Reduced chi-squared =         0.9857 for     56 degrees of freedom
# Null hypothesis probability =   5.052289e-01

Photon flux (15-150 keV)    in 4.72 sec: 1.20844 ( -0.215386  0.2161 ) ph/cm2/s
Energy fluence (15-150 keV)             : 3.79972e-07 ( -7.16874e-08  7.19271e-08 ) ergs/cm2
1-s peak spectrum fit
Power-law model
Time interval is from    1.308 sec. to    2.308 sec.

Spectral model in power-law:
------------------------------------------------------------
Parameters  : value       lower 90%   higher 90%
Photon index: -2.11738     ( -0.40695   0.361959 )
Norm@50keV  : 1.52299E-02    ( -0.00378566   0.00356866 )
------------------------------------------------------------
#Fit statistic : Chi-Squared =          65.63 using 59 PHA bins.
# Reduced chi-squared =          1.151 for     57 degrees of freedom
# Null hypothesis probability =   2.024868e-01

Photon flux (15-150 keV)    in 1 sec: 2.41703 ( -0.47184  0.4732 ) ph/cm2/s
Energy fluence (15-150 keV)             : 1.41775e-07 ( -3.06479e-08  3.12226e-08 ) ergs/cm2
Cutoff power-law model

Time interval is from    1.308 sec. to    2.308 sec.
Spectral model in the cutoff power-law:
------------------------------------------------------------
Parameters  : value       lower 90%   higher 90%
Photon index: -2.21887     ( -0.0154569   0.308116 )
Epeak [keV] : 100.907      (   )
Norm@50keV  : 1.31297E-02    (     )
------------------------------------------------------------
#Fit statistic : Chi-Squared =          65.51 using 59 PHA bins.
# Reduced chi-squared =          1.170 for     56 degrees of freedom
# Null hypothesis probability =   1.802688e-01

Photon flux (15-150 keV)    in 1 sec: 2.39182 ( -0.45365  0.46366 ) ph/cm2/s
Energy fluence (15-150 keV)             : 0 ( 0  0 ) ergs/cm2
Time-resolved spectra
Distribution
T90 vs. Hardness ratio plot
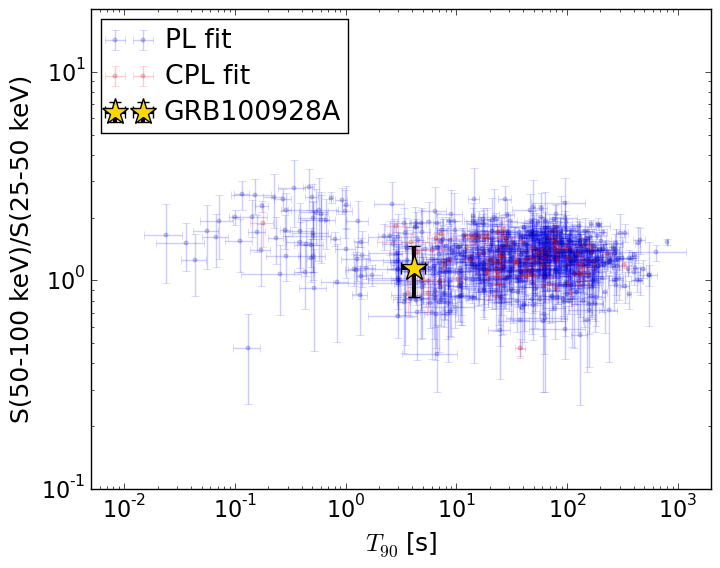
T90                                   = 4.16 sec.
Hardness ratio (energy fluence ratio) = 1.1519408082
S(15-50 keV) vs. S(50-150 keV) plot
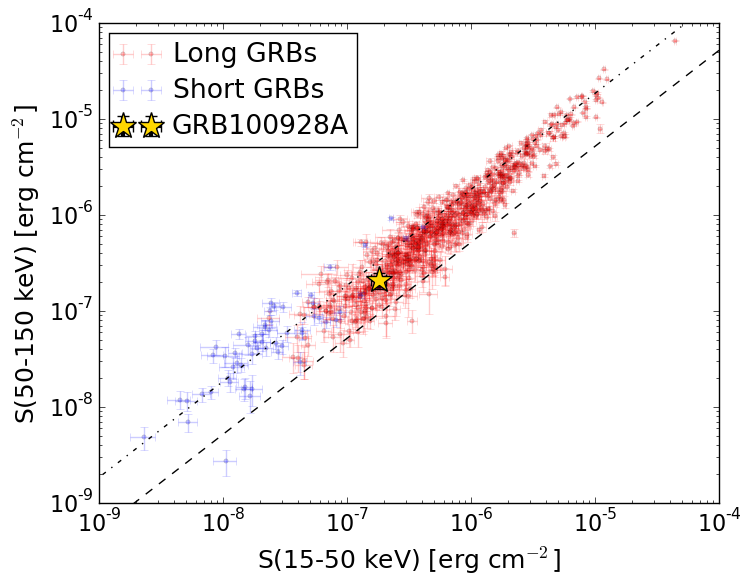
S(15-50 keV)  = 1.8136784e-07
S(50-150 keV) = 2.092197e-07
The dash-dotted line and the dashed line traces the fluences calculated from the Band function with Epeak = 15 and 150 keV, respectively. Both lines assume a canonical values of alpha = -1 and beta = -2.5.
Mask shadow pattern
IMX = -4.276569109937540E-02, IMY = 7.731133110912413E-01
Spacecraft aspect plot
Bright source in the pre-burst/pre-slew/post-slew images
Pre-burst image of 15-350 keV band
Time interval of the image:
-239.976000 -0.296000

# RAcent  DECcent POSerr Theta    Phi  PeakCts   SNR AngSep     Name
#  [deg]    [deg]    ['] [deg]  [deg]                   [']
244.9807 -15.6401    0.2  23.8  -53.5  19.0889  64.5    0.1	Sco X-1
256.0314 -37.8528    2.6  12.4 -131.6   1.0480   4.4    2.2	4U 1700-377
256.4620 -36.5639    5.7  11.3 -128.0   0.4938   2.0    8.5	GX 349+2
262.9601 -24.8325    2.3   5.1  -29.9   1.3442   5.0    5.9	GX 1+4
264.9459 -44.4436    7.4  15.5 -169.2   0.3839   1.6    8.7	4U 1735-44
268.3181  -1.3918    8.4  27.6   11.3   0.3944   1.4    4.7	SW J1753.5-0127
270.3268 -25.1037    1.8   5.2   50.5   1.6617   6.4    2.7	GX 5-1
270.1325 -25.7336   11.5   4.7   54.1   0.2707   1.0    9.2	GRS 1758-258
273.8679 -14.1119    3.3  16.4   33.8   0.8361   3.5    9.2	GX 17+2
275.8055 -30.2931    3.4   8.3  108.6   0.7774   3.4    7.6	H1820-303
285.0174 -24.9097    4.7  17.1   87.7   0.7167   2.4    1.2	HT1900.1-2455
288.7237  10.9681    4.0  45.4   38.7   3.0160   2.9    4.6	GRS 1915+105
263.1712 -33.8457    4.0   5.6 -144.7   0.7088   2.9    9.1	GX 354-0
304.7948 -20.3337    3.1  35.8   92.0   2.5275   3.8 ------	UNKNOWN
291.6036   4.2096    3.7  41.1   47.4   2.2286   3.1 ------	UNKNOWN
276.9072  23.0713    3.1  53.0   19.2   4.9102   3.8 ------	UNKNOWN
260.7846  -7.9141    3.4  21.7   -8.0   0.8955   3.4 ------	UNKNOWN
259.9297   2.5618    2.9  32.1   -5.1   1.1716   3.9 ------	UNKNOWN
254.7720 -15.2594    2.1  17.4  -33.4   1.3418   5.5 ------	UNKNOWN
238.6787 -17.1476    2.6  28.0  -64.1   1.3550   4.4 ------	UNKNOWN
200.5701 -76.0101    2.8  56.2 -157.6   4.5168   4.1 ------	UNKNOWN
	UNKNOWN
	UNKNOWN
Pre-slew background subtracted image of 15-350 keV band
Time interval of the image:
-0.296000 4.424000

# RAcent  DECcent POSerr Theta    Phi  PeakCts   SNR AngSep     Name
#  [deg]    [deg]    ['] [deg]  [deg]                   [']
245.1403 -15.4947    0.0  23.7  -52.9  -0.0250  -0.9   12.8	Sco X-1
255.9856 -37.8433   42.5  12.4 -131.5  -0.0065  -0.3    0.1	4U 1700-377
256.4273 -36.4391  523.8  11.2 -127.4  -0.0005  -0.0    1.0	GX 349+2
263.0119 -24.7997    4.9   5.1  -29.3  -0.0539  -2.3    3.3	GX 1+4
264.7456 -44.5926   10.6  15.7 -168.7   0.0260   1.1    8.6	4U 1735-44
268.2582  -1.6150    0.0  27.4   11.2   0.0138   0.5   11.8	SW J1753.5-0127
270.4239 -25.0439    4.0   5.3   50.8  -0.0680  -2.9    7.9	GX 5-1
270.1637 -25.9136    0.0   4.6   55.9  -0.0321  -1.4   12.7	GRS 1758-258
273.8862 -14.2041    0.0  16.3   33.9  -0.0254  -1.0   12.2	GX 17+2
275.7755 -30.4843    4.9   8.3  109.9  -0.0549  -2.4   10.5	H1820-303
285.2247 -24.9747    6.4  17.3   88.1   0.0479   1.8   10.8	HT1900.1-2455
288.7801  10.9892   32.2  45.4   38.8   0.0280   0.4    2.8	GRS 1915+105
262.7931 -33.6990    0.0   5.6 -141.2   0.0277   1.2   12.7	GX 354-0
323.2582 -66.9999    2.1  50.8  162.0   0.4512   5.5 ------	UNKNOWN
244.8260   7.8783    2.2  42.3  -25.6   0.2059   5.1 ------	UNKNOWN
242.3410  12.7093    3.0  47.7  -25.4   0.1884   3.9 ------	UNKNOWN
202.1438 -66.4913    1.9  53.4 -146.4   0.6533   6.1 ------	UNKNOWN
223.0407 -28.5441    1.2  37.8  -93.2   0.6936   9.6 ------	UNKNOWN
Post-slew image of 15-350 keV band
Time interval of the image:
569.324600 962.107000

# RAcent  DECcent POSerr Theta    Phi  PeakCts   SNR AngSep     Name
#  [deg]    [deg]    ['] [deg]  [deg]                   [']
186.4988 -62.9671    7.8  52.8 -146.8   2.5086   1.5   12.6	GX 301-2
244.9743 -15.6430    0.1  21.7  -38.4  36.3166  82.5    0.3	Sco X-1
256.0214 -37.8636    2.7   5.1 -154.0   1.8603   4.3    2.0	4U 1700-377
256.4895 -36.5418    2.2   3.7 -149.8   2.1679   5.2    7.6	GX 349+2
262.9703 -24.6762    1.9   9.4   24.1   2.6176   6.0    4.7	GX 1+4
264.7525 -44.5995   15.2  12.2  159.8   0.3091   0.8    9.0	4U 1735-44
268.2820  -1.3458    7.0  33.2   17.7   0.9272   1.6    8.2	SW J1753.5-0127
270.2904 -25.1044    1.8  12.9   53.8   2.7355   6.3    1.6	GX 5-1
270.1382 -25.7595   18.1  12.4   55.6   0.2764   0.6    8.9	GRS 1758-258
274.0340 -14.0549    4.4  23.7   39.5   1.4044   2.6    2.0	GX 17+2
275.7913 -30.5323    4.6  14.7   83.9   1.0927   2.5   12.1	H1820-303
285.0253 -24.9397   48.3  24.3   77.0   0.1453   0.2    1.3	HT1900.1-2455
262.8164 -33.9908    0.0   3.4  102.7  -0.3888  -0.9   12.7	GX 354-0
319.9488 -58.1420    3.1  47.2  141.2   6.8962   3.8 ------	UNKNOWN
272.3427   9.4346    2.7  44.7   19.4   4.0009   4.3 ------	UNKNOWN
267.9651   8.1644    2.2  42.4   13.7   3.5976   5.2 ------	UNKNOWN
254.7977 -15.2489    2.0  18.4  -12.1   2.4478   5.8 ------	UNKNOWN
244.2718 -12.2512    2.0  24.9  -35.4   2.4867   5.7 ------	UNKNOWN
235.3069 -38.6201    2.0  19.7 -112.1   2.6759   5.9 ------	UNKNOWN
185.5249 -63.3040    2.2  53.2 -147.3   8.9257   5.2 ------	UNKNOWN
222.7737  -0.6993    3.2  47.0  -53.3   7.5822   3.6 ------	UNKNOWN