Analysis Summary
Notes:
- 1) No attempt has been made to eliminate the non-significant decimal places.
- 2) This batgrbproduct analysis is done using the HEASARC data.
- 3) This batgrbproduct analysis is using the flight position for the mask-weighting calculation.
======================================================================
BAT GRB EVENT DATA PROCESSING REPORT
Process Script Ver: batgrbproduct v2.46
Process Start Time: Fri Jan 17 15:46:51 EST 2014
Host Name: batevent1
Current Working Dir: /local/data/batevent/batevent_reproc/trigger435903
======================================================================
Trigger: 00435903 Segment: 000
BAT Trigger Time: 308249001.472 [s; MET]
Trigger Stop: 308249002.496 [s; MET]
UTC: 2010-10-08T16:43:15.219700 [includes UTCF correction]
Where From?: TDRSS position message
BAT
RA: 328.890606987462 Dec: 37.0622663135631 [deg; J2000]
Catalogged Source?: NO
Point Source?: YES
GRB Indicated?: YES [ by BAT flight software ]
Image S/N Ratio: 10.7
Image Trigger?: NO
Rate S/N Ratio: 21.1660104885167 [ if not an image trigger ]
Image S/N Ratio: 10.7
Analysis Position: [ source = BAT ]
RA: 328.890606987462 Dec: 37.0622663135631 [deg; J2000]
Refined Position: [ source = BAT pre-slew burst ]
RA: 328.880601859487 Dec: 37.0608694077223 [deg; J2000]
{ 21h 55m 31.3s , +37d 03' 39.1" }
+/- 2.17815564950326 [arcmin] (estimated 90% radius based on SNR)
+/- 0.945139580547429 [arcmin] (formal 1-sigma fit error)
SNR: 10.0030910427774
Angular difference between the analysis and refined position is 0.486316 arcmin
Partial Coding Fraction: 0.5859375 [ including projection effects ]
Duration
T90: 103.504000067711 +/- 34.0406796967367
Measured from: -1.83200001716614
to: 101.672000050545 [s; relative to TRIGTIME]
T50: 44.2080000042915 +/- 21.4434206146522
Measured from: 0.504000008106232
to: 44.7120000123978 [s; relative to TRIGTIME]
Fluence
Peak Flux (peak 1 second)
Measured from: -0.435999989509583
to: 0.564000010490417 [s; relative to TRIGTIME]
Total Fluence
Measured from: -3.11199998855591
to: 106.055999994278 [s; relative to TRIGTIME]
Band 1 Band 2 Band 3 Band 4
15-25 25-50 50-100 100-350 keV
Total 0.562625 0.533550 0.549527 0.163251
0.076076 0.078647 0.070757 0.064640 [error]
Peak 0.040507 0.065158 0.060760 0.038922
0.007849 0.008805 0.008122 0.007222 [error]
[ fluence units of on-axis counts / fully illuminated detector ]
======================================================================
====== Table of the duration information =============================
Value tstart tstop
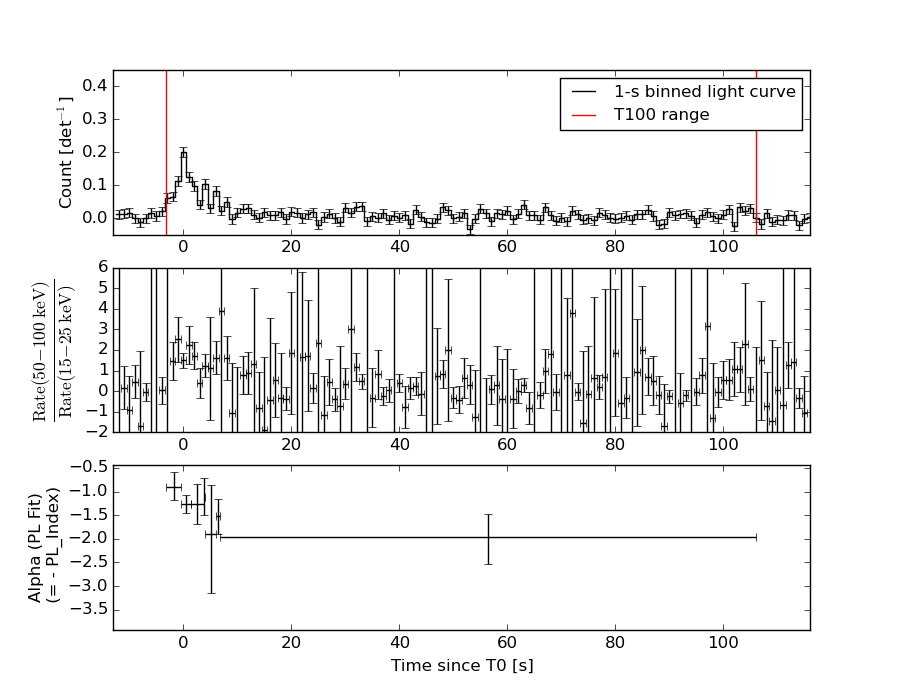
T100 109.168 -3.112 106.056
T90 103.504 -1.832 101.672
T50 44.208 0.504 44.712
Peak 1.000 -0.436 0.564
====== Spectral Analysis Summary =====================================
Model : spectral model: simple power-law (PL) and cutoff power-law (CPL)
Ph_index : photon index: E^{Ph_index}
Ph_90err : 90% error of the photon index
Epeak : Epeak in keV
Epeak_90err: 90% error of Epeak
Norm : normalization at 50 keV in both the PL model and CPL model
Nomr_90err : 90% error of the normalization
chi2 : Chi-Squared
dof : degree of freedo
=== Time-averaged spectral analysis ===
(Best model with acceptable fit: PL)
Model Ph_index Ph_90err_low Ph_90err_hi Epeak Epeak_90err_low Epeak_90err_hi Norm Nomr_90err_low Norm_90err_hi chi2 dof
PL -1.554 -0.245 0.240 - - - 1.12e-03 -1.51e-04 1.49e-04 61.490 57
CPL -1.551 -0.248 0.323 9999.350 -9999.350 -9999.350 1.12e-03 -1.12e-03 1.16e-03 61.500 56
=== 1-s peak spectral analysis ===
(Best model with acceptable fit: PL)
Model Ph_index Ph_90err_low Ph_90err_hi Epeak Epeak_90err_low Epeak_90err_hi Norm Nomr_90err_low Norm_90err_hi chi2 dof
PL -1.231 -0.246 0.251 - - - 1.33e-02 -1.78e-03 1.78e-03 56.710 57
CPL -1.236 -1.406 0.312 9999.340 N/A N/A 1.34e-02 N/A N/A 56.730 56
=== Fluence/Peak Flux Summary ===
Model Band1 Band2 Band3 Band4 Band5 Total
15-25 25-50 50-100 100-350 15-150 15-350 keV
Fluence PL 1.65e-07 2.93e-07 3.99e-07 1.12e-06 1.15e-06 1.98e-06 erg/cm2
90%_error_low -3.64e-08 -3.99e-08 -7.19e-08 -3.84e-07 -1.68e-07 -4.48e-07 erg/cm2
90%_error_hi 3.87e-08 3.94e-08 7.08e-08 5.00e-07 1.70e-07 5.40e-07 erg/cm2
Peak flux PL 4.24e-01 5.01e-01 4.26e-01 6.17e-01 1.57e+00 1.97e+00 ph/cm2/s
90%_error_low -1.10e-01 -8.21e-02 -6.70e-02 -1.88e-01 -2.19e-01 -2.73e-01 ph/cm2/s
90%_error_hi 1.20e-01 7.98e-02 6.56e-02 2.36e-01 2.20e-01 2.78e-01 ph/cm2/s
Fluence CPL 1.67e-07 2.88e-07 3.95e-07 1.22e-06 1.16e-06 1.95e-06 erg/cm2
90%_error_low N/A -4.53e-08 -8.15e-08 -7.81e-07 -2.10e-07 -6.83e-07 erg/cm2
90%_error_hi N/A 5.57e-08 8.78e-08 1.50e-07 1.98e-07 5.41e-07 erg/cm2
Peak flux CPL 4.24e-01 5.01e-01 4.26e-01 6.13e-01 1.57e+00 1.98e+00 ph/cm2/s
90%_error_low N/A -8.23e-02 N/A N/A -2.19e-01 -3.62e-01 ph/cm2/s
90%_error_hi N/A 7.96e-02 N/A N/A 2.20e-01 2.65e-01 ph/cm2/s
======================================================================
Image
Pre-slew 15.0-350.0 keV image (Event data)
#   RAcent    DECcent   POSerr    Theta     Phi              Peak Cts       SNR   Name
  328.8806    37.0609   0.0193    39.6702  -162.7117         1.8183116     10.003 TRIG_00435903

Foreground time interval of the image:
 -3.112 106.056 (delta_t = 109.168 [sec])
Background time interval of the image:
-210.971  -3.112 (delta_t = 207.859 [sec])
Light Curves
Note: The mask-weighted lightcurves have units of either count/det or counts/sec/det, where a det is 0.4 x 0.4 = 0.16 sq cm.
Full-time range; 1 s binning
Other quick-look light curves:
- 64 ms binning (zoomed)
- 16 ms binning (zoomed)
- 8 ms binning (zoomed)
- 2 ms binning (zoomed)
- SN=5 or 10 s binning (full-time range)
- Raw light curve
Spectra
- 64 ms binning (zoomed)
- 16 ms binning (zoomed)
- 8 ms binning (zoomed)
- 2 ms binning (zoomed)
- SN=5 or 10 s binning (full-time range)
- Raw light curve
Spectra
Notes:
- 1) The fitting includes the systematic errors.
- 2) When the burst includes telescope slew time periods, the fitting uses an average response file made from multiple 5-s response files through out the slew time plus single time preiod for the non-slew times, and weighted by the total counts in the corresponding time period using addrmf. An average response file is needed becuase a spectral fit using the pre-slew DRM will introduce some errors in both a spectral shape and a normalization if the PHA file contains a lot of the slew/post-slew time interval.
- 3) For fits to more complicated models (e.g. a power-law over a cutoff power-law), the BAT team has decided to require a chi-square improvement of more than 6 for each extra dof.
Time averaged spectrum fit using the average DRM
Power-law model

Time interval is from   -3.112 sec. to  106.056 sec.

Spectral model in power-law:
------------------------------------------------------------
Parameters  : value       lower 90%   higher 90%
Photon index: -1.55366     ( -0.245279   0.240242 )
Norm@50keV  : 1.12222E-03    ( -0.000151177   0.000149357 )
------------------------------------------------------------
#Fit statistic : Chi-Squared =          61.49 using 59 PHA bins.
# Reduced chi-squared =          1.079 for     57 degrees of freedom
# Null hypothesis probability =   3.184796e-01

Photon flux (15-150 keV)    in 109.2 sec: 0.142221 ( -0.018821  0.018904 ) ph/cm2/s
Energy fluence (15-150 keV)             : 1.15322e-06 ( -1.68226e-07  1.70065e-07 ) ergs/cm2
Cutoff power-law model
Time interval is from   -3.112 sec. to  106.056 sec.
Spectral model in the cutoff power-law:
------------------------------------------------------------
Parameters  : value       lower 90%   higher 90%
Photon index: -1.55078     ( -0.248064   0.322967 )
Epeak [keV] : 9999.35      ( -9999.36 -9999.36 )
Norm@50keV  : 1.12359E-03    ( -0.00112525   0.00116239 )
------------------------------------------------------------
#Fit statistic : Chi-Squared =          61.50 using 59 PHA bins.
# Reduced chi-squared =          1.098 for     56 degrees of freedom
# Null hypothesis probability =   2.857921e-01

Photon flux (15-150 keV)    in 109.2 sec: 0.142219 ( -0.01886  0.018878 ) ph/cm2/s
Energy fluence (15-150 keV)             : 1.15999e-06 ( -2.09662e-07  1.98083e-07 ) ergs/cm2
1-s peak spectrum fit
Power-law model

Time interval is from   -0.436 sec. to    0.564 sec.

Spectral model in power-law:
------------------------------------------------------------
Parameters  : value       lower 90%   higher 90%
Photon index: -1.23147     ( -0.245548   0.25076 )
Norm@50keV  : 1.33153E-02    ( -0.00177922   0.00177891 )
------------------------------------------------------------
#Fit statistic : Chi-Squared =          56.71 using 59 PHA bins.
# Reduced chi-squared =         0.9949 for     57 degrees of freedom
# Null hypothesis probability =   4.859084e-01

Photon flux (15-150 keV)    in 1 sec: 1.57023 ( -0.21886  0.21997 ) ph/cm2/s
Energy fluence (15-150 keV)             : 1.33934e-07 ( -1.9704e-08  1.98283e-08 ) ergs/cm2
Cutoff power-law model
Time interval is from   -0.436 sec. to    0.564 sec.
Spectral model in the cutoff power-law:
------------------------------------------------------------
Parameters  : value       lower 90%   higher 90%
Photon index: -2.12081     ( -0.521615   1.19686 )
Epeak [keV] : 44.2349      (   )
Norm@50keV  : 3.42254E-03    (     )
------------------------------------------------------------
#Fit statistic : Chi-Squared =          55.30 using 59 PHA bins.
# Reduced chi-squared =         0.9876 for     56 degrees of freedom
# Null hypothesis probability =   5.011318e-01

Photon flux (15-150 keV)    in 1 sec: 1.56998 ( -0.21924  0.21976 ) ph/cm2/s
Energy fluence (15-150 keV)             : 1.34589e-07 ( -2.74938e-08  2.63421e-08 ) ergs/cm2
Time-resolved spectra
Distribution
T90 vs. Hardness ratio plot
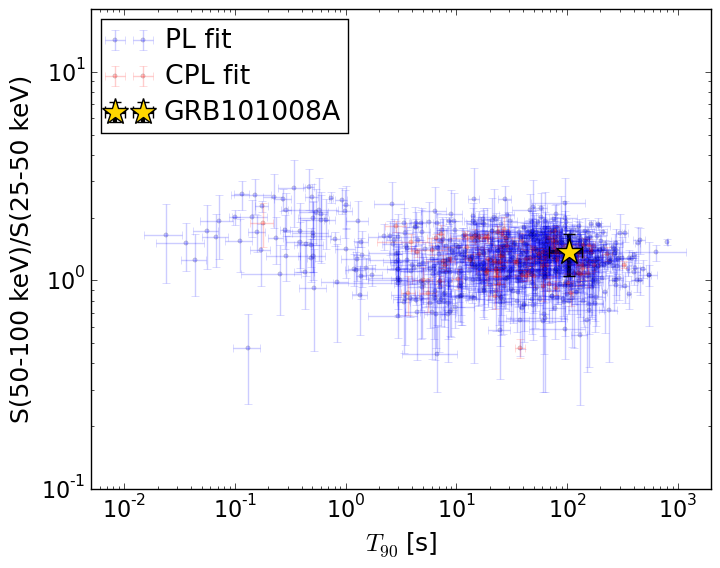
T90                                   = 103.504 sec.
Hardness ratio (energy fluence ratio) = 1.36260509098
S(15-50 keV) vs. S(50-150 keV) plot
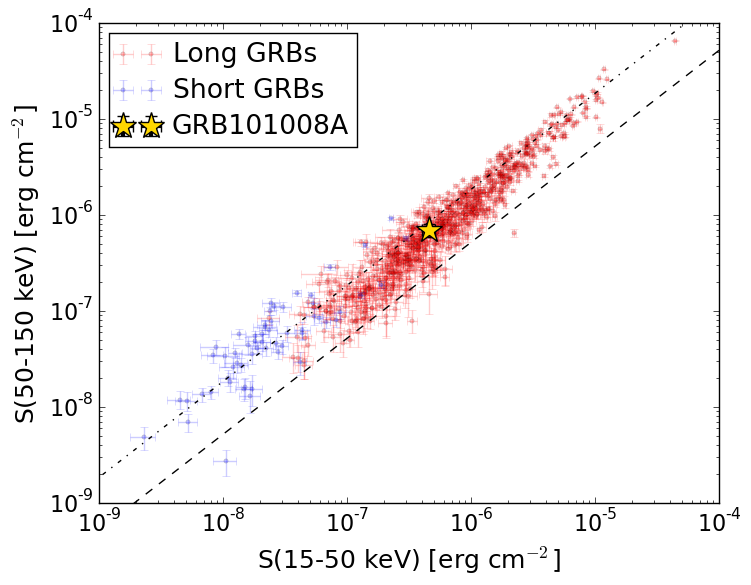
S(15-50 keV)  = 4.571987e-07
S(50-150 keV) = 6.960228e-07
The dash-dotted line and the dashed line traces the fluences calculated from the Band function with Epeak = 15 and 150 keV, respectively. Both lines assume a canonical values of alpha = -1 and beta = -2.5.
Mask shadow pattern
IMX = -7.918702745295987E-01, IMY = 2.464628093905808E-01
Spacecraft aspect plot
Bright source in the pre-burst/pre-slew/post-slew images
Pre-burst image of 15-350 keV band
Time interval of the image:
-210.971400 -3.112000

# RAcent  DECcent POSerr Theta    Phi  PeakCts   SNR AngSep     Name
#  [deg]    [deg]    ['] [deg]  [deg]                   [']
 83.6189  21.9961    1.5  56.0    4.0   6.9833   7.5    1.4	Crab
308.0504  40.9378    5.5  53.1 -149.1   1.2270   2.1    2.9	Cyg X-3
326.2265  38.2847    4.3  41.2 -159.8   0.7004   2.7    3.4	Cyg X-2
 41.3345   4.2020    2.2  40.9   61.9   3.1831   5.2 ------	UNKNOWN
 90.1243  45.5032    3.7  49.7  -25.4   1.1650   3.1 ------	UNKNOWN
101.8581  42.4079    2.7  58.7  -26.2   5.3097   4.4 ------	UNKNOWN
336.7820  77.3938    3.8  41.1  -98.2   2.7380   3.0 ------	UNKNOWN
Pre-slew background subtracted image of 15-350 keV band
Time interval of the image:
-3.112000 106.056000

# RAcent  DECcent POSerr Theta    Phi  PeakCts   SNR AngSep     Name
#  [deg]    [deg]    ['] [deg]  [deg]                   [']
 83.5688  21.9505    4.3  55.9    4.1  -2.0005  -2.7    5.3	Crab
308.1532  40.7253    0.0  53.1 -149.4  -0.3643  -0.8   13.8	Cyg X-3
326.2080  38.5248    9.7  41.1 -159.4  -0.2201  -1.2   12.3	Cyg X-2
328.8805  37.0609    1.2  39.7 -162.7   1.8183   9.9 ------	UNKNOWN
Post-slew image of 15-350 keV band
Time interval of the image:
699.728610 962.599500

# RAcent  DECcent POSerr Theta    Phi  PeakCts   SNR AngSep     Name
#  [deg]    [deg]    ['] [deg]  [deg]                   [']
 83.6288  22.0153    0.3  32.1  -36.2  10.8297  42.8    0.2	Crab
 92.5576   1.6634    2.1  50.8  -17.7   2.4918   5.4 ------	UNKNOWN
 21.7003  82.6703    2.5  51.8 -139.6   4.9553   4.6 ------	UNKNOWN