Analysis Summary
Notes:
- 1) No attempt has been made to eliminate the non-significant decimal places.
- 2) This batgrbproduct analysis is done using the HEASARC data.
- 3) This batgrbproduct analysis is using the flight position for the mask-weighting calculation.
======================================================================
BAT GRB EVENT DATA PROCESSING REPORT
Process Script Ver: batgrbproduct v2.46
Process Start Time: Fri Jan 17 15:43:22 EST 2014
Host Name: batevent1
Current Working Dir: /local/data/batevent/batevent_reproc/trigger436094
======================================================================
Trigger: 00436094 Segment: 000
BAT Trigger Time: 308509121.6 [s; MET]
Trigger Stop: 308509122.624 [s; MET]
UTC: 2010-10-11T16:58:35.338240 [includes UTCF correction]
Where From?: TDRSS position message
BAT
RA: 48.2984265172764 Dec: -65.9859644209653 [deg; J2000]
Catalogged Source?: NO
Point Source?: YES
GRB Indicated?: YES [ by BAT flight software ]
Image S/N Ratio: 6.65
Image Trigger?: NO
Rate S/N Ratio: 24.7991935352745 [ if not an image trigger ]
Image S/N Ratio: 6.65
Analysis Position: [ source = BAT ]
RA: 48.2984265172764 Dec: -65.9859644209653 [deg; J2000]
Refined Position: [ source = BAT pre-slew burst ]
RA: 48.2852828611556 Dec: -65.989963225321 [deg; J2000]
{ 03h 13m 08.5s , -65d 59' 23.9" }
+/- 1.24735422319305 [arcmin] (estimated 90% radius based on SNR)
+/- 0.494052326765422 [arcmin] (formal 1-sigma fit error)
SNR: 22.1814581302907
Angular difference between the analysis and refined position is 0.400687 arcmin
Partial Coding Fraction: 0.875 [ including projection effects ]
Duration
T90: 70.891999900341 +/- 18.643600613615
Measured from: 0.38400000333786
to: 71.2759999036789 [s; relative to TRIGTIME]
T50: 28.9079999923706 +/- 5.09016622077145
Measured from: 4.32799994945526
to: 33.2359999418259 [s; relative to TRIGTIME]
Fluence
Peak Flux (peak 1 second)
Measured from: -0.224000036716461
to: 0.775999963283539 [s; relative to TRIGTIME]
Total Fluence
Measured from: -0.379999995231628
to: 87.0719999670982 [s; relative to TRIGTIME]
Band 1 Band 2 Band 3 Band 4
15-25 25-50 50-100 100-350 keV
Total 0.491277 0.710872 0.634676 0.290676
0.050406 0.052072 0.047134 0.043235 [error]
Peak 0.036096 0.066473 0.049111 0.015231
0.006244 0.006647 0.006324 0.005628 [error]
[ fluence units of on-axis counts / fully illuminated detector ]
======================================================================
====== Table of the duration information =============================
Value tstart tstop
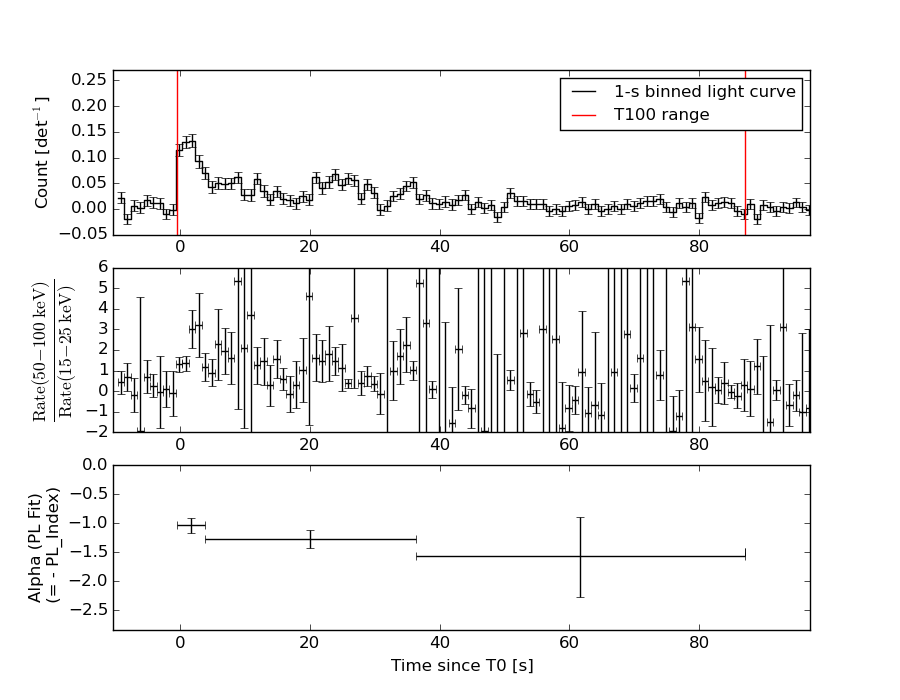
T100 87.452 -0.380 87.072
T90 70.892 0.384 71.276
T50 28.908 4.328 33.236
Peak 1.000 -0.224 0.776
====== Spectral Analysis Summary =====================================
Model : spectral model: simple power-law (PL) and cutoff power-law (CPL)
Ph_index : photon index: E^{Ph_index}
Ph_90err : 90% error of the photon index
Epeak : Epeak in keV
Epeak_90err: 90% error of Epeak
Norm : normalization at 50 keV in both the PL model and CPL model
Nomr_90err : 90% error of the normalization
chi2 : Chi-Squared
dof : degree of freedo
=== Time-averaged spectral analysis ===
(Best model with acceptable fit: PL)
Model Ph_index Ph_90err_low Ph_90err_hi Epeak Epeak_90err_low Epeak_90err_hi Norm Nomr_90err_low Norm_90err_hi chi2 dof
PL -1.234 -0.142 0.144 - - - 1.57e-03 -1.17e-04 1.17e-04 51.870 57
CPL -1.232 -0.142 0.151 9999.360 -9999.360 -9999.360 1.57e-03 -1.17e-04 2.62e-04 51.920 56
=== 1-s peak spectral analysis ===
(Best model with acceptable fit: PL)
Model Ph_index Ph_90err_low Ph_90err_hi Epeak Epeak_90err_low Epeak_90err_hi Norm Nomr_90err_low Norm_90err_hi chi2 dof
PL -1.270 -0.192 0.194 - - - 1.13e-02 -1.32e-03 1.32e-03 56.710 57
CPL -0.502 -0.818 1.063 95.331 -31.835 -95.331 2.82e-02 -1.72e-02 7.13e-02 54.200 56
=== Fluence/Peak Flux Summary ===
Model Band1 Band2 Band3 Band4 Band5 Total
15-25 25-50 50-100 100-350 15-150 15-350 keV
Fluence PL 1.36e-07 2.95e-07 5.02e-07 1.96e-06 1.38e-06 2.89e-06 erg/cm2
90%_error_low -2.03e-08 -2.59e-08 -4.64e-08 -3.90e-07 -1.15e-07 -4.20e-07 erg/cm2
90%_error_hi 2.12e-08 2.55e-08 4.59e-08 4.57e-07 1.16e-07 4.78e-07 erg/cm2
Peak flux PL 3.73e-01 4.30e-01 3.57e-01 4.98e-01 1.34e+00 1.66e+00 ph/cm2/s
90%_error_low -7.40e-02 -5.53e-02 -5.03e-02 -1.30e-01 -1.57e-01 -2.03e-01 ph/cm2/s
90%_error_hi 7.81e-02 5.47e-02 4.99e-02 1.56e-01 1.57e-01 2.07e-01 ph/cm2/s
Fluence CPL 1.40e-07 2.92e-07 4.95e-07 1.98e-06 1.39e-06 2.74e-06 erg/cm2
90%_error_low -2.41e-08 -2.25e-08 -3.95e-08 -7.01e-07 -1.26e-07 -4.61e-07 erg/cm2
90%_error_hi 1.74e-08 2.89e-08 5.30e-08 1.65e-07 1.06e-07 5.89e-07 erg/cm2
Peak flux CPL 3.30e-01 4.66e-01 3.76e-01 2.12e-01 1.30e+00 1.38e+00 ph/cm2/s
90%_error_low -8.65e-02 -6.82e-02 -5.68e-02 -1.30e-01 -1.64e-01 -2.13e-01 ph/cm2/s
90%_error_hi 9.01e-02 7.25e-02 5.80e-02 3.25e-01 1.63e-01 3.34e-01 ph/cm2/s
======================================================================
Image
Pre-slew 15.0-350.0 keV image (Event data)
#   RAcent    DECcent   POSerr    Theta     Phi              Peak Cts       SNR   Name
   48.2853   -65.9900   0.0087    25.1184     2.6194         1.1231964     22.181 TRIG_00436094

Foreground time interval of the image:
 -0.380  18.701 (delta_t =  19.081 [sec])
Background time interval of the image:
-239.600  -0.380 (delta_t = 239.220 [sec])
Light Curves
Note: The mask-weighted lightcurves have units of either count/det or counts/sec/det, where a det is 0.4 x 0.4 = 0.16 sq cm.
Full-time range; 1 s binning
Other quick-look light curves:
- 64 ms binning (zoomed)
- 16 ms binning (zoomed)
- 8 ms binning (zoomed)
- 2 ms binning (zoomed)
- SN=5 or 10 s binning (full-time range)
- Raw light curve
Spectra
- 64 ms binning (zoomed)
- 16 ms binning (zoomed)
- 8 ms binning (zoomed)
- 2 ms binning (zoomed)
- SN=5 or 10 s binning (full-time range)
- Raw light curve
Spectra
Notes:
- 1) The fitting includes the systematic errors.
- 2) When the burst includes telescope slew time periods, the fitting uses an average response file made from multiple 5-s response files through out the slew time plus single time preiod for the non-slew times, and weighted by the total counts in the corresponding time period using addrmf. An average response file is needed becuase a spectral fit using the pre-slew DRM will introduce some errors in both a spectral shape and a normalization if the PHA file contains a lot of the slew/post-slew time interval.
- 3) For fits to more complicated models (e.g. a power-law over a cutoff power-law), the BAT team has decided to require a chi-square improvement of more than 6 for each extra dof.
Time averaged spectrum fit using the average DRM
Power-law model
Time interval is from   -0.380 sec. to   87.072 sec.

Spectral model in power-law:
------------------------------------------------------------
Parameters  : value       lower 90%   higher 90%
Photon index: -1.23418     ( -0.142007   0.143858 )
Norm@50keV  : 1.56571E-03    ( -0.000116875   0.000116875 )
------------------------------------------------------------
#Fit statistic : Chi-Squared =          51.87 using 59 PHA bins.
# Reduced chi-squared =         0.9100 for     57 degrees of freedom
# Null hypothesis probability =   6.673021e-01

Photon flux (15-150 keV)    in 87.45 sec: 0.184717 ( -0.014347  0.014402 ) ph/cm2/s
Energy fluence (15-150 keV)             : 1.37626e-06 ( -1.15103e-07  1.15913e-07 ) ergs/cm2
Cutoff power-law model

Time interval is from   -0.380 sec. to   87.072 sec.
Spectral model in the cutoff power-law:
------------------------------------------------------------
Parameters  : value       lower 90%   higher 90%
Photon index: -1.2317     ( -0.141564   0.150446 )
Epeak [keV] : 9999.36      ( -9999.36 -9999.36 )
Norm@50keV  : 1.57268E-03    ( -0.000117271   0.000261829 )
------------------------------------------------------------
#Fit statistic : Chi-Squared =          51.92 using 59 PHA bins.
# Reduced chi-squared =         0.9271 for     56 degrees of freedom
# Null hypothesis probability =   6.300525e-01

Photon flux (15-150 keV)    in 87.45 sec: 0.184678 ( -0.014363  0.014389 ) ph/cm2/s
Energy fluence (15-150 keV)             : 1.38599e-06 ( -1.25583e-07  1.05571e-07 ) ergs/cm2
1-s peak spectrum fit
Power-law model

Time interval is from   -0.224 sec. to    0.776 sec.

Spectral model in power-law:
------------------------------------------------------------
Parameters  : value       lower 90%   higher 90%
Photon index: -1.26971     ( -0.192364   0.193715 )
Norm@50keV  : 1.12958E-02    ( -0.00132048   0.00131826 )
------------------------------------------------------------
#Fit statistic : Chi-Squared =          56.71 using 59 PHA bins.
# Reduced chi-squared =         0.9949 for     57 degrees of freedom
# Null hypothesis probability =   4.860121e-01

Photon flux (15-150 keV)    in 1 sec: 1.34040 ( -0.15706  0.15719 ) ph/cm2/s
Energy fluence (15-150 keV)             : 1.12484e-07 ( -1.47805e-08  1.49543e-08 ) ergs/cm2
Cutoff power-law model
Time interval is from   -0.224 sec. to    0.776 sec.
Spectral model in the cutoff power-law:
------------------------------------------------------------
Parameters  : value       lower 90%   higher 90%
Photon index: -0.502472     ( -0.81784   1.06251 )
Epeak [keV] : 95.3305      ( -31.8112 -95.3071 )
Norm@50keV  : 2.81523E-02    ( -0.0171974   0.0712627 )
------------------------------------------------------------
#Fit statistic : Chi-Squared =          54.20 using 59 PHA bins.
# Reduced chi-squared =         0.9678 for     56 degrees of freedom
# Null hypothesis probability =   5.434173e-01

Photon flux (15-150 keV)    in 1 sec: 1.30242 ( -0.16398  0.1631 ) ph/cm2/s
Energy fluence (15-150 keV)             : 1.04894e-07 ( -1.75124e-08  1.72606e-08 ) ergs/cm2
Time-resolved spectra
Distribution
T90 vs. Hardness ratio plot
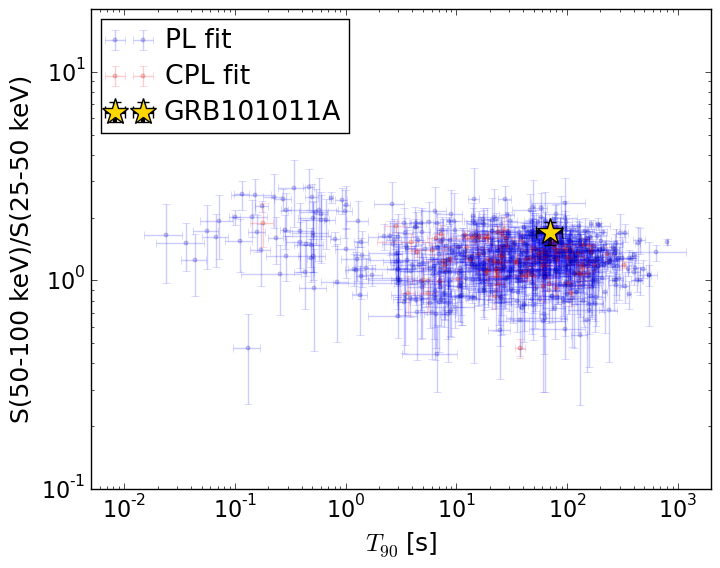
T90                                   = 70.892 sec.
Hardness ratio (energy fluence ratio) = 1.70039602289
S(15-50 keV) vs. S(50-150 keV) plot
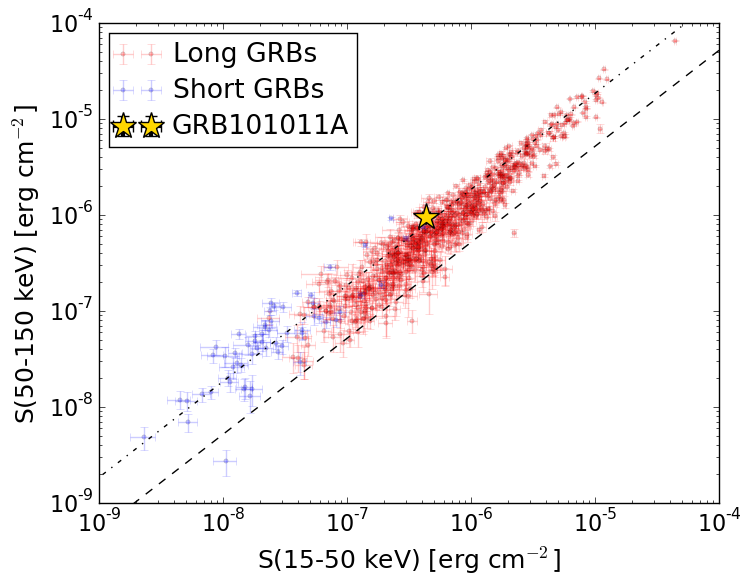
S(15-50 keV)  = 4.313186e-07
S(50-150 keV) = 9.449185e-07
The dash-dotted line and the dashed line traces the fluences calculated from the Band function with Epeak = 15 and 150 keV, respectively. Both lines assume a canonical values of alpha = -1 and beta = -2.5.
Mask shadow pattern
IMX = 4.683360674006261E-01, IMY = -2.142568939790490E-02
Spacecraft aspect plot
Bright source in the pre-burst/pre-slew/post-slew images
Pre-burst image of 15-350 keV band
Time interval of the image:
-239.600000 -0.380000

# RAcent  DECcent POSerr Theta    Phi  PeakCts   SNR AngSep     Name
#  [deg]    [deg]    ['] [deg]  [deg]                   [']
135.5201 -40.5156    1.1  37.5 -112.4   4.4896  10.6    2.4	Vela X-1
 53.2018 -16.2062    3.0  40.4  102.2   2.8362   3.8 ------	UNKNOWN
 80.0402 -19.9951    2.3  28.5  143.8   1.1517   4.9 ------	UNKNOWN
 45.2319 -51.7653    2.5  24.2   37.3   0.9950   4.7 ------	UNKNOWN
328.3336 -68.0764    2.8  53.8   -5.6   2.2186   4.1 ------	UNKNOWN
183.7391 -73.3421    3.7  47.1  -53.1   3.0145   3.2 ------	UNKNOWN
Pre-slew background subtracted image of 15-350 keV band
Time interval of the image:
-0.380000 18.700580

# RAcent  DECcent POSerr Theta    Phi  PeakCts   SNR AngSep     Name
#  [deg]    [deg]    ['] [deg]  [deg]                   [']
135.5232 -40.5720    7.3  37.5 -112.3  -0.1578  -1.6    1.1	Vela X-1
 93.8144  -7.0829    2.5  42.4  165.6   0.3825   4.7 ------	UNKNOWN
 48.2853 -65.9900    0.5  25.1    2.6   1.1232  22.2 ------	UNKNOWN
115.7693  -4.8611    2.0  51.7 -167.0   0.6883   5.8 ------	UNKNOWN
Post-slew image of 15-350 keV band
Time interval of the image:
64.900620 962.483400

# RAcent  DECcent POSerr Theta    Phi  PeakCts   SNR AngSep     Name
#  [deg]    [deg]    ['] [deg]  [deg]                   [']
311.9089 -56.6581    3.3  42.4   -3.6   2.7820   3.5 ------	UNKNOWN
 19.3936 -73.3889    2.9  12.3  -17.1   1.9552   4.0 ------	UNKNOWN
293.6082 -51.8718    2.8  52.1  -12.4   5.2328   4.1 ------	UNKNOWN
133.8233 -45.1504    2.6  47.9 -129.0  10.2366   4.5 ------	UNKNOWN