Analysis Summary
Notes:
- 1) No attempt has been made to eliminate the non-significant decimal places.
- 2) This batgrbproduct analysis is done using the HEASARC data.
- 3) This batgrbproduct analysis is using the flight position for the mask-weighting calculation.
======================================================================
BAT GRB EVENT DATA PROCESSING REPORT
Process Script Ver: batgrbproduct v2.46
Process Start Time: Fri Jan 17 15:39:08 EST 2014
Host Name: batevent1
Current Working Dir: /local/data/batevent/batevent_reproc/trigger436429
======================================================================
Trigger: 00436429 Segment: 000
BAT Trigger Time: 309004373.696 [s; MET]
Trigger Stop: 309004374.72 [s; MET]
UTC: 2010-10-17T10:32:47.416220 [includes UTCF correction]
Where From?: TDRSS position message
BAT
RA: 291.377889105661 Dec: -35.1409002465417 [deg; J2000]
Catalogged Source?: NO
Point Source?: YES
GRB Indicated?: YES [ by BAT flight software ]
Image S/N Ratio: 20.22
Image Trigger?: NO
Rate S/N Ratio: 95.7548954362125 [ if not an image trigger ]
Image S/N Ratio: 20.22
Analysis Position: [ source = BAT ]
RA: 291.377889105661 Dec: -35.1409002465417 [deg; J2000]
Refined Position: [ source = BAT pre-slew burst ]
RA: 291.376741931395 Dec: -35.1404334548356 [deg; J2000]
{ 19h 25m 30.4s , -35d 08' 25.6" }
+/- 0.531248327955595 [arcmin] (estimated 90% radius based on SNR)
+/- 0.107271035281423 [arcmin] (formal 1-sigma fit error)
SNR: 75.0845209126248
Angular difference between the analysis and refined position is 0.062869 arcmin
Partial Coding Fraction: 0.4375 [ including projection effects ]
Duration
T90: 72.2319999337196 +/- 3.66001587388552
Measured from: -1.87199997901917
to: 70.3599999547005 [s; relative to TRIGTIME]
T50: 20.4479999542236 +/- 0.517006751342904
Measured from: 4.64399999380112
to: 25.0919999480247 [s; relative to TRIGTIME]
Fluence
Peak Flux (peak 1 second)
Measured from: 2.58000004291534
to: 3.58000004291534 [s; relative to TRIGTIME]
Total Fluence
Measured from: -5.4879999756813
to: 130.568000018597 [s; relative to TRIGTIME]
Band 1 Band 2 Band 3 Band 4
15-25 25-50 50-100 100-350 keV
Total 6.318273 9.463312 7.943354 2.415513
0.086072 0.093788 0.087256 0.069807 [error]
Peak 0.206983 0.374560 0.420962 0.147216
0.012394 0.015207 0.016297 0.013200 [error]
[ fluence units of on-axis counts / fully illuminated detector ]
======================================================================
====== Table of the duration information =============================
Value tstart tstop
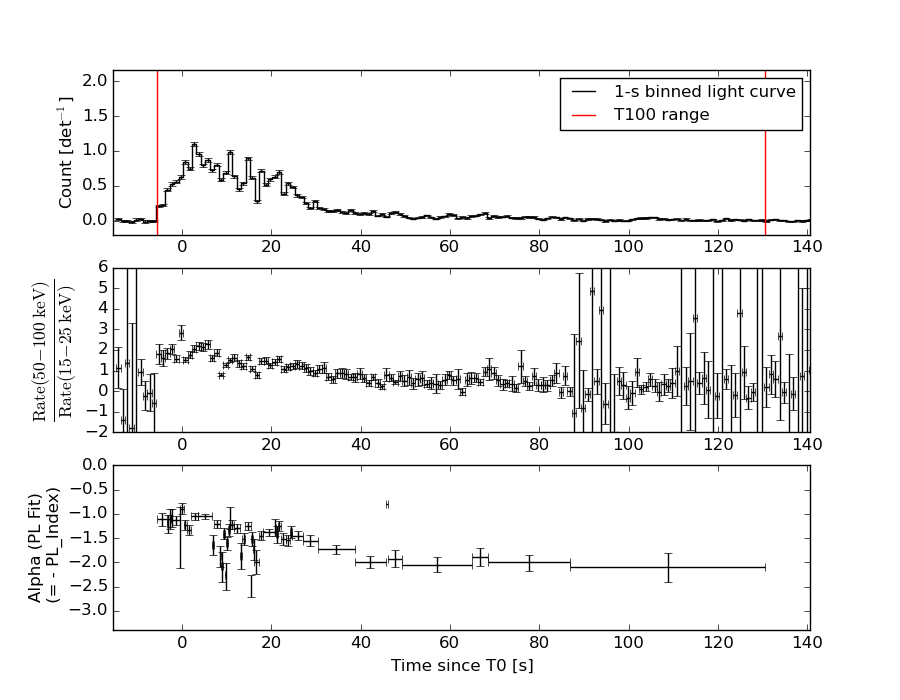
T100 136.056 -5.488 130.568
T90 72.232 -1.872 70.360
T50 20.448 4.644 25.092
Peak 1.000 2.580 3.580
====== Spectral Analysis Summary =====================================
Model : spectral model: simple power-law (PL) and cutoff power-law (CPL)
Ph_index : photon index: E^{Ph_index}
Ph_90err : 90% error of the photon index
Epeak : Epeak in keV
Epeak_90err: 90% error of Epeak
Norm : normalization at 50 keV in both the PL model and CPL model
Nomr_90err : 90% error of the normalization
chi2 : Chi-Squared
dof : degree of freedo
=== Time-averaged spectral analysis ===
(Best model with acceptable fit: PL)
Model Ph_index Ph_90err_low Ph_90err_hi Epeak Epeak_90err_low Epeak_90err_hi Norm Nomr_90err_low Norm_90err_hi chi2 dof
PL -1.427 -0.030 0.030 - - - 1.34e-02 -2.15e-04 2.15e-04 36.020 57
CPL -1.367 -0.088 -0.026 592.682 -592.682 -592.682 1.42e-02 -9.65e-04 1.35e-03 36.270 56
=== 1-s peak spectral analysis ===
(Best model with acceptable fit: PL)
Model Ph_index Ph_90err_low Ph_90err_hi Epeak Epeak_90err_low Epeak_90err_hi Norm Nomr_90err_low Norm_90err_hi chi2 dof
PL -1.096 -0.075 0.075 - - - 8.02e-02 -3.45e-03 3.45e-03 53.280 57
CPL -0.707 -0.290 0.310 191.833 -60.029 345.223 1.20e-01 -3.00e-02 4.28e-02 47.890 56
=== Fluence/Peak Flux Summary ===
Model Band1 Band2 Band3 Band4 Band5 Total
15-25 25-50 50-100 100-350 15-150 15-350 keV
Fluence PL 2.17e-06 4.17e-06 6.21e-06 1.99e-05 1.75e-05 3.24e-05 erg/cm2
90%_error_low -7.72e-08 -8.68e-08 -1.06e-07 -8.07e-07 -2.74e-07 -8.33e-07 erg/cm2
90%_error_hi 7.85e-08 8.67e-08 1.06e-07 8.31e-07 2.74e-07 8.51e-07 erg/cm2
Peak flux PL 2.25e+00 2.88e+00 2.69e+00 4.43e+00 9.30e+00 1.22e+01 ph/cm2/s
90%_error_low -1.88e-01 -1.49e-01 -1.32e-01 -4.49e-01 -4.09e-01 -5.74e-01 ph/cm2/s
90%_error_hi 1.94e-01 1.48e-01 1.31e-01 4.79e-01 4.10e-01 5.80e-01 ph/cm2/s
Fluence CPL 2.15e-06 4.18e-06 6.23e-06 1.98e-05 1.75e-05 3.16e-05 erg/cm2
90%_error_low -1.10e-07 -7.81e-08 -6.52e-08 -3.30e-06 -2.89e-07 -2.41e-06 erg/cm2
90%_error_hi 9.23e-08 8.70e-08 1.32e-07 5.77e-07 2.85e-07 1.09e-06 erg/cm2
Peak flux CPL 1.04e+00 7.54e-01 3.79e-01 3.29e-01 2.31e+00 2.56e+00 ph/cm2/s
90%_error_low -2.86e-01 -2.24e-01 -1.00e-01 -6.85e-02 -6.86e-01 -7.77e-01 ph/cm2/s
90%_error_hi 3.05e-01 1.92e-01 7.35e-02 4.43e-02 5.79e-01 5.08e-01 ph/cm2/s
======================================================================
Image
Pre-slew 15.0-350.0 keV image (Event data)

#   RAcent    DECcent   POSerr    Theta     Phi              Peak Cts       SNR   Name
  291.3767   -35.1404   0.0026    36.6142   -48.5428        12.8687436     75.085 TRIG_00436429

Foreground time interval of the image:
 -5.488  12.405 (delta_t =  17.893 [sec])
Background time interval of the image:
-87.795  -5.488 (delta_t =  82.307 [sec])
Light Curves
Note: The mask-weighted lightcurves have units of either count/det or counts/sec/det, where a det is 0.4 x 0.4 = 0.16 sq cm.
Full-time range; 1 s binning
Other quick-look light curves:
- 64 ms binning (zoomed)
- 16 ms binning (zoomed)
- 8 ms binning (zoomed)
- 2 ms binning (zoomed)
- SN=5 or 10 s binning (full-time range)
- Raw light curve
Spectra
- 64 ms binning (zoomed)
- 16 ms binning (zoomed)
- 8 ms binning (zoomed)
- 2 ms binning (zoomed)
- SN=5 or 10 s binning (full-time range)
- Raw light curve
Spectra
Notes:
- 1) The fitting includes the systematic errors.
- 2) When the burst includes telescope slew time periods, the fitting uses an average response file made from multiple 5-s response files through out the slew time plus single time preiod for the non-slew times, and weighted by the total counts in the corresponding time period using addrmf. An average response file is needed becuase a spectral fit using the pre-slew DRM will introduce some errors in both a spectral shape and a normalization if the PHA file contains a lot of the slew/post-slew time interval.
- 3) For fits to more complicated models (e.g. a power-law over a cutoff power-law), the BAT team has decided to require a chi-square improvement of more than 6 for each extra dof.
Time averaged spectrum fit using the average DRM
Power-law model

Time interval is from   -5.488 sec. to  130.568 sec.

Spectral model in power-law:
------------------------------------------------------------
Parameters  : value       lower 90%   higher 90%
Photon index: -1.42713     ( -0.0302075   0.030278 )
Norm@50keV  : 1.33772E-02    ( -0.000214991   0.000214654 )
------------------------------------------------------------
#Fit statistic : Chi-Squared =          36.02 using 59 PHA bins.
# Reduced chi-squared =         0.6319 for     57 degrees of freedom
# Null hypothesis probability =   9.865024e-01

Photon flux (15-150 keV)    in 136.1 sec: 1.63944 ( -0.03137  0.0315 ) ph/cm2/s
Energy fluence (15-150 keV)             : 1.74996e-05 ( -2.73852e-07  2.74109e-07 ) ergs/cm2
Cutoff power-law model

Time interval is from   -5.488 sec. to  130.568 sec.
Spectral model in the cutoff power-law:
------------------------------------------------------------
Parameters  : value       lower 90%   higher 90%
Photon index: -1.42261     ( -0.0312984   0.0299575 )
Epeak [keV] : 9997.85      ( -9992.58 -9992.58 )
Norm@50keV  : 1.34423E-02    ( -0.0002116   0.00210198 )
------------------------------------------------------------
#Fit statistic : Chi-Squared =          36.01 using 59 PHA bins.
# Reduced chi-squared =         0.6430 for     56 degrees of freedom
# Null hypothesis probability =   9.826412e-01

Photon flux (15-150 keV)    in 136.1 sec: 1.63496 ( -0.03672  0.01808 ) ph/cm2/s
Energy fluence (15-150 keV)             : 1.74682e-05 ( -2.89153e-07  2.85098e-07 ) ergs/cm2
1-s peak spectrum fit
Power-law model

Time interval is from    2.580 sec. to    3.580 sec.

Spectral model in power-law:
------------------------------------------------------------
Parameters  : value       lower 90%   higher 90%
Photon index: -1.09646     ( -0.0748746   0.075028 )
Norm@50keV  : 8.02229E-02    ( -0.00345279   0.00345226 )
------------------------------------------------------------
#Fit statistic : Chi-Squared =          53.28 using 59 PHA bins.
# Reduced chi-squared =         0.9347 for     57 degrees of freedom
# Null hypothesis probability =   6.155339e-01

Photon flux (15-150 keV)    in 1 sec: 9.30215 ( -0.40928  0.40956 ) ph/cm2/s
Energy fluence (15-150 keV)             : 8.39789e-07 ( -4.03046e-08  4.04488e-08 ) ergs/cm2
Cutoff power-law model

Time interval is from    2.580 sec. to    3.580 sec.
Spectral model in the cutoff power-law:
------------------------------------------------------------
Parameters  : value       lower 90%   higher 90%
Photon index: -0.70663     ( -0.29027   0.310236 )
Epeak [keV] : 191.833      ( -60.0288 345.224 )
Norm@50keV  : 0.119514    ( -0.0299849   0.0428076 )
------------------------------------------------------------
#Fit statistic : Chi-Squared =          47.89 using 59 PHA bins.
# Reduced chi-squared =         0.8551 for     56 degrees of freedom
# Null hypothesis probability =   7.713113e-01

Photon flux (15-150 keV)    in 1 sec: 2.30950 ( -0.68565  0.5788 ) ph/cm2/s
Energy fluence (15-150 keV)             : 1.54333e-07 ( -3.11757e-08  2.55003e-08 ) ergs/cm2
Time-resolved spectra
Distribution
T90 vs. Hardness ratio plot

T90                                   = 72.232 sec.
Hardness ratio (energy fluence ratio) = 1.48751020232
S(15-50 keV) vs. S(50-150 keV) plot

S(15-50 keV)  = 6.343187e-06
S(50-150 keV) = 1.1156607e-05
The dash-dotted line and the dashed line traces the fluences calculated from the Band function with Epeak = 15 and 150 keV, respectively. Both lines assume a canonical values of alpha = -1 and beta = -2.5.
Mask shadow pattern

IMX = 4.919435740203281E-01, IMY = 5.568786709476784E-01
Spacecraft aspect plot

Bright source in the pre-burst/pre-slew/post-slew images
Pre-burst image of 15-350 keV band
Time interval of the image:
-87.795410 -5.488000

# RAcent  DECcent POSerr Theta    Phi  PeakCts   SNR AngSep     Name
#  [deg]    [deg]    ['] [deg]  [deg]                   [']
285.1561 -24.9888    7.2  46.0  -38.5  -0.3362  -1.6    7.7	HT1900.1-2455
342.8159 -34.6587    2.3   6.5   90.3   0.4205   5.0 ------	UNKNOWN
284.9946 -78.8026    3.2  44.2 -117.9   1.3695   3.7 ------	UNKNOWN
Pre-slew background subtracted image of 15-350 keV band
Time interval of the image:
-5.488000 12.404590

# RAcent  DECcent POSerr Theta    Phi  PeakCts   SNR AngSep     Name
#  [deg]    [deg]    ['] [deg]  [deg]                   [']
285.0548 -24.7574    6.8  46.2  -38.3  -0.4890  -1.7    9.8	HT1900.1-2455
  9.5546 -29.1200    3.4  28.2  127.2   0.4029   3.4 ------	UNKNOWN
  9.2486 -63.3341    2.8  30.1 -158.6   0.4787   4.1 ------	UNKNOWN
299.2617 -17.3331    2.4  40.0  -17.9   0.7685   4.8 ------	UNKNOWN
 20.4876 -68.3878    2.4  36.7 -155.4   0.6419   4.7 ------	UNKNOWN
291.3767 -35.1404    0.2  36.6  -48.5  12.8686  75.1 ------	UNKNOWN
Post-slew image of 15-350 keV band
Time interval of the image:
70.004590 154.470900
155.304000 962.343300

# RAcent  DECcent POSerr Theta    Phi  PeakCts   SNR AngSep     Name
#  [deg]    [deg]    ['] [deg]  [deg]                   [']
256.0341 -37.8469    2.3  28.4  -98.6   3.5538   5.0    2.3	4U 1700-377
256.4912 -36.4742    3.0  28.2  -95.7   2.8566   3.8    4.1	GX 349+2
262.9807 -24.7623    1.9  26.6  -67.4   3.6888   6.0    1.8	GX 1+4
264.8649 -44.5009    6.2  22.3 -115.5   1.0415   1.9    6.0	4U 1735-44
268.3402  -1.4844    2.5  39.9  -30.2   3.4539   4.5    2.5	SW J1753.5-0127
270.3341 -25.1828    3.7  20.7  -59.6   1.5960   3.2    6.8	GX 5-1
270.2710 -25.8413    3.1  20.4  -61.3   1.9082   3.8    6.1	GRS 1758-258
274.0008 -14.0405    2.6  26.3  -33.6   2.2527   4.4    0.4	GX 17+2
275.9202 -30.3191    2.3  13.9  -66.6   2.6344   5.1    2.9	H1820-303
285.0808 -24.9133    3.7  11.6  -22.4   1.5817   3.1    2.5	HT1900.1-2455
288.7901  10.9466    0.9  46.1    3.8  14.3785  13.0    0.5	GRS 1915+105
262.9511 -33.8002    2.0  23.4  -87.6   3.6134   5.7    2.8	GX 354-0
319.1765   2.8422    3.5  46.0   47.7  10.1798   3.3 ------	UNKNOWN
332.5738 -60.3626    3.0  36.4  154.1   3.7187   3.9 ------	UNKNOWN
284.5344  -0.7623    3.8  35.0   -4.6   2.1275   3.0 ------	UNKNOWN
267.0142 -24.8491    2.1  23.4  -63.2   3.5441   5.6 ------	UNKNOWN
255.1966 -41.6395    1.9  28.9 -106.6   4.5468   5.9 ------	UNKNOWN