Analysis Summary
Notes:
- 1) No attempt has been made to eliminate the non-significant decimal places.
- 2) This batgrbproduct analysis is done using the HEASARC data.
- 3) This batgrbproduct analysis is using the flight position for the mask-weighting calculation.
======================================================================
BAT GRB EVENT DATA PROCESSING REPORT
Process Script Ver: batgrbproduct v2.46
Process Start Time: Fri Jan 17 15:29:34 EST 2014
Host Name: batevent1
Current Working Dir: /local/data/batevent/batevent_reproc/trigger436737
======================================================================
Trigger: 00436737 Segment: 000
BAT Trigger Time: 309310848 [s; MET]
Trigger Stop: 309310912 [s; MET]
UTC: 2010-10-20T23:40:41.709060 [includes UTCF correction]
Where From?: TDRSS position message
BAT
RA: 189.566423306271 Dec: 23.1609361221947 [deg; J2000]
Catalogged Source?: NO
Point Source?: YES
GRB Indicated?: YES [ by BAT flight software ]
Image S/N Ratio: 13.24
Image Trigger?: YES
Rate S/N Ratio: 0 [ if not an image trigger ]
Image S/N Ratio: 13.24
Analysis Position: [ source = BAT ]
RA: 189.566423306271 Dec: 23.1609361221947 [deg; J2000]
Refined Position: [ source = BAT pre-slew burst ]
RA: 189.576407827723 Dec: 23.18286537218 [deg; J2000]
{ 12h 38m 18.3s , +23d 10' 58.3" }
+/- 1.77243961034988 [arcmin] (estimated 90% radius based on SNR)
+/- 0.763091014324163 [arcmin] (formal 1-sigma fit error)
SNR: 13.4281539841749
Angular difference between the analysis and refined position is 1.426369 arcmin
Partial Coding Fraction: 0.4296875 [ including projection effects ]
Duration
T90: 172.336000025272 +/- 29.2958033946059
Measured from: -33.0479999780655
to: 139.288000047207 [s; relative to TRIGTIME]
T50: 72.3360000252724 +/- 18.4150842352333
Measured from: -2.05599999427795
to: 70.2800000309944 [s; relative to TRIGTIME]
Fluence
Peak Flux (peak 1 second)
Measured from: -15.3640000224113
to: -14.3640000224113 [s; relative to TRIGTIME]
Total Fluence
Measured from: -43.7519999742508
to: 164.871999979019 [s; relative to TRIGTIME]
Band 1 Band 2 Band 3 Band 4
15-25 25-50 50-100 100-350 keV
Total 1.583107 1.894857 0.768568 0.230673
0.132182 0.130562 0.118649 0.113421 [error]
Peak 0.022940 0.018330 0.031594 0.011053
0.009106 0.009058 0.007990 0.007430 [error]
[ fluence units of on-axis counts / fully illuminated detector ]
======================================================================
====== Table of the duration information =============================
Value tstart tstop
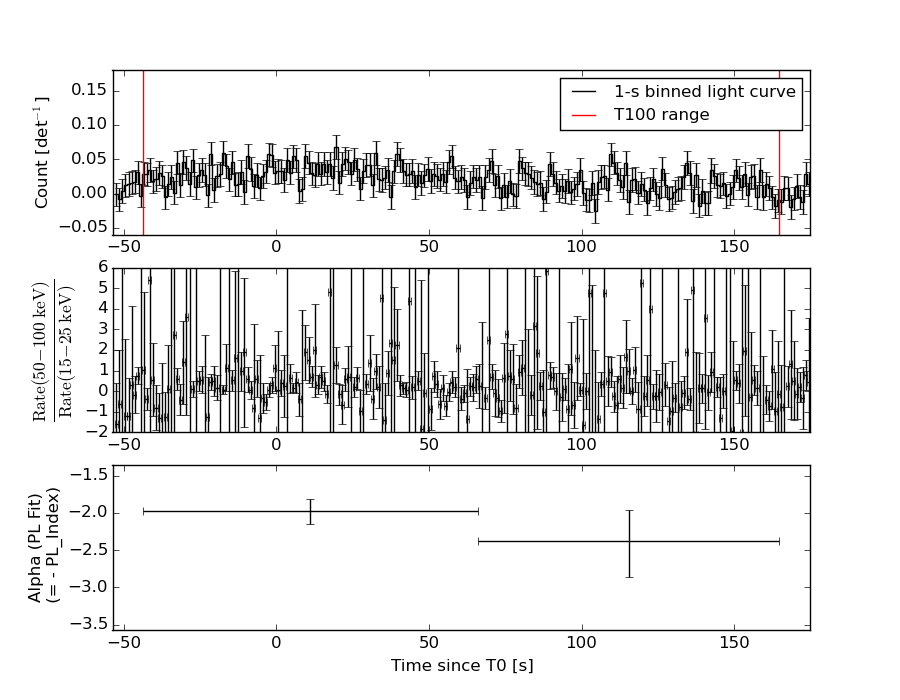
T100 208.624 -43.752 164.872
T90 172.336 -33.048 139.288
T50 72.336 -2.056 70.280
Peak 1.000 -15.364 -14.364
====== Spectral Analysis Summary =====================================
Model : spectral model: simple power-law (PL) and cutoff power-law (CPL)
Ph_index : photon index: E^{Ph_index}
Ph_90err : 90% error of the photon index
Epeak : Epeak in keV
Epeak_90err: 90% error of Epeak
Norm : normalization at 50 keV in both the PL model and CPL model
Nomr_90err : 90% error of the normalization
chi2 : Chi-Squared
dof : degree of freedo
=== Time-averaged spectral analysis ===
(Best model with acceptable fit: PL)
Model Ph_index Ph_90err_low Ph_90err_hi Epeak Epeak_90err_low Epeak_90err_hi Norm Nomr_90err_low Norm_90err_hi chi2 dof
PL -2.073 -0.178 0.170 - - - 1.32e-03 -1.49e-04 1.46e-04 63.950 57
CPL -1.608 -0.528 0.871 35.153 -27.434 -35.153 2.44e-03 N/A N/A 62.760 56
=== 1-s peak spectral analysis ===
(Best model with acceptable fit: N/A)
Model Ph_index Ph_90err_low Ph_90err_hi Epeak Epeak_90err_low Epeak_90err_hi Norm Nomr_90err_low Norm_90err_hi chi2 dof
PL -1.539 -0.773 0.689 - - - 4.76e-03 -1.89e-03 1.82e-03 50.820 57
CPL -0.627 -2.087 0.627 88.159 -88.159 -88.159 1.18e-02 -1.18e-02 1.98e+02 50.580 56
=== Fluence/Peak Flux Summary ===
Model Band1 Band2 Band3 Band4 Band5 Total
15-25 25-50 50-100 100-350 15-150 15-350 keV
Fluence PL 6.05e-07 7.85e-07 7.46e-07 1.26e-06 2.56e-06 3.39e-06 erg/cm2
90%_error_low -7.64e-08 -6.84e-08 -1.15e-07 -3.49e-07 -2.60e-07 -4.83e-07 erg/cm2
90%_error_hi 7.86e-08 6.84e-08 1.17e-07 4.31e-07 2.65e-07 5.44e-07 erg/cm2
Peak flux PL 2.03e-01 2.00e-01 1.38e-01 1.49e-01 6.00e-01 6.90e-01 ph/cm2/s
90%_error_low -1.19e-01 -8.35e-02 -6.88e-02 -1.49e-01 -2.32e-01 -2.59e-01 ph/cm2/s
90%_error_hi 1.50e-01 8.04e-02 6.48e-02 1.99e-01 2.34e-01 2.62e-01 ph/cm2/s
Fluence CPL 5.78e-07 8.26e-07 7.27e-07 5.58e-07 2.43e-06 2.69e-06 erg/cm2
90%_error_low -8.84e-08 -9.13e-08 -1.37e-07 -3.88e-07 -3.13e-07 -5.20e-07 erg/cm2
90%_error_hi 8.71e-08 9.57e-08 1.28e-07 1.15e-06 3.25e-07 1.26e-06 erg/cm2
Peak flux CPL 1.53e-01 2.05e-01 1.55e-01 8.12e-02 5.64e-01 6.00e-01 ph/cm2/s
90%_error_low -1.53e-01 -1.56e-01 N/A -8.12e-02 -3.35e-01 -6.00e-01 ph/cm2/s
90%_error_hi 2.48e-01 9.24e-02 N/A 1.83e-01 2.58e-01 3.28e-01 ph/cm2/s
======================================================================
Image
Pre-slew 15.0-350.0 keV image (Event data)
#   RAcent    DECcent   POSerr    Theta     Phi              Peak Cts       SNR   Name
  189.5764    23.1829   0.0144    39.1984   -41.9162         4.8532735     13.428 TRIG_00436737

Foreground time interval of the image:
-43.752 164.872 (delta_t = 208.624 [sec])
Background time interval of the image:
-239.000 -43.752 (delta_t = 195.248 [sec])
Light Curves
Note: The mask-weighted lightcurves have units of either count/det or counts/sec/det, where a det is 0.4 x 0.4 = 0.16 sq cm.
Full-time range; 1 s binning
Other quick-look light curves:
- 64 ms binning (zoomed)
- 16 ms binning (zoomed)
- 8 ms binning (zoomed)
- 2 ms binning (zoomed)
- SN=5 or 10 s binning (full-time range)
- Raw light curve
Spectra
- 64 ms binning (zoomed)
- 16 ms binning (zoomed)
- 8 ms binning (zoomed)
- 2 ms binning (zoomed)
- SN=5 or 10 s binning (full-time range)
- Raw light curve
Spectra
Notes:
- 1) The fitting includes the systematic errors.
- 2) When the burst includes telescope slew time periods, the fitting uses an average response file made from multiple 5-s response files through out the slew time plus single time preiod for the non-slew times, and weighted by the total counts in the corresponding time period using addrmf. An average response file is needed becuase a spectral fit using the pre-slew DRM will introduce some errors in both a spectral shape and a normalization if the PHA file contains a lot of the slew/post-slew time interval.
- 3) For fits to more complicated models (e.g. a power-law over a cutoff power-law), the BAT team has decided to require a chi-square improvement of more than 6 for each extra dof.
Time averaged spectrum fit using the average DRM
Power-law model
Time interval is from  -43.752 sec. to  164.872 sec.

Spectral model in power-law:
------------------------------------------------------------
Parameters  : value       lower 90%   higher 90%
Photon index: -2.07327     ( -0.177887   0.169607 )
Norm@50keV  : 1.32160E-03    ( -0.000148839   0.000145772 )
------------------------------------------------------------
#Fit statistic : Chi-Squared =          63.95 using 59 PHA bins.
# Reduced chi-squared =          1.122 for     57 degrees of freedom
# Null hypothesis probability =   2.456834e-01

Photon flux (15-150 keV)    in 208.6 sec: 0.205237 ( -0.018011  0.018029 ) ph/cm2/s
Energy fluence (15-150 keV)             : 2.55566e-06 ( -2.59914e-07  2.64826e-07 ) ergs/cm2
Cutoff power-law model
Time interval is from  -43.752 sec. to  164.872 sec.
Spectral model in the cutoff power-law:
------------------------------------------------------------
Parameters  : value       lower 90%   higher 90%
Photon index: -1.60784     ( -0.527694   0.871345 )
Epeak [keV] : 35.1526      ( -27.4348 -35.1532 )
Norm@50keV  : 2.44334E-03    (     )
------------------------------------------------------------
#Fit statistic : Chi-Squared =          62.76 using 59 PHA bins.
# Reduced chi-squared =          1.121 for     56 degrees of freedom
# Null hypothesis probability =   2.492082e-01

Photon flux (15-150 keV)    in 208.6 sec: 0.200617 ( -0.019433  0.019363 ) ph/cm2/s
Energy fluence (15-150 keV)             : 2.43054e-06 ( -3.13382e-07  3.24853e-07 ) ergs/cm2
1-s peak spectrum fit
Power-law model
Time interval is from  -15.364 sec. to  -14.364 sec.

Spectral model in power-law:
------------------------------------------------------------
Parameters  : value       lower 90%   higher 90%
Photon index: -1.53855     ( -0.773291   0.688758 )
Norm@50keV  : 4.75629E-03    ( -0.00189251   0.00181738 )
------------------------------------------------------------
#Fit statistic : Chi-Squared =          50.82 using 59 PHA bins.
# Reduced chi-squared =         0.8917 for     57 degrees of freedom
# Null hypothesis probability =   7.045838e-01

Photon flux (15-150 keV)    in 1 sec: 0.600159 ( -0.231855  0.234252 ) ph/cm2/s
Energy fluence (15-150 keV)             : 4.4857e-08 ( -1.84627e-08  1.89223e-08 ) ergs/cm2
Cutoff power-law model
Time interval is from  -15.364 sec. to  -14.364 sec.
Spectral model in the cutoff power-law:
------------------------------------------------------------
Parameters  : value       lower 90%   higher 90%
Photon index: -0.627461     ( -2.088   0.626314 )
Epeak [keV] : 88.1587      ( -88.1378 -88.1378 )
Norm@50keV  : 1.17836E-02    ( -0.0120632   197.942 )
------------------------------------------------------------
#Fit statistic : Chi-Squared =          50.58 using 59 PHA bins.
# Reduced chi-squared =         0.9033 for     56 degrees of freedom
# Null hypothesis probability =   6.792832e-01

Photon flux (15-150 keV)    in 1 sec: 0.564390 ( -0.335026  0.257704 ) ph/cm2/s
Energy fluence (15-150 keV)             : 2.90008e-08 ( -2.87638e-08  2.28482e-08 ) ergs/cm2
Time-resolved spectra
Distribution
T90 vs. Hardness ratio plot
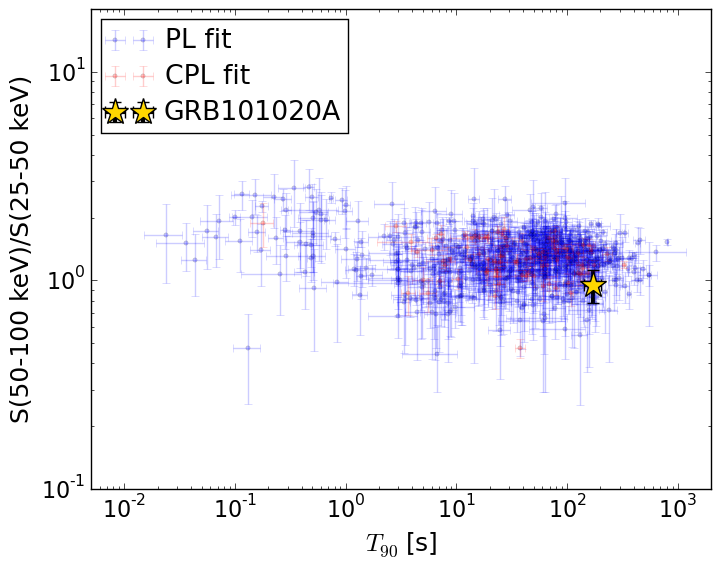
T90                                   = 172.336 sec.
Hardness ratio (energy fluence ratio) = 0.950517271044
S(15-50 keV) vs. S(50-150 keV) plot
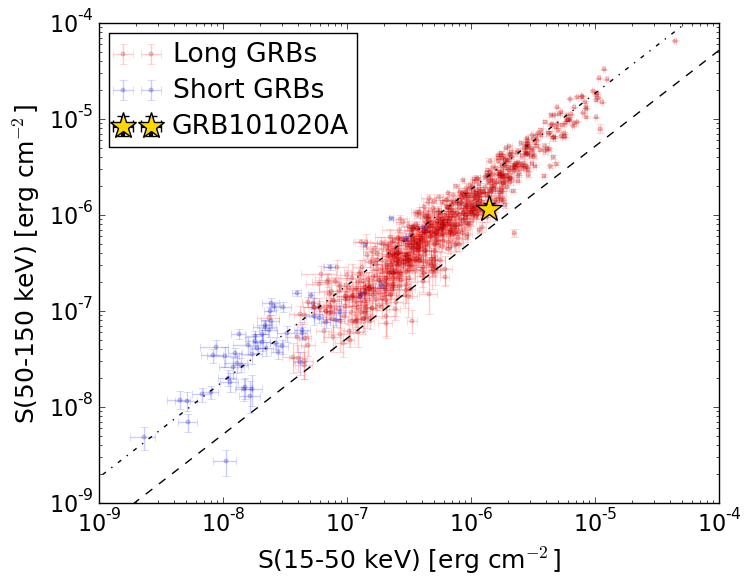
S(15-50 keV)  = 1.3899969e-06
S(50-150 keV) = 1.1656719e-06
The dash-dotted line and the dashed line traces the fluences calculated from the Band function with Epeak = 15 and 150 keV, respectively. Both lines assume a canonical values of alpha = -1 and beta = -2.5.
Mask shadow pattern
IMX = 6.068572353274657E-01, IMY = 5.448124093499392E-01
Spacecraft aspect plot
Bright source in the pre-burst/pre-slew/post-slew images
Pre-burst image of 15-350 keV band
Time interval of the image:
-239.000000 -43.752000

# RAcent  DECcent POSerr Theta    Phi  PeakCts   SNR AngSep     Name
#  [deg]    [deg]    ['] [deg]  [deg]                   [']
244.9718 -15.6404    0.5  47.4 -147.9  10.1508  23.9    0.4	Sco X-1
254.2713  35.3170    8.4  18.5  116.6  -0.2705  -1.4    9.2	Her X-1
268.2948  -1.5291    4.9  46.3  174.8   0.9400   2.4    6.3	SW J1753.5-0127
212.0767  61.0575    2.4  33.7   29.7   1.1771   4.8 ------	UNKNOWN
216.0104   9.6604    3.2  26.0  -91.1   0.8463   3.6 ------	UNKNOWN
212.7780  -6.1133    3.3  41.3 -100.7   3.1369   3.5 ------	UNKNOWN
Pre-slew background subtracted image of 15-350 keV band
Time interval of the image:
-43.752000 164.872000

# RAcent  DECcent POSerr Theta    Phi  PeakCts   SNR AngSep     Name
#  [deg]    [deg]    ['] [deg]  [deg]                   [']
244.8938 -15.6999    6.9  47.4 -147.8  -0.8939  -1.7    6.1	Sco X-1
254.4173  35.4557    7.2  18.7  116.2  -0.4042  -1.6    7.1	Her X-1
268.5208  -1.4857    8.1  46.4  174.6   0.6650   1.4    9.4	SW J1753.5-0127
262.6656 -21.4513    2.5  59.1 -164.6   6.2886   4.6 ------	UNKNOWN
224.4250   6.0101    3.0  25.6 -112.1   1.0757   3.9 ------	UNKNOWN
189.5764  23.1829    0.9  39.2  -41.9   4.8528  13.4 ------	UNKNOWN
204.3943   0.0531    1.8  40.7  -84.9   5.4315   6.3 ------	UNKNOWN
Post-slew image of 15-350 keV band
Time interval of the image:
372.500610 483.020000

# RAcent  DECcent POSerr Theta    Phi  PeakCts   SNR AngSep     Name
#  [deg]    [deg]    ['] [deg]  [deg]                   [']
135.7110 -40.5819    5.0  58.3 -154.6 -10.3533  -2.3    8.5	Vela X-1
170.5675 -60.6752    7.3  39.3 -124.3  -1.9890  -1.6    8.0	Cen X-3
186.3094 -62.8853    6.6  36.6 -112.5   2.3100   1.7   11.8	GX 301-2
264.6490 -44.3265    5.2  44.9  -39.0  -2.8806  -2.2    8.4	4U 1735-44
276.0120 -30.3445    5.8  56.6  -23.7   5.7877   2.0    4.7	H1820-303
303.7116 -26.9518    2.4  55.8    5.9  20.4629   4.9 ------	UNKNOWN
303.4571 -43.9277    2.3  39.1    1.9   5.0689   5.0 ------	UNKNOWN
159.6908 -50.7877    3.1  49.2 -133.1  11.6307   3.8 ------	UNKNOWN