Analysis Summary
Notes:
- 1) No attempt has been made to eliminate the non-significant decimal places.
- 2) This batgrbproduct analysis is done using the HEASARC data.
- 3) This batgrbproduct analysis is using the flight position for the mask-weighting calculation.
======================================================================
                  BAT GRB EVENT DATA PROCESSING REPORT
    Process Script Ver: batgrbproduct v2.46
    Process Start Time: Fri Jan 17 15:20:12 EST 2014
             Host Name: batevent1
   Current Working Dir: /local/data/batevent/batevent_reproc/trigger437016
======================================================================

  Trigger: 00437016      Segment: 000

  BAT Trigger Time: 309613176.128   [s; MET]
      Trigger Stop: 309613176.384   [s; MET]
               UTC: 2010-10-24T11:39:29.826060    [includes UTCF correction]
       Where From?: TDRSS position message

  BAT
    RA: 66.4748790740036   Dec: -77.2476285132087  [deg; J2000]

     Catalogged Source?: NO
     Point Source?:      YES
     GRB Indicated?:     YES    [ by BAT flight software ]
     Image S/N Ratio:    11.55
     Image Trigger?:     NO
     Rate S/N Ratio:     29.698484809835  [ if not an image trigger ]
     Image S/N Ratio:    11.55

  Analysis Position:   [ source = BAT ]
    RA: 66.4748790740036   Dec: -77.2476285132087  [deg; J2000]

  Refined Position:   [ source = BAT pre-slew burst ]
    RA: 66.4759508348627   Dec: -77.2567240509178  [deg; J2000]
        { 04h 25m 54.2s , -77d 15' 24.2" }
         +/- 0.822249953305904 [arcmin] (estimated 90% radius based on SNR)
         +/- 0.234548864085115 [arcmin] (formal 1-sigma fit error)
    SNR: 40.2292041182374

  Angular difference between the analysis and refined position is 0.545917 arcmin

  Partial Coding Fraction: 0.765625    [ including projection effects ]

  Duration
     T90: 18.6919999718666 +/- 0.515379460158422
        Measured from: 0.131999969482422
                   to: 18.823999941349     [s; relative to TRIGTIME]
     T50: 8.83199995756149 +/- 4.80167675503301
        Measured from: 2.04399996995926
                   to: 10.8759999275208     [s; relative to TRIGTIME]


  Fluence
     Peak Flux  (peak 1 second)
        Measured from: 9.39199995994568
                   to: 10.3919999599457     [s; relative to TRIGTIME]
     Total Fluence
        Measured from: -0.252000033855438
                   to: 20.1279999613762     [s; relative to TRIGTIME]

             Band 1     Band 2     Band 3     Band 4
              15-25      25-50     50-100    100-350     keV
 Total     0.831374   1.037085   0.653320   0.071882
           0.030759   0.032190   0.027689   0.022438 [error]
 Peak      0.162509   0.270582   0.200071   0.038624
           0.008779   0.010136   0.009212   0.006172 [error]

     [ fluence units of on-axis counts / fully illuminated detector ]

======================================================================


====== Table of the duration information =============================

        Value   tstart    tstop
T100   20.380   -0.252   20.128
T90    18.692    0.132   18.824
T50     8.832    2.044   10.876
Peak    1.000    9.392   10.392


====== Spectral Analysis Summary =====================================

Model      : spectral model: simple power-law (PL) and cutoff power-law (CPL)
Ph_index   : photon index: E^{Ph_index}
Ph_90err   : 90% error of the photon index
Epeak      : Epeak in keV
Epeak_90err: 90% error of Epeak
Norm       : normalization at 50 keV in both the PL model and CPL model
Nomr_90err : 90% error of the normalization
chi2       : Chi-Squared
dof        : degree of freedo

=== Time-averaged spectral analysis ===
(Best model with acceptable fit: CPL)

Model Ph_index Ph_90err_low Ph_90err_hi  Epeak  Epeak_90err_low  Epeak_90err_hi  Norm       Nomr_90err_low    Norm_90err_hi    chi2    dof
PL      -1.835    -0.072      0.071       -           -               -         8.18e-03     -3.39e-04          3.38e-04      65.860   57
CPL     -1.152    -0.299      0.321       60.344      -6.946        12.169      1.82e-02     -5.28e-03          8.14e-03      49.300   56


=== 1-s peak spectral analysis ===
(Best model with acceptable fit: N/A)

Model Ph_index Ph_90err_low Ph_90err_hi  Epeak  Epeak_90err_low  Epeak_90err_hi  Norm       Nomr_90err_low    Norm_90err_hi    chi2    dof
PL      -1.529     -0.073     0.072       -           -               -         4.50e-02     -2.06e-03          2.06e-03      77.530   57
CPL     -0.422     -0.338     0.367       72.126      -7.291        11.252      1.61e-01     -5.09e-02          8.23e-02      40.740   56


=== Fluence/Peak Flux Summary ===

              Model    Band1     Band2     Band3     Band4     Band5     Total
                       15-25     25-50    50-100    100-350    15-150    15-350    keV
Fluence         PL   2.92e-07  4.37e-07  4.90e-07  1.04e-06  1.53e-06  2.26e-06   erg/cm2
      90%_error_low -1.89e-08 -1.74e-08 -2.72e-08 -1.17e-07 -6.41e-08 -1.41e-07   erg/cm2
      90%_error_hi   1.93e-08  1.74e-08  2.72e-08  1.27e-07  6.43e-08  1.48e-07   erg/cm2
Peak flux       PL   1.91e+00  1.89e+00  1.31e+00  1.43e+00  5.67e+00  6.53e+00   ph/cm2/s
      90%_error_low -1.41e-01 -9.06e-02 -7.26e-02 -1.51e-01 -2.61e-01 -2.95e-01   ph/cm2/s
      90%_error_hi   1.44e-01  9.03e-02  7.24e-02  1.61e-01  2.61e-01  2.95e-01   ph/cm2/s

Fluence        CPL   2.59e-07  4.64e-07  5.02e-07  4.24e-07  1.45e-06  1.65e-06   erg/cm2
      90%_error_low -2.29e-08 -2.10e-08 -2.99e-08 -1.25e-07 -7.19e-08 -1.45e-07   erg/cm2
      90%_error_hi   2.34e-08  2.12e-08  3.00e-08  1.86e-07  7.23e-08  1.97e-07   erg/cm2
Peak flux      CPL   1.55e+00  2.08e+00  1.43e+00  5.36e-01  5.44e+00  5.60e+00   ph/cm2/s
      90%_error_low -1.69e-01 -1.11e-01 -8.74e-02 -1.32e-01 -2.69e-01 -3.03e-01   ph/cm2/s
      90%_error_hi   1.73e-01  1.12e-01  8.83e-02  1.70e-01  2.69e-01  3.13e-01   ph/cm2/s

======================================================================
Image
Pre-slew 15.0-350.0 keV image (Event data)
#   RAcent    DECcent   POSerr    Theta     Phi              Peak Cts       SNR   Name
   66.4760   -77.2567   0.0048    30.9646   178.7838         1.8648005     40.229 TRIG_00437016

Foreground time interval of the image:
 -0.252  10.373 (delta_t =  10.625 [sec])
Background time interval of the image:
-239.128  -0.252 (delta_t = 238.876 [sec])
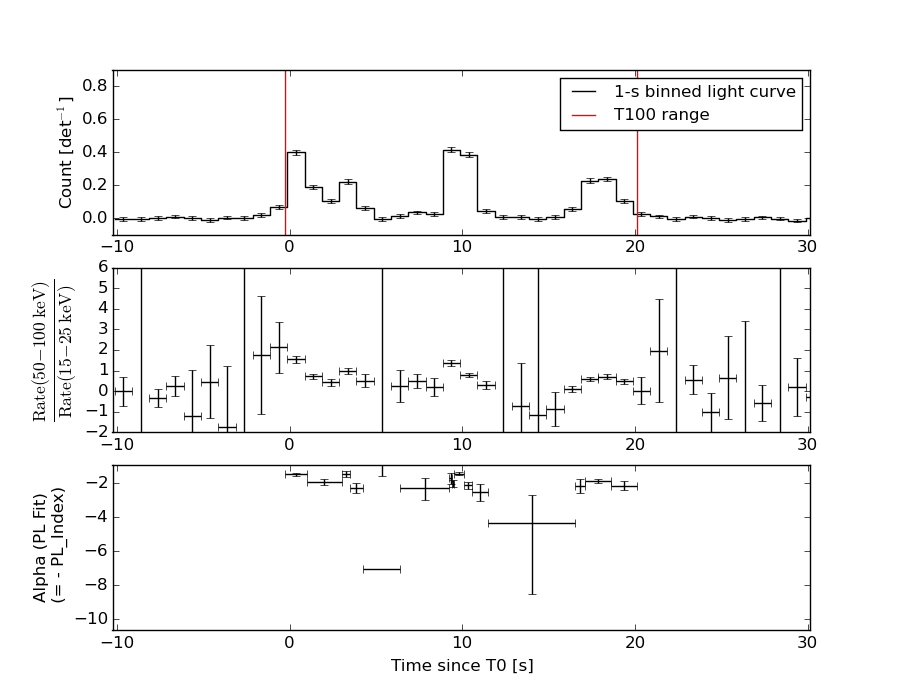
Light Curves
Note: The mask-weighted lightcurves have units of either count/det or counts/sec/det, where a det is 0.4 x 0.4 = 0.16 sq cm.
Full-time range; 1 s binning
Other quick-look light curves:
- 64 ms binning (zoomed)
- 16 ms binning (zoomed)
- 8 ms binning (zoomed)
- 2 ms binning (zoomed)
- SN=5 or 10 s binning (full-time range)
- Raw light curve
Spectra
- 64 ms binning (zoomed)
- 16 ms binning (zoomed)
- 8 ms binning (zoomed)
- 2 ms binning (zoomed)
- SN=5 or 10 s binning (full-time range)
- Raw light curve
Spectra
Notes:
- 1) The fitting includes the systematic errors.
- 2) When the burst includes telescope slew time periods, the fitting uses an average response file made from multiple 5-s response files through out the slew time plus single time preiod for the non-slew times, and weighted by the total counts in the corresponding time period using addrmf. An average response file is needed becuase a spectral fit using the pre-slew DRM will introduce some errors in both a spectral shape and a normalization if the PHA file contains a lot of the slew/post-slew time interval.
- 3) For fits to more complicated models (e.g. a power-law over a cutoff power-law), the BAT team has decided to require a chi-square improvement of more than 6 for each extra dof.
Time averaged spectrum fit using the average DRM
Power-law model
Time interval is from   -0.252 sec. to   20.128 sec.

Spectral model in power-law:
------------------------------------------------------------
Parameters  : value       lower 90%   higher 90%
Photon index: -1.83484     ( -0.0719284   0.071146 )
Norm@50keV  : 8.17967E-03    ( -0.000338913   0.000337552 )
------------------------------------------------------------
#Fit statistic : Chi-Squared =          65.86 using 59 PHA bins.
# Reduced chi-squared =          1.155 for     57 degrees of freedom
# Null hypothesis probability =   1.971461e-01

Photon flux (15-150 keV)    in 20.38 sec: 1.14279 ( -0.04692  0.04703 ) ph/cm2/s
Energy fluence (15-150 keV)             : 1.53343e-06 ( -6.40835e-08  6.4303e-08 ) ergs/cm2
Cutoff power-law model
Time interval is from   -0.252 sec. to   20.128 sec.
Spectral model in the cutoff power-law:
------------------------------------------------------------
Parameters  : value       lower 90%   higher 90%
Photon index: -1.1521     ( -0.299258   0.320906 )
Epeak [keV] : 60.3440      ( -6.94553 12.1691 )
Norm@50keV  : 1.82095E-02    ( -0.00527913   0.00814343 )
------------------------------------------------------------
#Fit statistic : Chi-Squared =          49.30 using 59 PHA bins.
# Reduced chi-squared =         0.8803 for     56 degrees of freedom
# Null hypothesis probability =   7.247078e-01

Photon flux (15-150 keV)    in 20.38 sec: 1.09447 ( -0.05074  0.0509 ) ph/cm2/s
Energy fluence (15-150 keV)             : 1.45363e-06 ( -7.18968e-08  7.22634e-08 ) ergs/cm2
1-s peak spectrum fit
Power-law model
Time interval is from    9.392 sec. to   10.392 sec.

Spectral model in power-law:
------------------------------------------------------------
Parameters  : value       lower 90%   higher 90%
Photon index: -1.5288     ( -0.0725307   0.072084 )
Norm@50keV  : 4.50417E-02    ( -0.00206016   0.00205716 )
------------------------------------------------------------
#Fit statistic : Chi-Squared =          77.53 using 59 PHA bins.
# Reduced chi-squared =          1.360 for     57 degrees of freedom
# Null hypothesis probability =   3.658779e-02

Photon flux (15-150 keV)    in 1 sec: 5.66780 ( -0.26112  0.26136 ) ph/cm2/s
Energy fluence (15-150 keV)             : 4.25412e-07 ( -2.08454e-08  2.09118e-08 ) ergs/cm2
Cutoff power-law model
Time interval is from    9.392 sec. to   10.392 sec.
Spectral model in the cutoff power-law:
------------------------------------------------------------
Parameters  : value       lower 90%   higher 90%
Photon index: -0.422249     ( -0.3384   0.366726 )
Epeak [keV] : 72.1259      ( -7.29081 11.2516 )
Norm@50keV  : 0.161036    ( -0.0509013   0.0822929 )
------------------------------------------------------------
#Fit statistic : Chi-Squared =          40.74 using 59 PHA bins.
# Reduced chi-squared =         0.7275 for     56 degrees of freedom
# Null hypothesis probability =   9.375225e-01

Photon flux (15-150 keV)    in 1 sec: 5.44211 ( -0.26919  0.2694 ) ph/cm2/s
Energy fluence (15-150 keV)             : 2.42913e-07 ( -2.53525e-08  2.25842e-08 ) ergs/cm2
Time-resolved spectra
Distribution
T90 vs. Hardness ratio plot
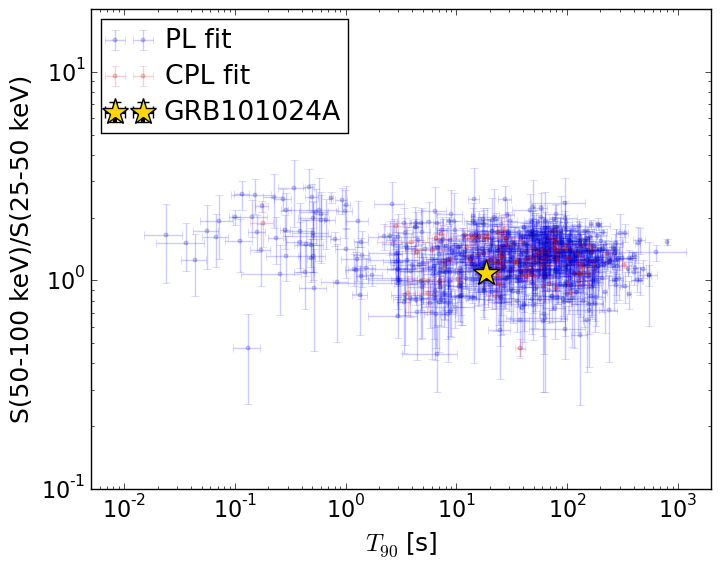
T90                                   = 18.692 sec.
Hardness ratio (energy fluence ratio) = 1.08243052782
S(15-50 keV) vs. S(50-150 keV) plot
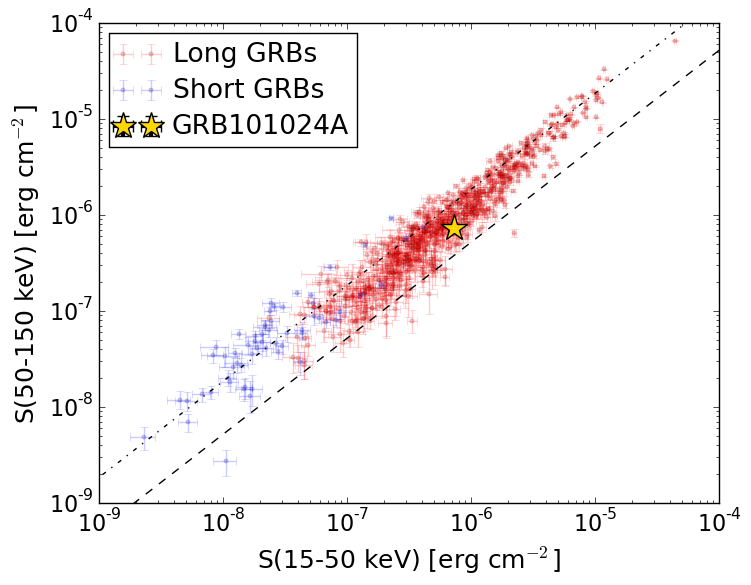
S(15-50 keV)  = 7.226946e-07
S(50-150 keV) = 7.309336e-07
The dash-dotted line and the dashed line traces the fluences calculated from the Band function with Epeak = 15 and 150 keV, respectively. Both lines assume a canonical values of alpha = -1 and beta = -2.5.
Mask shadow pattern
IMX = -5.998838619391779E-01, IMY = -1.273589604537065E-02
Spacecraft aspect plot
Bright source in the pre-burst/pre-slew/post-slew images
Pre-burst image of 15-350 keV band
Time interval of the image:
-239.128000 -0.252000

# RAcent  DECcent POSerr Theta    Phi  PeakCts   SNR AngSep     Name
#  [deg]    [deg]    ['] [deg]  [deg]                   [']
186.6951 -62.6380   32.0  47.1 -129.1  -0.2919  -0.4    8.0	GX 301-2
255.9905 -37.8322    1.5  44.6  -60.5   6.1398   7.9    0.7	4U 1700-377
264.9612 -44.4593    7.4  35.3  -57.4   0.4827   1.6    9.4	4U 1735-44
270.1806 -25.0724   25.3  50.3  -37.9   0.2947   0.5    5.6	GX 5-1
270.4789 -25.6189    7.5  49.7  -37.9  -0.9017  -1.6   12.1	GRS 1758-258
275.7195 -30.4969  312.1  43.4  -34.8  -0.0116  -0.0   13.2	H1820-303
285.1626 -24.7680   22.4  45.7  -20.7   0.1727   0.5   11.5	HT1900.1-2455
263.0286 -33.8398    2.6  45.2  -50.7   2.3943   4.5    2.0	GX 354-0
 11.9400 -44.7592    2.9  35.5  104.2   1.6249   3.9 ------	UNKNOWN
Pre-slew background subtracted image of 15-350 keV band
Time interval of the image:
-0.252000 10.372600

# RAcent  DECcent POSerr Theta    Phi  PeakCts   SNR AngSep     Name
#  [deg]    [deg]    ['] [deg]  [deg]                   [']
186.6053 -62.7634   14.3  47.0 -129.2   0.1402   0.8    1.5	GX 301-2
256.0439 -37.7857    6.3  44.6  -60.5  -0.2986  -1.8    4.4	4U 1700-377
264.6898 -44.3055    3.1  35.6  -57.5   0.2286   3.7    9.0	4U 1735-44
270.3539 -25.0951    8.6  50.2  -37.7  -0.1797  -1.3    3.9	GX 5-1
270.4435 -25.7102    8.8  49.6  -38.0   0.1705   1.3    7.9	GRS 1758-258
276.1243 -30.2360    5.1  43.5  -34.2  -0.1629  -2.3   13.0	H1820-303
285.1042 -24.7713   51.9  45.7  -20.8  -0.0155  -0.2    9.7	HT1900.1-2455
262.8462 -33.7719    5.1  45.3  -50.8  -0.2637  -2.3    8.1	GX 354-0
 66.4759 -77.2567    0.3  31.0  178.8   1.8647  40.2 ------	UNKNOWN
288.7990 -41.1448    2.2  29.3  -25.8   0.2246   5.3 ------	UNKNOWN
280.0401 -19.8748    2.8  51.8  -24.6   0.4232   4.2 ------	UNKNOWN
189.0198 -61.7762    2.6  47.4 -127.2   0.8161   4.4 ------	UNKNOWN
Post-slew image of 15-350 keV band
Time interval of the image:
61.372600 713.272600

# RAcent  DECcent POSerr Theta    Phi  PeakCts   SNR AngSep     Name
#  [deg]    [deg]    ['] [deg]  [deg]                   [']
135.6565 -40.5939   10.3  46.0 -152.6   0.9285   1.1    6.3	Vela X-1
170.2791 -60.6285    1.5  34.5 -110.3   5.2411   7.7    1.1	Cen X-3
186.6178 -62.7406    4.2  35.3  -96.4   2.5595   2.8    2.1	GX 301-2
 92.0062 -25.4511    3.1  53.2  156.0   7.1981   3.8 ------	UNKNOWN
  2.5478 -61.7493    2.5  25.2   38.1   2.0501   4.6 ------	UNKNOWN
150.2312 -51.6255    3.2  38.8 -133.2   2.3847   3.6 ------	UNKNOWN
194.6300 -58.1504    5.1  40.8  -92.5   4.6149   2.3 ------	UNKNOWN