Analysis Summary
Notes:
- 1) No attempt has been made to eliminate the non-significant decimal places.
- 2) This batgrbproduct analysis is done using the HEASARC data.
- 3) This batgrbproduct analysis is using the flight position for the mask-weighting calculation.
======================================================================
BAT GRB EVENT DATA PROCESSING REPORT
Process Script Ver: batgrbproduct v2.46
Process Start Time: Fri Jan 17 15:08:02 EST 2014
Host Name: batevent1
Current Working Dir: /local/data/batevent/batevent_reproc/trigger440285
======================================================================
Trigger: 00440285 Segment: 000
BAT Trigger Time: 313930169.536 [s; MET]
Trigger Stop: 313930170.56 [s; MET]
UTC: 2010-12-13T10:49:23.075680 [includes UTCF correction]
Where From?: TDRSS position message
BAT
RA: 241.286254814334 Dec: 21.9147936617102 [deg; J2000]
Catalogged Source?: NO
Point Source?: YES
GRB Indicated?: YES [ by BAT flight software ]
Image S/N Ratio: 7.43
Image Trigger?: NO
Rate S/N Ratio: 19.723082923316 [ if not an image trigger ]
Image S/N Ratio: 7.43
Analysis Position: [ source = BAT ]
RA: 241.286254814334 Dec: 21.9147936617102 [deg; J2000]
Refined Position: [ source = BAT pre-slew burst ]
RA: 241.297627852399 Dec: 21.9060974413948 [deg; J2000]
{ 16h 05m 11.4s , +21d 54' 22.0" }
+/- 1.06093820197215 [arcmin] (estimated 90% radius based on SNR)
+/- 0.362575868557989 [arcmin] (formal 1-sigma fit error)
SNR: 27.9523454409484
Angular difference between the analysis and refined position is 0.820398 arcmin
Partial Coding Fraction: 0.3164062 [ including projection effects ]
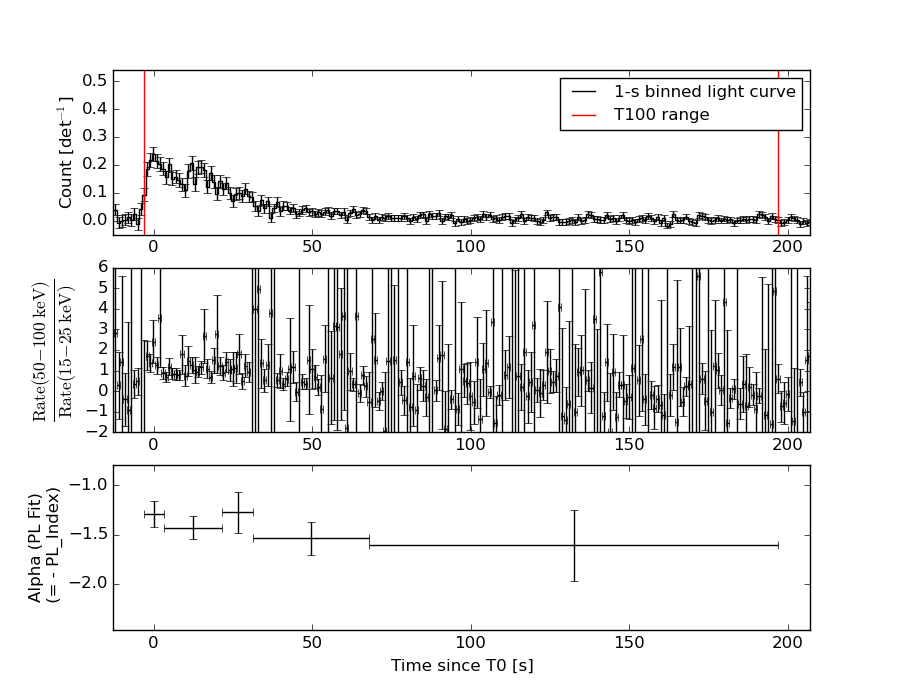
Duration
T90: 131.120000064373 +/- 41.9589506123627
Measured from: -0.960000038146973
to: 130.160000026226 [s; relative to TRIGTIME]
T50: 34.0160000324249 +/- 4.85960329099282
Measured from: 6.59200000762939
to: 40.6080000400543 [s; relative to TRIGTIME]
Fluence
Peak Flux (peak 1 second)
Measured from: -0.300000011920929
to: 0.699999988079071 [s; relative to TRIGTIME]
Total Fluence
Measured from: -2.96000003814697
to: 197.055999994278 [s; relative to TRIGTIME]
Band 1 Band 2 Band 3 Band 4
15-25 25-50 50-100 100-350 keV
Total 1.991788 2.467060 2.233926 0.720910
0.105764 0.108541 0.097340 0.084195 [error]
Peak 0.042659 0.096365 0.094159 0.035148
0.013176 0.013921 0.013205 0.011077 [error]
[ fluence units of on-axis counts / fully illuminated detector ]
======================================================================
====== Table of the duration information =============================
Value tstart tstop
T100 200.016 -2.960 197.056
T90 131.120 -0.960 130.160
T50 34.016 6.592 40.608
Peak 1.000 -0.300 0.700
====== Spectral Analysis Summary =====================================
Model : spectral model: simple power-law (PL) and cutoff power-law (CPL)
Ph_index : photon index: E^{Ph_index}
Ph_90err : 90% error of the photon index
Epeak : Epeak in keV
Epeak_90err: 90% error of Epeak
Norm : normalization at 50 keV in both the PL model and CPL model
Nomr_90err : 90% error of the normalization
chi2 : Chi-Squared
dof : degree of freedo
=== Time-averaged spectral analysis ===
(Best model with acceptable fit: PL)
Model Ph_index Ph_90err_low Ph_90err_hi Epeak Epeak_90err_low Epeak_90err_hi Norm Nomr_90err_low Norm_90err_hi chi2 dof
PL -1.426 -0.086 0.086 - - - 2.59e-03 -1.17e-04 1.17e-04 51.130 57
CPL -1.426 -0.083 0.093 9999.360 -9999.360 -9999.360 2.60e-03 -1.14e-04 4.94e-04 51.170 56
=== 1-s peak spectral analysis ===
(Best model with acceptable fit: PL)
Model Ph_index Ph_90err_low Ph_90err_hi Epeak Epeak_90err_low Epeak_90err_hi Norm Nomr_90err_low Norm_90err_hi chi2 dof
PL -1.174 -0.242 0.249 - - - 1.94e-02 -2.98e-03 2.98e-03 57.900 57
CPL 0.378 -1.226 1.753 84.572 -20.523 106.242 9.95e-02 -9.95e-02 5.01e-01 52.910 56
=== Fluence/Peak Flux Summary ===
Model Band1 Band2 Band3 Band4 Band5 Total
15-25 25-50 50-100 100-350 15-150 15-350 keV
Fluence PL 6.18e-07 1.19e-06 1.77e-06 5.68e-06 4.99e-06 9.25e-06 erg/cm2
90%_error_low -5.60e-08 -6.31e-08 -9.82e-08 -6.96e-07 -2.40e-07 -7.52e-07 erg/cm2
90%_error_hi 5.79e-08 6.27e-08 9.76e-08 7.61e-07 2.41e-07 8.04e-07 erg/cm2
Peak flux PL 5.84e-01 7.14e-01 6.33e-01 9.67e-01 2.27e+00 2.90e+00 ph/cm2/s
90%_error_low -1.64e-01 -1.34e-01 -1.04e-01 -2.87e-01 -3.65e-01 -4.48e-01 ph/cm2/s
90%_error_hi 1.82e-01 1.33e-01 1.03e-01 3.53e-01 3.67e-01 4.52e-01 ph/cm2/s
Fluence CPL 6.18e-07 1.19e-06 1.77e-06 5.65e-06 4.99e-06 9.33e-06 erg/cm2
90%_error_low N/A -6.33e-08 N/A N/A -2.40e-07 -1.56e-06 erg/cm2
90%_error_hi N/A 6.27e-08 N/A N/A 2.41e-07 2.61e-07 erg/cm2
Peak flux CPL 4.00e-01 7.78e-01 7.38e-01 3.08e-01 2.14e+00 2.22e+00 ph/cm2/s
90%_error_low -1.87e-01 -1.60e-01 -1.33e-01 -1.91e-01 -3.77e-01 -4.31e-01 ph/cm2/s
90%_error_hi 2.20e-01 1.64e-01 1.38e-01 4.25e-01 3.81e-01 5.29e-01 ph/cm2/s
======================================================================
Image
Pre-slew 15.0-350.0 keV image (Event data)
#   RAcent    DECcent   POSerr    Theta     Phi              Peak Cts       SNR   Name
  241.2976    21.9061   0.0069    46.1669   -30.7733         3.2816359     27.952 TRIG_00440285

Foreground time interval of the image:
 -2.960  14.365 (delta_t =  17.325 [sec])
Background time interval of the image:
-239.536  -2.960 (delta_t = 236.576 [sec])
Light Curves
Note: The mask-weighted lightcurves have units of either count/det or counts/sec/det, where a det is 0.4 x 0.4 = 0.16 sq cm.
Full-time range; 1 s binning
Other quick-look light curves:
- 64 ms binning (zoomed)
- 16 ms binning (zoomed)
- 8 ms binning (zoomed)
- 2 ms binning (zoomed)
- SN=5 or 10 s binning (full-time range)
- Raw light curve
Spectra
- 64 ms binning (zoomed)
- 16 ms binning (zoomed)
- 8 ms binning (zoomed)
- 2 ms binning (zoomed)
- SN=5 or 10 s binning (full-time range)
- Raw light curve
Spectra
Notes:
- 1) The fitting includes the systematic errors.
- 2) When the burst includes telescope slew time periods, the fitting uses an average response file made from multiple 5-s response files through out the slew time plus single time preiod for the non-slew times, and weighted by the total counts in the corresponding time period using addrmf. An average response file is needed becuase a spectral fit using the pre-slew DRM will introduce some errors in both a spectral shape and a normalization if the PHA file contains a lot of the slew/post-slew time interval.
- 3) For fits to more complicated models (e.g. a power-law over a cutoff power-law), the BAT team has decided to require a chi-square improvement of more than 6 for each extra dof.
Time averaged spectrum fit using the average DRM
Power-law model
Time interval is from   -2.960 sec. to  197.056 sec.

Spectral model in power-law:
------------------------------------------------------------
Parameters  : value       lower 90%   higher 90%
Photon index: -1.42561     ( -0.0860033   0.0861292 )
Norm@50keV  : 2.59488E-03    ( -0.000117211   0.000117211 )
------------------------------------------------------------
#Fit statistic : Chi-Squared =          51.13 using 59 PHA bins.
# Reduced chi-squared =         0.8970 for     57 degrees of freedom
# Null hypothesis probability =   6.939395e-01

Photon flux (15-150 keV)    in 200 sec: 0.317901 ( -0.015709  0.015764 ) ph/cm2/s
Energy fluence (15-150 keV)             : 4.98976e-06 ( -2.40128e-07  2.40822e-07 ) ergs/cm2
Cutoff power-law model
Time interval is from   -2.960 sec. to  197.056 sec.
Spectral model in the cutoff power-law:
------------------------------------------------------------
Parameters  : value       lower 90%   higher 90%
Photon index: -1.42607     ( -0.0833598   0.0925807 )
Epeak [keV] : 9999.36      ( -9999.36 -9999.36 )
Norm@50keV  : 2.60028E-03    ( -0.000117626   0.000490651 )
------------------------------------------------------------
#Fit statistic : Chi-Squared =          51.17 using 59 PHA bins.
# Reduced chi-squared =         0.9138 for     56 degrees of freedom
# Null hypothesis probability =   6.577414e-01

Photon flux (15-150 keV)    in 200 sec: 0.317847 ( -0.015719  0.015758 ) ph/cm2/s
Energy fluence (15-150 keV)             : 4.98872e-06 ( -2.404e-07  2.40778e-07 ) ergs/cm2
1-s peak spectrum fit
Power-law model
Time interval is from   -0.300 sec. to    0.700 sec.

Spectral model in power-law:
------------------------------------------------------------
Parameters  : value       lower 90%   higher 90%
Photon index: -1.17426     ( -0.241877   0.249532 )
Norm@50keV  : 1.93871E-02    ( -0.00298383   0.00297525 )
------------------------------------------------------------
#Fit statistic : Chi-Squared =          57.90 using 59 PHA bins.
# Reduced chi-squared =          1.016 for     57 degrees of freedom
# Null hypothesis probability =   4.418486e-01

Photon flux (15-150 keV)    in 1 sec: 2.26781 ( -0.3646  0.36733 ) ph/cm2/s
Energy fluence (15-150 keV)             : 1.98166e-07 ( -3.14605e-08  3.1597e-08 ) ergs/cm2
Cutoff power-law model
Time interval is from   -0.300 sec. to    0.700 sec.
Spectral model in the cutoff power-law:
------------------------------------------------------------
Parameters  : value       lower 90%   higher 90%
Photon index: 0.378087     ( -1.22556   1.75292 )
Epeak [keV] : 84.5716      ( -20.523 106.243 )
Norm@50keV  : 9.95325E-02    ( -0.0995325   0.500902 )
------------------------------------------------------------
#Fit statistic : Chi-Squared =          52.91 using 59 PHA bins.
# Reduced chi-squared =         0.9448 for     56 degrees of freedom
# Null hypothesis probability =   5.926838e-01

Photon flux (15-150 keV)    in 1 sec: 2.13832 ( -0.37713  0.38054 ) ph/cm2/s
Energy fluence (15-150 keV)             : 1.84306e-07 ( -3.51434e-08  3.46919e-08 ) ergs/cm2
Time-resolved spectra
Distribution
T90 vs. Hardness ratio plot
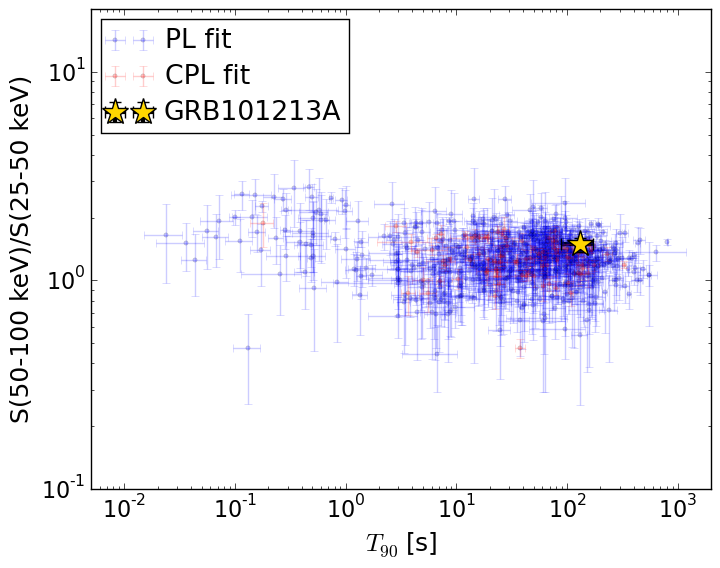
T90                                   = 131.12 sec.
Hardness ratio (energy fluence ratio) = 1.48908701446
S(15-50 keV) vs. S(50-150 keV) plot
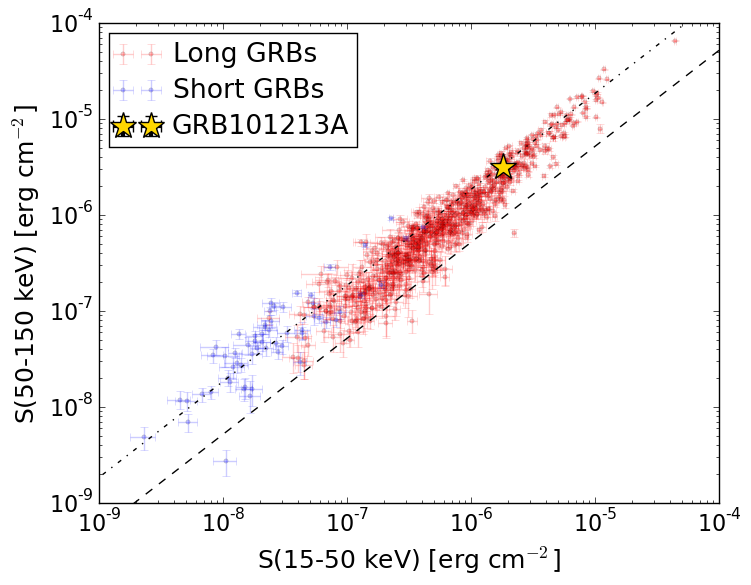
S(15-50 keV)  = 1.8066574e-06
S(50-150 keV) = 3.183126e-06
The dash-dotted line and the dashed line traces the fluences calculated from the Band function with Epeak = 15 and 150 keV, respectively. Both lines assume a canonical values of alpha = -1 and beta = -2.5.
Mask shadow pattern
IMX = 8.949294185747902E-01, IMY = 5.329194475287095E-01
Spacecraft aspect plot
Bright source in the pre-burst/pre-slew/post-slew images
Pre-burst image of 15-350 keV band
Time interval of the image:
-239.536000 -2.960000

# RAcent  DECcent POSerr Theta    Phi  PeakCts   SNR AngSep     Name
#  [deg]    [deg]    ['] [deg]  [deg]                   [']
254.3175  35.2757    9.7  37.7   -7.6   0.3328   1.2    7.9	Her X-1
268.3534  -1.3978    3.0  26.2  -82.9   1.1428   3.8    3.4	SW J1753.5-0127
274.1010 -14.0536    8.2  32.3 -108.7   0.4441   1.4    5.6	GX 17+2
285.0155 -24.8920    5.6  39.6 -131.1   0.7740   2.1    2.0	HT1900.1-2455
288.8000  10.9410    1.1   3.6 -127.1   1.9509  10.2    0.3	GRS 1915+105
299.4625  35.1904    2.7  22.6   64.3   1.0996   4.3    6.3	Cyg X-1
308.1202  40.9471    3.3  31.1   70.5   1.3480   3.4    0.6	Cyg X-3
335.8272   0.7519    3.3  47.8  145.0   2.9922   3.5 ------	UNKNOWN
323.1938 -23.8253    2.5  50.5 -178.6   2.4002   4.7 ------	UNKNOWN
250.3046  39.5567    3.0  42.4   -3.6   1.1931   3.8 ------	UNKNOWN
293.1751  -9.3813    2.6  24.1 -146.4   0.9217   4.4 ------	UNKNOWN
272.3943   1.5450    3.0  21.2  -83.4   0.8925   3.8 ------	UNKNOWN
263.7553 -18.0129    3.9  41.2  -98.6   2.9455   3.0 ------	UNKNOWN
256.7516 -10.7068    3.0  41.1  -83.5   3.6090   3.8 ------	UNKNOWN
Pre-slew background subtracted image of 15-350 keV band
Time interval of the image:
-2.960000 14.364600

# RAcent  DECcent POSerr Theta    Phi  PeakCts   SNR AngSep     Name
#  [deg]    [deg]    ['] [deg]  [deg]                   [']
254.4664  35.4814   10.6  37.7   -7.2   0.0881   1.1    8.3	Her X-1
268.3410  -1.5237    7.1  26.3  -83.1   0.1206   1.6    4.6	SW J1753.5-0127
274.2194 -14.0332    0.0  32.3 -108.9  -0.1136  -1.3   12.4	GX 17+2
285.0357 -24.9176  249.7  39.6 -131.1   0.0048   0.0    0.2	HT1900.1-2455
288.6615  10.9860    4.6   3.6 -124.8  -0.1287  -2.5    8.4	GRS 1915+105
299.7873  35.2399    6.1  22.7   64.9   0.1316   1.9    9.9	Cyg X-1
308.2372  40.9000    5.6  31.1   70.7  -0.1913  -2.1    6.6	Cyg X-3
299.4663  23.2029    2.6  12.9   88.4   0.2606   4.4 ------	UNKNOWN
247.2288  24.2504    1.8  40.9  -26.9   0.5441   6.3 ------	UNKNOWN
248.4816  22.5823    2.5  39.6  -29.3   0.3844   4.6 ------	UNKNOWN
241.2976  21.9061    0.4  46.2  -30.8   3.2818  28.0 ------	UNKNOWN
Post-slew image of 15-350 keV band
Time interval of the image:
94.164600 651.964600

# RAcent  DECcent POSerr Theta    Phi  PeakCts   SNR AngSep     Name
#  [deg]    [deg]    ['] [deg]  [deg]                   [']
244.9785 -15.6371    0.6  37.7  -71.9  16.9568  18.6    0.2	Sco X-1
254.5756  35.5212    0.0  17.9  151.5  -0.6049  -1.5   12.2	Her X-1
268.3083  -1.4648    2.9  35.2 -118.0   2.8127   4.0    3.7	SW J1753.5-0127
288.7915  10.9283    1.9  46.7 -150.4   4.9617   5.9    1.1	GRS 1915+105
299.4856  35.1212    5.2  52.1  175.7   2.8807   2.2    7.0	Cyg X-1
230.8471  56.4003    3.7  35.4  104.0   2.9843   3.1 ------	UNKNOWN
304.9910  32.0950    4.0  56.9  179.0   7.9233   2.9 ------	UNKNOWN
211.1365   2.9426    3.3  34.8   -4.7   1.7520   3.4 ------	UNKNOWN
241.5542   7.7427    2.5  14.1  -67.2   1.7026   4.6 ------	UNKNOWN
210.3307 -14.7713    2.8  47.6  -23.7   3.0768   4.2 ------	UNKNOWN
258.8019 -15.1756    3.2  40.8  -92.4   6.3885   3.6 ------	UNKNOWN