Analysis Summary
Notes:
- 1) No attempt has been made to eliminate the non-significant decimal places.
- 2) This batgrbproduct analysis is done using the HEASARC data.
- 3) This batgrbproduct analysis is using the flight position for the mask-weighting calculation.
======================================================================
BAT GRB EVENT DATA PROCESSING REPORT
Process Script Ver: batgrbproduct v2.46
Process Start Time: Fri Jan 17 15:04:04 EST 2014
Host Name: batevent1
Current Working Dir: /local/data/batevent/batevent_reproc/trigger440606
======================================================================
Trigger: 00440606 Segment: 000
BAT Trigger Time: 314418696.236 [s; MET]
Trigger Stop: 314418696.3 [s; MET]
UTC: 2010-12-19T02:31:29.757600 [includes UTCF correction]
Where From?: (*SHORT BURST*) TDRSS scaled map message
BAT
RA: 74.6157044200633 Dec: -2.53400569829485 [deg; J2000]
Catalogged Source?: NO
Point Source?: YES
GRB Indicated?: YES [ by BAT flight software ]
Image S/N Ratio: 11.15
Image Trigger?: NO
Rate S/N Ratio: 102.946588093049 [ if not an image trigger ]
Image S/N Ratio: 11.15
Analysis Position: [ source = BAT ]
RA: 74.6157044200633 Dec: -2.53400569829485 [deg; J2000]
Refined Position: [ source = BAT pre-slew burst ]
RA: 74.5870136995784 Dec: -2.52671561369426 [deg; J2000]
{ 04h 58m 20.9s , -02d 31' 36.2" }
+/- 0.971724998639332 [arcmin] (estimated 90% radius based on SNR)
+/- 0.295437047988091 [arcmin] (formal 1-sigma fit error)
SNR: 31.6893665324003
Angular difference between the analysis and refined position is 1.774518 arcmin
Partial Coding Fraction: 0.9453125 [ including projection effects ]
Duration
T90: 0.827999949455261 +/- 0.180399565294848
Measured from: 0.00400000810623169
to: 0.831999957561493 [s; relative to TRIGTIME]
T50: 0.411999940872192 +/- 0.030463099373373
Measured from: 0.0799999833106995
to: 0.491999924182892 [s; relative to TRIGTIME]
Fluence
Peak Flux (peak 1 second)
Measured from: -0.015999972820282
to: 0.984000027179718 [s; relative to TRIGTIME]
Total Fluence
Measured from: -0.015999972820282
to: 1.10799998044968 [s; relative to TRIGTIME]
Band 1 Band 2 Band 3 Band 4
15-25 25-50 50-100 100-350 keV
Total 0.080413 0.162147 0.208164 0.096495
0.007451 0.009014 0.009532 0.008416 [error]
Peak 0.078230 0.154904 0.203117 0.097458
0.007191 0.008746 0.009356 0.008288 [error]
[ fluence units of on-axis counts / fully illuminated detector ]
======================================================================
====== Table of the duration information =============================
Value tstart tstop
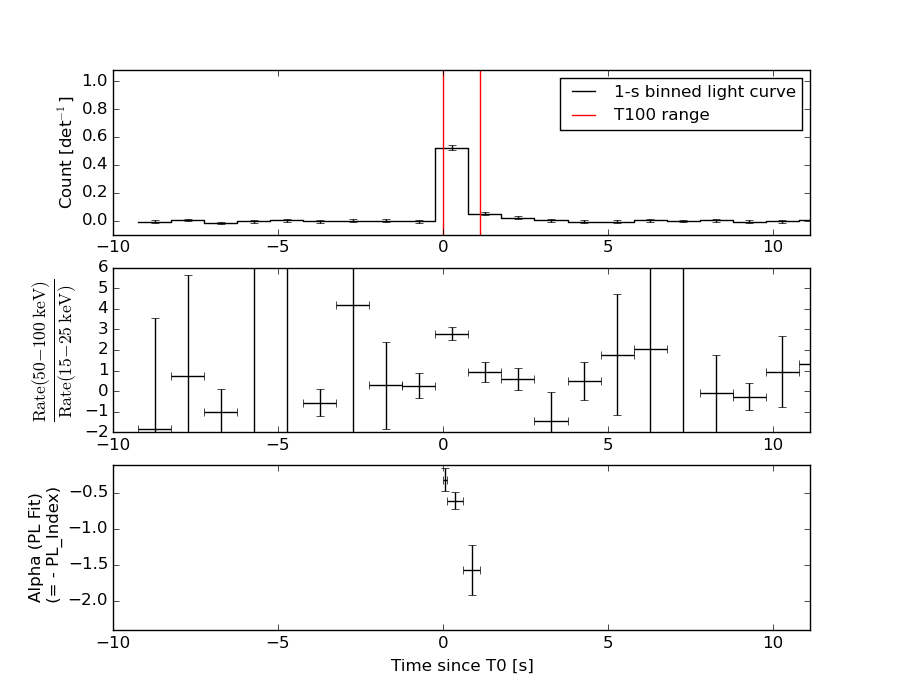
T100 1.124 -0.016 1.108
T90 0.828 0.004 0.832
T50 0.412 0.080 0.492
Peak 1.000 -0.016 0.984
====== Spectral Analysis Summary =====================================
Model : spectral model: simple power-law (PL) and cutoff power-law (CPL)
Ph_index : photon index: E^{Ph_index}
Ph_90err : 90% error of the photon index
Epeak : Epeak in keV
Epeak_90err: 90% error of Epeak
Norm : normalization at 50 keV in both the PL model and CPL model
Nomr_90err : 90% error of the normalization
chi2 : Chi-Squared
dof : degree of freedo
=== Time-averaged spectral analysis ===
(Best model with acceptable fit: N/A)
Model Ph_index Ph_90err_low Ph_90err_hi Epeak Epeak_90err_low Epeak_90err_hi Norm Nomr_90err_low Norm_90err_hi chi2 dof
PL -0.625 -0.098 0.101 - - - 3.06e-02 -1.71e-03 1.69e-03 65.440 57
CPL -0.621 -0.095 0.106 9999.340 -9999.340 -9999.340 3.08e-02 -1.60e-03 7.30e-03 65.510 56
=== 1-s peak spectral analysis ===
(Best model with acceptable fit: N/A)
Model Ph_index Ph_90err_low Ph_90err_hi Epeak Epeak_90err_low Epeak_90err_hi Norm Nomr_90err_low Norm_90err_hi chi2 dof
PL -0.603 -0.100 0.102 - - - 3.32e-02 -1.88e-03 1.86e-03 67.640 57
CPL -0.512 -0.192 0.190 997.217 -997.217 -997.217 3.62e-02 -4.51e-03 4.42e-03 68.650 56
=== Fluence/Peak Flux Summary ===
Model Band1 Band2 Band3 Band4 Band5 Total
15-25 25-50 50-100 100-350 15-150 15-350 keV
Fluence PL 1.95e-08 6.15e-08 1.59e-07 1.19e-06 4.34e-07 1.43e-06 erg/cm2
90%_error_low -2.35e-09 -4.45e-09 -8.71e-09 -1.55e-07 -2.48e-08 -1.58e-07 erg/cm2
90%_error_hi 2.47e-09 4.40e-09 8.67e-09 1.72e-07 2.49e-08 1.75e-07 erg/cm2
Peak flux PL 1.20e-04 5.81e-03 2.61e-02 3.98e+00 2.80e-01 3.18e+00 ph/cm2/s
90%_error_low N/A -2.95e-04 N/A N/A 2.10e-03 N/A ph/cm2/s
90%_error_hi N/A 1.38e-03 N/A N/A 7.32e-02 N/A ph/cm2/s
Fluence CPL 1.96e-08 6.14e-08 1.57e-07 1.18e-06 4.36e-07 1.30e-06 erg/cm2
90%_error_low N/A -3.07e-09 N/A -3.26e-07 N/A -1.89e-07 erg/cm2
90%_error_hi N/A 5.46e-09 N/A 1.77e-07 N/A 2.02e-07 erg/cm2
Peak flux CPL 5.81e-01 1.01e+00 1.33e+00 3.51e+00 3.87e+00 6.98e+00 ph/cm2/s
90%_error_low N/A N/A N/A N/A -2.04e-01 N/A ph/cm2/s
90%_error_hi N/A N/A N/A N/A 2.04e-01 N/A ph/cm2/s
======================================================================
Image
Pre-slew 15.0-350.0 keV image (Event data)
#   RAcent    DECcent   POSerr    Theta     Phi              Peak Cts       SNR   Name
   74.5870    -2.5267   0.0061    14.3278    32.8673         0.5954407     31.689 TRIG_00440606

Foreground time interval of the image:
 -0.016   1.108 (delta_t =   1.124 [sec])
Background time interval of the image:
-97.735  -0.016 (delta_t =  97.719 [sec])
Light Curves
Note: The mask-weighted lightcurves have units of either count/det or counts/sec/det, where a det is 0.4 x 0.4 = 0.16 sq cm.
Full-time range; 1 s binning
Other quick-look light curves:
- 64 ms binning (zoomed)
- 16 ms binning (zoomed)
- 8 ms binning (zoomed)
- 2 ms binning (zoomed)
- SN=5 or 10 s binning (full-time range)
- Raw light curve
Spectra
- 64 ms binning (zoomed)
- 16 ms binning (zoomed)
- 8 ms binning (zoomed)
- 2 ms binning (zoomed)
- SN=5 or 10 s binning (full-time range)
- Raw light curve
Spectra
Notes:
- 1) The fitting includes the systematic errors.
- 2) When the burst includes telescope slew time periods, the fitting uses an average response file made from multiple 5-s response files through out the slew time plus single time preiod for the non-slew times, and weighted by the total counts in the corresponding time period using addrmf. An average response file is needed becuase a spectral fit using the pre-slew DRM will introduce some errors in both a spectral shape and a normalization if the PHA file contains a lot of the slew/post-slew time interval.
- 3) For fits to more complicated models (e.g. a power-law over a cutoff power-law), the BAT team has decided to require a chi-square improvement of more than 6 for each extra dof.
Time averaged spectrum fit using the average DRM
Power-law model
Time interval is from   -0.016 sec. to    1.108 sec.

Spectral model in power-law:
------------------------------------------------------------
Parameters  : value       lower 90%   higher 90%
Photon index: -0.625101     ( -0.0982707   0.100831 )
Norm@50keV  : 3.05638E-02    ( -0.00170826   0.00169297 )
------------------------------------------------------------
#Fit statistic : Chi-Squared =          65.44 using 59 PHA bins.
# Reduced chi-squared =          1.148 for     57 degrees of freedom
# Null hypothesis probability =   2.070765e-01

Photon flux (15-150 keV)    in 1.124 sec: 9.06882E-02 (    ) ph/cm2/s
Energy fluence (15-150 keV)             : 4.34136e-07 ( -2.48223e-08  2.49207e-08 ) ergs/cm2
Cutoff power-law model

Time interval is from   -0.016 sec. to    1.108 sec.
Spectral model in the cutoff power-law:
------------------------------------------------------------
Parameters  : value       lower 90%   higher 90%
Photon index: -0.620753     ( -0.0957439   0.105183 )
Epeak [keV] : 9999.34      ( -9999.36 -9999.36 )
Norm@50keV  : 3.08103E-02    ( -0.00162199   0.00728106 )
------------------------------------------------------------
#Fit statistic : Chi-Squared =          65.51 using 59 PHA bins.
# Reduced chi-squared =          1.170 for     56 degrees of freedom
# Null hypothesis probability =   1.801315e-01

Photon flux (15-150 keV)    in 1.124 sec: 3.55699 ( -0.18622  0.18628 ) ph/cm2/s
Energy fluence (15-150 keV)             : 4.36211e-07 ( 0  0 ) ergs/cm2
1-s peak spectrum fit
Power-law model
Time interval is from   -0.016 sec. to    0.984 sec.

Spectral model in power-law:
------------------------------------------------------------
Parameters  : value       lower 90%   higher 90%
Photon index: -0.603045     ( -0.0995965   0.102267 )
Norm@50keV  : 3.31863E-02    ( -0.00187942   0.00186145 )
------------------------------------------------------------
#Fit statistic : Chi-Squared =          67.64 using 59 PHA bins.
# Reduced chi-squared =          1.187 for     57 degrees of freedom
# Null hypothesis probability =   1.581903e-01

Photon flux (15-150 keV)    in 1 sec: 0.280324 0.295781 0.256582 0.221264 0.191341 0.166296 0.145553 0.128519 (    ) ph/cm2/s
Energy fluence (15-150 keV)             : 4.23809e-07 ( -2.44716e-08  2.45542e-08 ) ergs/cm2
Cutoff power-law model

Time interval is from   -0.016 sec. to    0.984 sec.
Spectral model in the cutoff power-law:
------------------------------------------------------------
Parameters  : value       lower 90%   higher 90%
Photon index: -0.594483     ( -0.191862   0.189822 )
Epeak [keV] : 9998.65      ( -9998.67 -9998.67 )
Norm@50keV  : 3.34608E-02    ( -0.00175575   0.00717119 )
------------------------------------------------------------
#Fit statistic : Chi-Squared =          67.72 using 59 PHA bins.
# Reduced chi-squared =          1.209 for     56 degrees of freedom
# Null hypothesis probability =   1.355845e-01

Photon flux (15-150 keV)    in 1 sec: 3.87200 ( -0.20407  0.20419 ) ph/cm2/s
Energy fluence (15-150 keV)             : 4.26265e-07 ( -2.70931e-08  2.19331e-08 ) ergs/cm2
Time-resolved spectra
Distribution
T90 vs. Hardness ratio plot
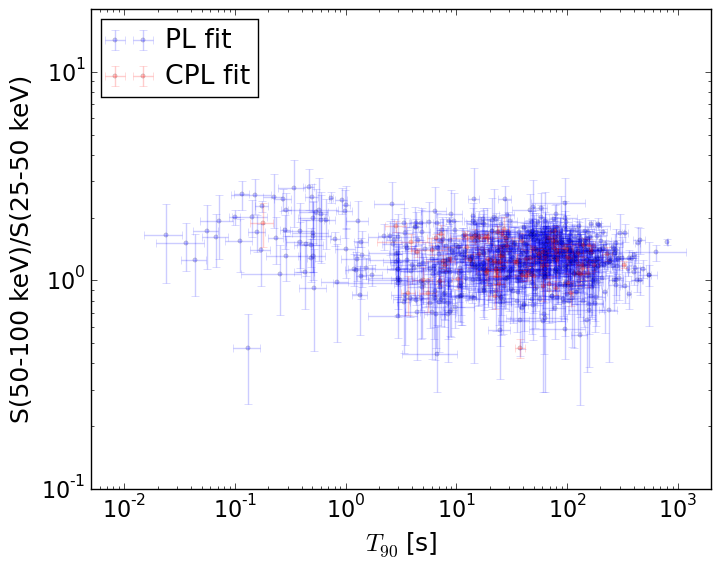
T90                                   = N/A sec.
Hardness ratio (energy fluence ratio) = N/A
S(15-50 keV) vs. S(50-150 keV) plot
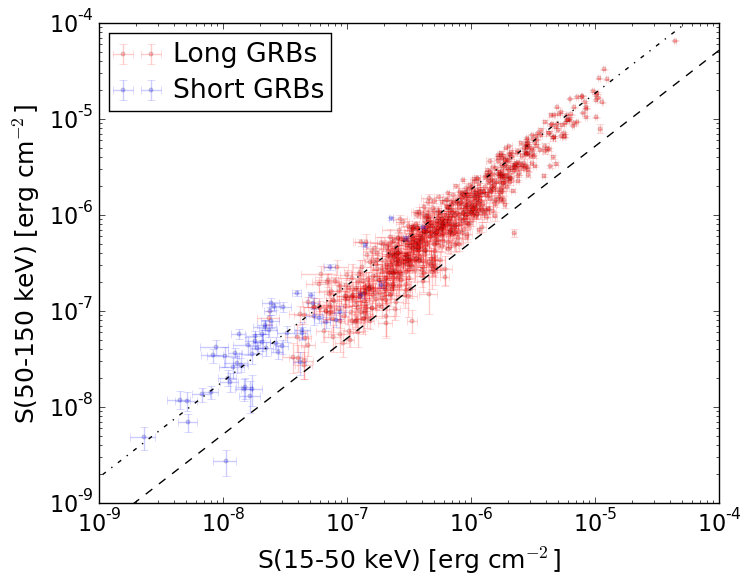
S(15-50 keV)  = N/A
S(50-150 keV) = N/A
The dash-dotted line and the dashed line traces the fluences calculated from the Band function with Epeak = 15 and 150 keV, respectively. Both lines assume a canonical values of alpha = -1 and beta = -2.5.
Mask shadow pattern
IMX = 2.145298307916920E-01, IMY = -1.386118796284431E-01
Spacecraft aspect plot
Bright source in the pre-burst/pre-slew/post-slew images
Pre-burst image of 15-350 keV band
Time interval of the image:
-97.735400 -0.016000

# RAcent  DECcent POSerr Theta    Phi  PeakCts   SNR AngSep     Name
#  [deg]    [deg]    ['] [deg]  [deg]                   [']
 83.6292  22.0135    0.8  36.1   70.7   4.3625  14.7    0.2	Crab
135.4922 -40.5295    2.3  52.5 -159.3   1.6319   4.9    2.2	Vela X-1
 49.5539 -16.8971    2.6  32.5  -29.5   0.5537   4.4 ------	UNKNOWN
Pre-slew background subtracted image of 15-350 keV band
Time interval of the image:
-0.016000 1.108000

# RAcent  DECcent POSerr Theta    Phi  PeakCts   SNR AngSep     Name
#  [deg]    [deg]    ['] [deg]  [deg]                   [']
 83.5213  21.9142    5.4  36.0   70.5  -0.0922  -2.2    8.7	Crab
135.7136 -40.6047    6.2  52.7 -159.2  -0.1006  -1.9    9.0	Vela X-1
 75.6639  24.2504    2.3  39.0   59.1   0.2661   5.0 ------	UNKNOWN
 74.5870  -2.5267    0.4  14.3   32.9   0.5955  31.7 ------	UNKNOWN
 41.8667  -0.0328    2.8  43.2   -4.6   0.1204   4.1 ------	UNKNOWN
 25.7403   1.0082    2.0  58.8  -10.0   0.5727   5.6 ------	UNKNOWN
118.0326 -47.6781    2.0  44.3 -143.4   0.1945   5.8 ------	UNKNOWN
 57.9937 -37.8916    2.4  32.7  -71.5   0.1344   4.7 ------	UNKNOWN
114.3862 -51.7391    2.2  45.2 -136.9   0.2088   5.2 ------	UNKNOWN
 51.4257 -40.3851    2.4  38.2  -69.6   0.2011   4.9 ------	UNKNOWN
Post-slew image of 15-350 keV band
Time interval of the image:
44.264630 941.564590

# RAcent  DECcent POSerr Theta    Phi  PeakCts   SNR AngSep     Name
#  [deg]    [deg]    ['] [deg]  [deg]                   [']
 83.6332  22.0176    0.3  26.1   85.6  37.4536  41.1    0.2	Crab
122.6020   6.9819    2.5  48.8  144.7  13.0251   4.7 ------	UNKNOWN
 79.6160  20.3299    3.0  23.4   78.2   2.9948   3.8 ------	UNKNOWN
 30.8312 -22.8492    4.8  47.0  -53.1   8.4787   2.4 ------	UNKNOWN
 23.5306 -16.0534    4.1  52.0  -42.2  10.6704   2.8 ------	UNKNOWN