Analysis Summary
Notes:
- 1) No attempt has been made to eliminate the non-significant decimal places.
- 2) This batgrbproduct analysis is done using the HEASARC data.
- 3) This batgrbproduct analysis is using the flight position for the mask-weighting calculation.
======================================================================
                  BAT GRB EVENT DATA PROCESSING REPORT
    Process Script Ver: batgrbproduct v2.46
    Process Start Time: Sun May 10 04:06:26 EDT 2015
             Host Name: bat1
   Current Working Dir: /local/data/bat1/alien/Swift_3rdBATcatalog/event/batevent_reproc/trigger440635
======================================================================

  Trigger: 00440635      Segment: 000

  BAT Trigger Time: 314468880   [s; MET]
      Trigger Stop: 314468944   [s; MET]
               UTC: 2010-12-19T16:27:53.519740    [includes UTCF correction]
       Where From?: TDRSS position message

  BAT
    RA: 12.2568493213087   Dec: -34.5318517989712  [deg; J2000]

     Catalogged Source?: NO
     Point Source?:      YES
     GRB Indicated?:     YES    [ by BAT flight software ]
     Image S/N Ratio:    7.63
     Image Trigger?:     YES
     Rate S/N Ratio:     0  [ if not an image trigger ]
     Image S/N Ratio:    7.63

  Analysis Position:   [ source = BAT ]
    RA: 12.2568493213087   Dec: -34.5318517989712  [deg; J2000]

  Refined Position:   [ source = BAT pre-slew burst ]
    RA: 12.2569   Dec: -34.5319  [deg; J2000]
        { 00h 49m 01.7s , -34d -31' -54.8" }
        +/- 2.19419636194 [arcmin] (estimated 90% radius based on SNR)
    SNR: 9.90008178779


  Angular difference between the analysis and refined position is 0.003826 arcmin

  Partial Coding Fraction: 0.07226562    [ including projection effects ]

  Duration
     T90: 41.8560000061989 +/- 5.83945205338767
        Measured from: 16.6800000071526
                   to: 58.5360000133514     [s; relative to TRIGTIME]
     T50: 24.6400000452995 +/- 9.94803782229103
        Measured from: 24.2319999933243
                   to: 48.8720000386238     [s; relative to TRIGTIME]


  Fluence
     Peak Flux  (peak 1 second)
        Measured from: 26.8360000252724
                   to: 27.8360000252724     [s; relative to TRIGTIME]
     Total Fluence
        Measured from: 12.0080000162125
                   to: 61.160000026226     [s; relative to TRIGTIME]

             Band 1     Band 2     Band 3     Band 4
              15-25      25-50     50-100    100-350     keV
 Total     1.217397   1.583632   1.144422  -0.215488
           0.178188   0.197894   0.194966   0.221744 [error]
 Peak      0.013540   0.109930   0.098486   0.009064
           0.028143   0.027305   0.030633   0.032301 [error]

     [ fluence units of on-axis counts / fully illuminated detector ]

======================================================================


====== Table of the duration information =============================

        Value   tstart    tstop
T100   49.152   12.008   61.160
T90    41.856   16.680   58.536
T50    24.640   24.232   48.872
Peak    1.000   26.836   27.836


====== Spectral Analysis Summary =====================================

Model      : spectral model: simple power-law (PL) and cutoff power-law (CPL)
Ph_index   : photon index: E^{Ph_index}
Ph_90err   : 90% error of the photon index
Epeak      : Epeak in keV
Epeak_90err: 90% error of Epeak
Norm       : normalization at 50 keV in both the PL model and CPL model
Nomr_90err : 90% error of the normalization
chi2       : Chi-Squared
dof        : degree of freedo

=== Time-averaged spectral analysis ===
(Best model with acceptable fit: PL)

Model Ph_index Ph_90err_low Ph_90err_hi  Epeak  Epeak_90err_low  Epeak_90err_hi  Norm       Nomr_90err_low    Norm_90err_hi    chi2    dof
PL      -1.767    -0.262      0.247       -           -               -         5.70e-03     -9.60e-04          9.35e-04      52.330   57
CPL     -0.878    -0.991      1.352       54.767     -15.549       -54.767      1.80e-02     -1.80e-02          8.61e-02      50.270   56


=== 1-s peak spectral analysis ===
(Best model with acceptable fit: PL)

Model Ph_index Ph_90err_low Ph_90err_hi  Epeak  Epeak_90err_low  Epeak_90err_hi  Norm       Nomr_90err_low    Norm_90err_hi    chi2    dof
PL      -1.716     -0.403     0.404       -           -               -         1.25e-02     -4.68e-03          4.68e-03      46.900   57
CPL      2.697     -2.306    -2.697       65.288     -17.566        13.521      1.09e+00     -1.09e+00          5.61e+03      33.470   56


=== Fluence/Peak Flux Summary ===

              Model    Band1     Band2     Band3     Band4     Band5     Total
                       15-25     25-50    50-100    100-350    15-150    15-350    keV
Fluence         PL   4.60e-07  7.19e-07  8.45e-07  1.92e-06  2.59e-06  3.94e-06   erg/cm2
      90%_error_low -9.25e-08 -1.01e-07 -1.89e-07 -7.43e-07 -4.40e-07 -9.63e-07   erg/cm2
      90%_error_hi   9.60e-08  1.01e-07  1.92e-07  1.00e-06  4.52e-07  1.17e-06   erg/cm2
Peak flux       PL   6.34e-01  5.60e-01  3.40e-01  3.12e-01  1.67e+00  1.85e+00   ph/cm2/s
      90%_error_low -3.25e-01 -2.33e-01 -1.29e-01 -1.59e-01 -6.80e-01 -7.06e-01   ph/cm2/s
      90%_error_hi   3.73e-01  2.34e-01  1.29e-01  1.88e-01  6.97e-01  7.21e-01   ph/cm2/s

Fluence        CPL   4.21e-07  7.98e-07  8.29e-07  5.04e-07  2.37e-06  2.55e-06   erg/cm2
      90%_error_low -1.07e-07 -1.37e-07 -2.31e-07 -3.96e-07 -4.70e-07 -6.31e-07   erg/cm2
      90%_error_hi   1.08e-07  1.44e-07  2.18e-07  1.70e-06  5.14e-07  1.82e-06   erg/cm2
Peak flux      CPL   2.17e-01  8.06e-01  7.95e-01  1.09e-01  1.92e+00  1.93e+00   ph/cm2/s
      90%_error_low -2.17e-01 -3.31e-01 -4.06e-01 -1.09e-01 -6.87e-01 -6.93e-01   ph/cm2/s
      90%_error_hi   3.34e-01  3.37e-01  3.01e-01  1.32e-01  6.43e-01  6.52e-01   ph/cm2/s

======================================================================
Image
Pre-slew 15.0-50.0 keV image (Event data)
#RAcent DECcent POSerr Theta  Phi  Peak_Cts  SNR Name
12.257 -34.532 0.000 44.421 131.368 3.585 9.900 TRIG_00440635

Image time interval: 0.000 to 64.000 [sec]
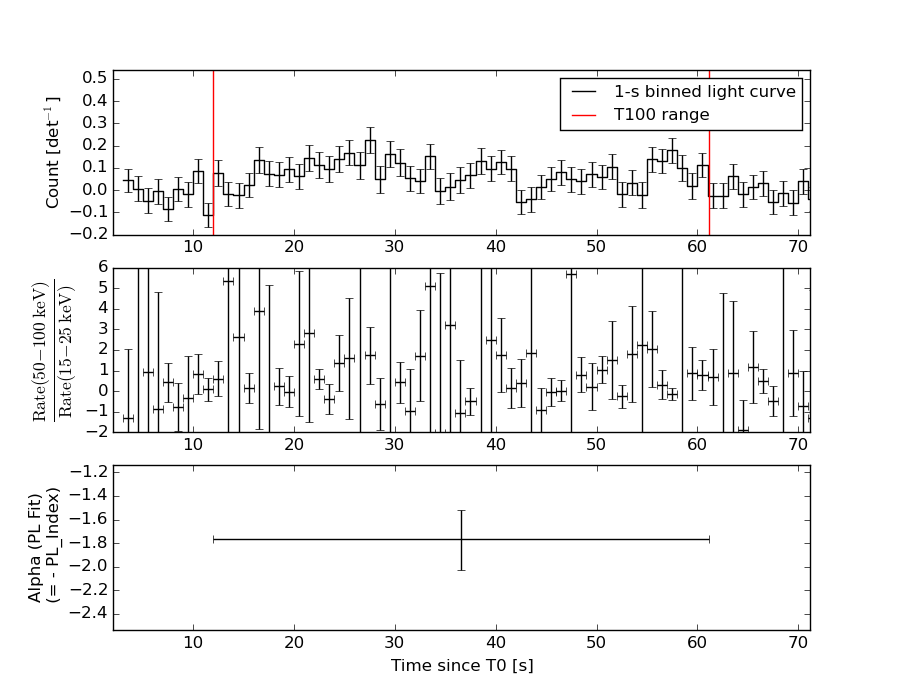
Light Curves
Note: The mask-weighted lightcurves have units of either count/det or counts/sec/det, where a det is 0.4 x 0.4 = 0.16 sq cm.
Full-time range; 1 s binning
Other quick-look light curves:
- 64 ms binning (zoomed)
- 16 ms binning (zoomed)
- 8 ms binning (zoomed)
- 2 ms binning (zoomed)
- SN=5 or 10 s binning (full-time range)
- Raw light curve
Spectra
- 64 ms binning (zoomed)
- 16 ms binning (zoomed)
- 8 ms binning (zoomed)
- 2 ms binning (zoomed)
- SN=5 or 10 s binning (full-time range)
- Raw light curve
Spectra
Notes:
- 1) The fitting includes the systematic errors.
- 2) When the burst includes telescope slew time periods, the fitting uses an average response file made from multiple 5-s response files through out the slew time plus single time preiod for the non-slew times, and weighted by the total counts in the corresponding time period using addrmf. An average response file is needed becuase a spectral fit using the pre-slew DRM will introduce some errors in both a spectral shape and a normalization if the PHA file contains a lot of the slew/post-slew time interval.
- 3) For fits to more complicated models (e.g. a power-law over a cutoff power-law), the BAT team has decided to require a chi-square improvement of more than 6 for each extra dof.
Time averaged spectrum fit using the average DRM
Power-law model
Time interval is from   12.008 sec. to   61.160 sec.

Spectral model in power-law:
------------------------------------------------------------
Parameters  : value       lower 90%   higher 90%
Photon index: -1.76692     ( -0.261683   0.24674 )
Norm@50keV  : 5.70431E-03    ( -0.000959538   0.000935433 )
------------------------------------------------------------
#Fit statistic : Chi-Squared =          52.33 using 59 PHA bins.
# Reduced chi-squared =         0.9180 for     57 degrees of freedom
# Null hypothesis probability =   6.508069e-01

Photon flux (15-150 keV)    in 49.15 sec: 0.776226 ( -0.109259  0.109273 ) ph/cm2/s
Energy fluence (15-150 keV)             : 2.58514e-06 ( -4.3986e-07  4.52273e-07 ) ergs/cm2
Cutoff power-law model
Time interval is from   12.008 sec. to   61.160 sec.
Spectral model in the cutoff power-law:
------------------------------------------------------------
Parameters  : value       lower 90%   higher 90%
Photon index: -0.877763     ( -0.991502   1.35218 )
Epeak [keV] : 54.7667      ( -15.5493 -54.7667 )
Norm@50keV  : 1.80173E-02    ( -0.0180173   0.0861454 )
------------------------------------------------------------
#Fit statistic : Chi-Squared =          50.27 using 59 PHA bins.
# Reduced chi-squared =         0.8978 for     56 degrees of freedom
# Null hypothesis probability =   6.904241e-01

Photon flux (15-150 keV)    in 49.15 sec: 0.750342 ( -0.112937  0.113297 ) ph/cm2/s
Energy fluence (15-150 keV)             : 2.3667e-06 ( -4.70066e-07  5.13971e-07 ) ergs/cm2
1-s peak spectrum fit
Power-law model
Time interval is from   26.836 sec. to   27.836 sec.

Spectral model in power-law:
------------------------------------------------------------
Parameters  : value       lower 90%   higher 90%
Photon index: -1.7165     ( -0.394995   0.411717 )
Norm@50keV  : 1.24509E-02    ( -0.00468114   0.00467152 )
------------------------------------------------------------
#Fit statistic : Chi-Squared =          46.90 using 59 PHA bins.
# Reduced chi-squared =         0.8229 for     57 degrees of freedom
# Null hypothesis probability =   8.275773e-01

Photon flux (15-150 keV)    in 1 sec: 1.66775 ( -0.680424  0.69702 ) ph/cm2/s
Energy fluence (15-150 keV)             : 1.15178e-07 ( -4.2941e-08  4.29687e-08 ) ergs/cm2
Cutoff power-law model
Time interval is from   26.836 sec. to   27.836 sec.
Spectral model in the cutoff power-law:
------------------------------------------------------------
Parameters  : value       lower 90%   higher 90%
Photon index: 2.69724     ( -2.30785   -2.6992 )
Epeak [keV] : 65.2885      ( -17.5683 13.5185 )
Norm@50keV  : 1.09483    ( -1.09597   5608.44 )
------------------------------------------------------------
#Fit statistic : Chi-Squared =          33.47 using 59 PHA bins.
# Reduced chi-squared =         0.5978 for     56 degrees of freedom
# Null hypothesis probability =   9.927075e-01

Photon flux (15-150 keV)    in 1 sec: 1.91913 ( -0.68663  0.64312 ) ph/cm2/s
Energy fluence (15-150 keV)             : 1.61395e-07 ( -6.94051e-08  5.13503e-08 ) ergs/cm2
Time-resolved spectra
Distribution
T90 vs. Hardness ratio plot
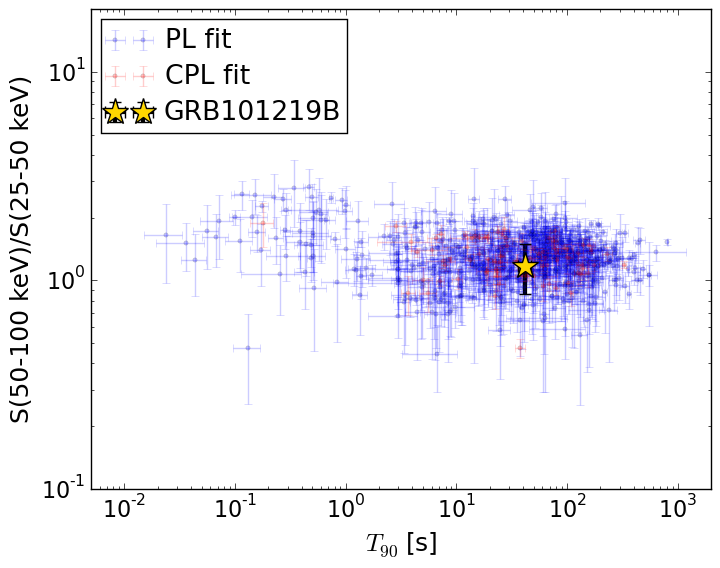
T90                                   = 41.856 sec.
Hardness ratio (energy fluence ratio) = 1.17538408501
S(15-50 keV) vs. S(50-150 keV) plot
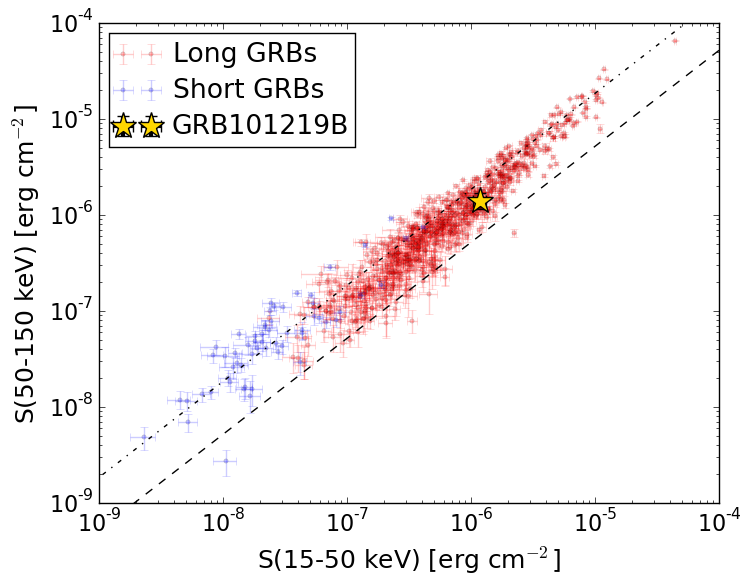
S(15-50 keV)  = 1.1789788e-06
S(50-150 keV) = 1.4061554e-06
The dash-dotted line and the dashed line traces the fluences calculated from the Band function with Epeak = 15 and 150 keV, respectively. Both lines assume a canonical values of alpha = -1 and beta = -2.5.
Mask shadow pattern
IMX = -0.647677904434, IMY = -0.735470850714
Spacecraft aspect plot
Bright source in the pre-burst/pre-slew/post-slew images
Pre-burst image of 15-350 keV band
Time interval of the image:
-4.499400 12.008000

# RAcent  DECcent POSerr Theta    Phi  PeakCts   SNR AngSep     Name
#  [deg]    [deg]    ['] [deg]  [deg]                   [']
285.0623 -24.7992    5.9  35.5  -89.6   0.2372   2.0    7.4	HT1900.1-2455
288.8440  10.9759    2.5  47.1  -36.4   0.6050   4.6    3.3	GRS 1915+105
Pre-slew background subtracted image of 15-350 keV band
Time interval of the image:
12.008000 61.160000

# RAcent  DECcent POSerr Theta    Phi  PeakCts   SNR AngSep     Name
#  [deg]    [deg]    ['] [deg]  [deg]                   [']
285.1335 -24.8016    9.3  35.4  -89.6  -0.5033  -1.2    8.9	HT1900.1-2455
288.8685  10.9442    3.2  47.1  -36.5  -1.6012  -3.6    4.1	GRS 1915+105
344.6287  -5.2491    2.0  26.0   67.8   1.5233   5.6 ------	UNKNOWN
277.3681 -41.7394    2.5  43.6 -115.2   3.6041   4.7 ------	UNKNOWN
Post-slew image of 15-350 keV band
Time interval of the image:
135.500600 963.025200

# RAcent  DECcent POSerr Theta    Phi  PeakCts   SNR AngSep     Name
#  [deg]    [deg]    ['] [deg]  [deg]                   [']
 43.0397 -16.3316    3.0  33.0   92.0   5.2354   3.9 ------	UNKNOWN
341.2819 -46.8404    3.7  26.3  -99.7   2.4165   3.1 ------	UNKNOWN
333.8764  12.6124    2.6  59.5  -17.0  16.9561   4.4 ------	UNKNOWN
333.7024   4.1373    3.2  53.0  -23.5   6.4485   3.6 ------	UNKNOWN
324.0159  -7.1215    4.0  52.0  -42.2  10.9503   2.9 ------	UNKNOWN
319.9409 -44.9437    2.8  40.8  -93.4  13.4002   4.1 ------	UNKNOWN