Analysis Summary
Notes:
- 1) No attempt has been made to eliminate the non-significant decimal places.
- 2) This batgrbproduct analysis is done using the HEASARC data.
- 3) This batgrbproduct analysis is using the flight position for the mask-weighting calculation.
======================================================================
BAT GRB EVENT DATA PROCESSING REPORT
Process Script Ver: batgrbproduct v2.46
Process Start Time: Fri Jan 17 14:57:29 EST 2014
Host Name: batevent1
Current Working Dir: /local/data/batevent/batevent_reproc/trigger440955
======================================================================
Trigger: 00440955 Segment: 000
BAT Trigger Time: 314861240.256 [s; MET]
Trigger Stop: 314861240.512 [s; MET]
UTC: 2010-12-24T05:27:13.761240 [includes UTCF correction]
Where From?: TDRSS position message
BAT
RA: 285.926038610832 Dec: 45.7154744502681 [deg; J2000]
Catalogged Source?: NO
Point Source?: YES
GRB Indicated?: YES [ by BAT flight software ]
Image S/N Ratio: 9.17
Image Trigger?: NO
Rate S/N Ratio: 18.4661853126194 [ if not an image trigger ]
Image S/N Ratio: 9.17
Analysis Position: [ source = BAT ]
RA: 285.926038610832 Dec: 45.7154744502681 [deg; J2000]
Refined Position: [ source = BAT pre-slew burst ]
RA: 285.939544758496 Dec: 45.7061061793522 [deg; J2000]
{ 19h 03m 45.5s , +45d 42' 22.0" }
+/- 2.09718152589513 [arcmin] (estimated 90% radius based on SNR)
+/- 0.905015927662979 [arcmin] (formal 1-sigma fit error)
SNR: 10.5593782379298
Angular difference between the analysis and refined position is 0.797593 arcmin
Partial Coding Fraction: 0.5390625 [ including projection effects ]
Duration
T90: 0.24399995803833 +/- 0.042520585314364
Measured from: 0.0360000133514404
to: 0.279999971389771 [s; relative to TRIGTIME]
T50: 0.135999977588654 +/- 0.033941109986914
Measured from: 0.0879999995231628
to: 0.223999977111816 [s; relative to TRIGTIME]
Fluence
Peak Flux (peak 1 second)
Measured from: -0.337999999523163
to: 0.662000000476837 [s; relative to TRIGTIME]
Total Fluence
Measured from: 0.0239999890327454
to: 0.296000003814697 [s; relative to TRIGTIME]
Band 1 Band 2 Band 3 Band 4
15-25 25-50 50-100 100-350 keV
Total 0.008106 0.031051 0.039613 0.017654
0.004590 0.005382 0.005129 0.003901 [error]
Peak 0.008687 0.036580 0.036461 0.016309
0.007933 0.008644 0.007795 0.006652 [error]
[ fluence units of on-axis counts / fully illuminated detector ]
======================================================================
====== Table of the duration information =============================
Value tstart tstop
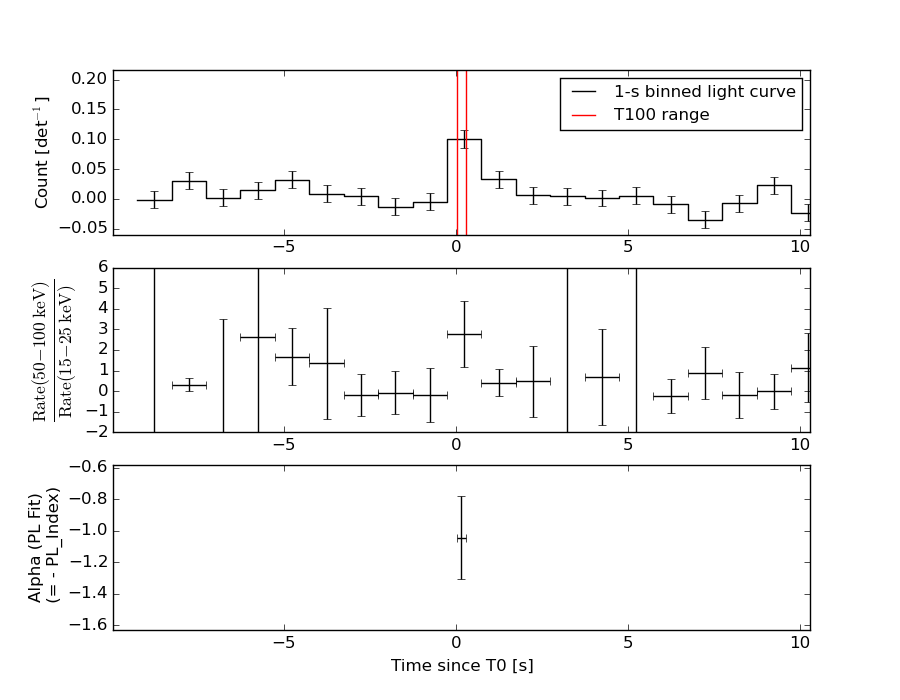
T100 0.272 0.024 0.296
T90 0.244 0.036 0.280
T50 0.136 0.088 0.224
Peak 1.000 -0.338 0.662
====== Spectral Analysis Summary =====================================
Model : spectral model: simple power-law (PL) and cutoff power-law (CPL)
Ph_index : photon index: E^{Ph_index}
Ph_90err : 90% error of the photon index
Epeak : Epeak in keV
Epeak_90err: 90% error of Epeak
Norm : normalization at 50 keV in both the PL model and CPL model
Nomr_90err : 90% error of the normalization
chi2 : Chi-Squared
dof : degree of freedo
=== Time-averaged spectral analysis ===
(Best model with acceptable fit: N/A)
Model Ph_index Ph_90err_low Ph_90err_hi Epeak Epeak_90err_low Epeak_90err_hi Norm Nomr_90err_low Norm_90err_hi chi2 dof
PL -1.046 -0.258 0.267 - - - 1.95e-02 -3.72e-03 3.70e-03 71.540 57
CPL 0.925 -1.235 1.803 95.869 -19.880 50.887 1.18e-01 -1.18e-01 3.42e-01 62.830 56
=== 1-s peak spectral analysis ===
(Best model with acceptable fit: PL)
Model Ph_index Ph_90err_low Ph_90err_hi Epeak Epeak_90err_low Epeak_90err_hi Norm Nomr_90err_low Norm_90err_hi chi2 dof
PL -0.710 -0.442 0.529 - - - 5.99e-03 -1.84e-03 1.75e-03 45.310 57
CPL -0.047 0.047 2.642 175.865 -175.865 -175.865 1.15e-02 -7.09e-03 1.18e-01 44.900 56
=== Fluence/Peak Flux Summary ===
Model Band1 Band2 Band3 Band4 Band5 Total
15-25 25-50 50-100 100-350 15-150 15-350 keV
Fluence PL 4.42e-09 1.08e-08 2.08e-08 9.92e-08 5.64e-08 1.35e-07 erg/cm2
90%_error_low -1.40e-09 -2.39e-09 -4.08e-09 -3.38e-08 -1.08e-08 -3.72e-08 erg/cm2
90%_error_hi 1.57e-09 2.38e-09 4.05e-09 4.20e-08 1.08e-08 4.39e-08 erg/cm2
Peak flux PL 1.16e-01 1.88e-01 2.30e-01 5.53e-01 6.92e-01 1.09e+00 ph/cm2/s
90%_error_low -6.42e-02 -7.46e-02 -5.96e-02 -2.51e-01 -1.93e-01 -3.02e-01 ph/cm2/s
90%_error_hi 8.31e-02 7.42e-02 5.95e-02 3.85e-01 1.96e-01 3.46e-01 ph/cm2/s
Fluence CPL 2.38e-09 1.15e-08 2.74e-08 2.74e-08 5.80e-08 6.86e-08 erg/cm2
90%_error_low -1.49e-09 -3.32e-09 -5.80e-09 -1.47e-08 -1.13e-08 -1.79e-08 erg/cm2
90%_error_hi 1.87e-09 3.06e-09 6.08e-09 2.92e-08 1.12e-08 2.90e-08 erg/cm2
Peak flux CPL 9.65e-02 1.93e-01 2.49e-01 3.03e-01 6.79e-01 8.40e-01 ph/cm2/s
90%_error_low -9.65e-02 -8.23e-02 -7.28e-02 -3.03e-01 -1.93e-01 -3.16e-01 ph/cm2/s
90%_error_hi 9.57e-02 8.48e-02 8.00e-02 3.27e-01 1.98e-01 4.22e-01 ph/cm2/s
======================================================================
Image
Pre-slew 15.0-350.0 keV image (Event data)
#   RAcent    DECcent   POSerr    Theta     Phi              Peak Cts       SNR   Name
  285.9395    45.7061   0.0183    27.1393    47.5341         0.1030458     10.559 TRIG_00440955

Foreground time interval of the image:
  0.024   0.296 (delta_t =   0.272 [sec])
Background time interval of the image:
-239.256   0.024 (delta_t = 239.280 [sec])
Light Curves
Note: The mask-weighted lightcurves have units of either count/det or counts/sec/det, where a det is 0.4 x 0.4 = 0.16 sq cm.
Full-time range; 1 s binning
Other quick-look light curves:
- 64 ms binning (zoomed)
- 16 ms binning (zoomed)
- 8 ms binning (zoomed)
- 2 ms binning (zoomed)
- SN=5 or 10 s binning (full-time range)
- Raw light curve
Spectra
- 64 ms binning (zoomed)
- 16 ms binning (zoomed)
- 8 ms binning (zoomed)
- 2 ms binning (zoomed)
- SN=5 or 10 s binning (full-time range)
- Raw light curve
Spectra
Notes:
- 1) The fitting includes the systematic errors.
- 2) When the burst includes telescope slew time periods, the fitting uses an average response file made from multiple 5-s response files through out the slew time plus single time preiod for the non-slew times, and weighted by the total counts in the corresponding time period using addrmf. An average response file is needed becuase a spectral fit using the pre-slew DRM will introduce some errors in both a spectral shape and a normalization if the PHA file contains a lot of the slew/post-slew time interval.
- 3) For fits to more complicated models (e.g. a power-law over a cutoff power-law), the BAT team has decided to require a chi-square improvement of more than 6 for each extra dof.
Time averaged spectrum fit using the average DRM
Power-law model
Time interval is from    0.024 sec. to    0.296 sec.

Spectral model in power-law:
------------------------------------------------------------
Parameters  : value       lower 90%   higher 90%
Photon index: -1.04639     ( -0.258725   0.266018 )
Norm@50keV  : 1.94644E-02    ( -0.00372087   0.00370128 )
------------------------------------------------------------
#Fit statistic : Chi-Squared =          71.54 using 59 PHA bins.
# Reduced chi-squared =          1.255 for     57 degrees of freedom
# Null hypothesis probability =   9.314857e-02

Photon flux (15-150 keV)    in 0.272 sec: 2.24713 ( -0.43777  0.44047 ) ph/cm2/s
Energy fluence (15-150 keV)             : 5.63505e-08 ( -1.079e-08  1.0803e-08 ) ergs/cm2
Cutoff power-law model
Time interval is from    0.024 sec. to    0.296 sec.
Spectral model in the cutoff power-law:
------------------------------------------------------------
Parameters  : value       lower 90%   higher 90%
Photon index: 0.925316     ( -1.23569   1.80295 )
Epeak [keV] : 95.8691      ( -19.8722 50.8952 )
Norm@50keV  : 0.117748    ( -0.11779   0.341803 )
------------------------------------------------------------
#Fit statistic : Chi-Squared =          62.83 using 59 PHA bins.
# Reduced chi-squared =          1.122 for     56 degrees of freedom
# Null hypothesis probability =   2.471781e-01

Photon flux (15-150 keV)    in 0.272 sec: 2.17796 ( -0.43671  0.44287 ) ph/cm2/s
Energy fluence (15-150 keV)             : 5.79548e-08 ( -1.12879e-08  1.12425e-08 ) ergs/cm2
1-s peak spectrum fit
Power-law model

Time interval is from   -0.338 sec. to    0.662 sec.

Spectral model in power-law:
------------------------------------------------------------
Parameters  : value       lower 90%   higher 90%
Photon index: -0.710471     ( -0.441991   0.528628 )
Norm@50keV  : 5.98976E-03    ( -0.00184341   0.00174683 )
------------------------------------------------------------
#Fit statistic : Chi-Squared =          45.31 using 59 PHA bins.
# Reduced chi-squared =         0.7950 for     57 degrees of freedom
# Null hypothesis probability =   8.678575e-01

Photon flux (15-150 keV)    in 1 sec: 0.691797 ( -0.192518  0.196164 ) ph/cm2/s
Energy fluence (15-150 keV)             : 7.2778e-08 ( -1.92711e-08  1.93687e-08 ) ergs/cm2
Cutoff power-law model
Time interval is from   -0.338 sec. to    0.662 sec.
Spectral model in the cutoff power-law:
------------------------------------------------------------
Parameters  : value       lower 90%   higher 90%
Photon index: -0.0473288     ( 0.049171   2.64361 )
Epeak [keV] : 175.865      ( -176.029 -176.029 )
Norm@50keV  : 1.15173E-02    ( -0.00707609   0.11811 )
------------------------------------------------------------
#Fit statistic : Chi-Squared =          44.90 using 59 PHA bins.
# Reduced chi-squared =         0.8017 for     56 degrees of freedom
# Null hypothesis probability =   8.562871e-01

Photon flux (15-150 keV)    in 1 sec: 0.678908 ( -0.192978  0.198356 ) ph/cm2/s
Energy fluence (15-150 keV)             : 7.09137e-08 ( -2.12247e-08  2.01908e-08 ) ergs/cm2
Time-resolved spectra
Distribution
T90 vs. Hardness ratio plot
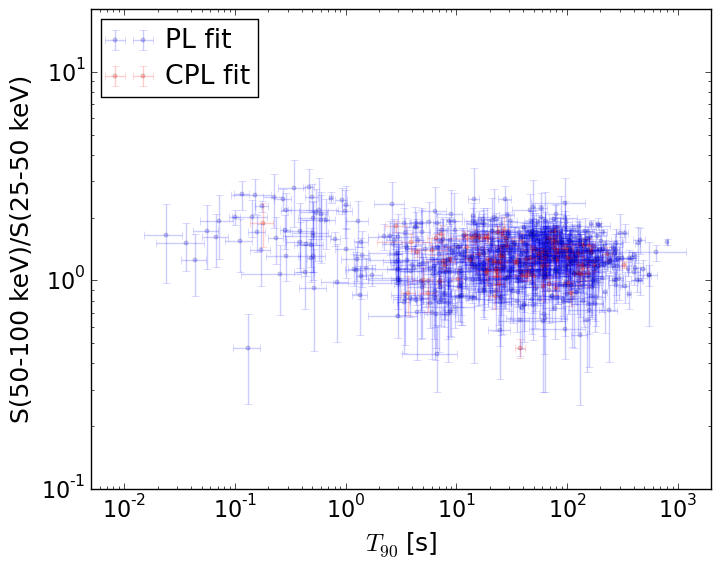
T90                                   = N/A sec.
Hardness ratio (energy fluence ratio) = N/A
S(15-50 keV) vs. S(50-150 keV) plot
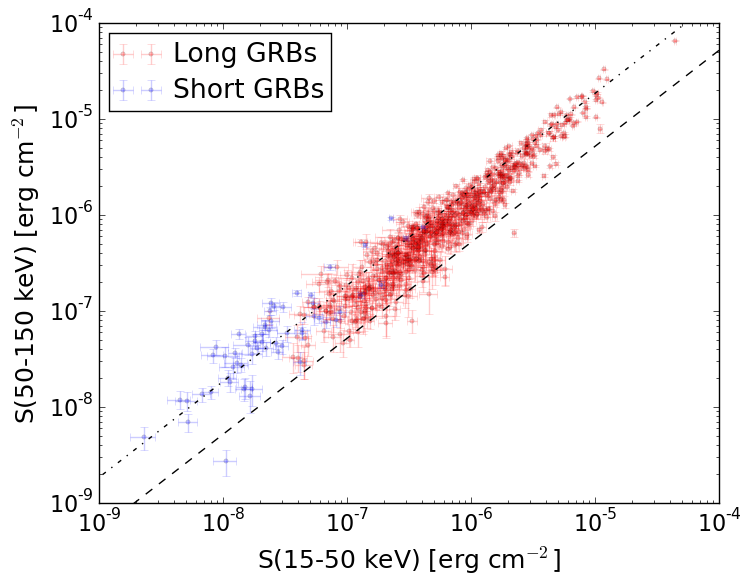
S(15-50 keV)  = N/A
S(50-150 keV) = N/A
The dash-dotted line and the dashed line traces the fluences calculated from the Band function with Epeak = 15 and 150 keV, respectively. Both lines assume a canonical values of alpha = -1 and beta = -2.5.
Mask shadow pattern
IMX = 3.460763347837418E-01, IMY = -3.781281415607399E-01
Spacecraft aspect plot
Bright source in the pre-burst/pre-slew/post-slew images
Pre-burst image of 15-350 keV band
Time interval of the image:
-239.256000 0.024000

# RAcent  DECcent POSerr Theta    Phi  PeakCts   SNR AngSep     Name
#  [deg]    [deg]    ['] [deg]  [deg]                   [']
254.4556  35.2211    5.5  37.6    1.8  -0.6155  -2.1    7.3	Her X-1
268.5421  -1.3839    0.0  31.7  -69.2   0.3098   0.9   11.2	SW J1753.5-0127
274.1522 -14.0282    8.0  38.1  -90.7  -1.0463  -1.4    8.5	GX 17+2
288.8019  10.9382    0.6   9.3  -94.2   3.7388  18.7    0.5	GRS 1915+105
299.5910  35.2322    2.3  17.0   76.9   1.1889   5.0    1.8	Cyg X-1
308.0627  40.9638    2.3  25.2   85.8   1.5659   5.1    2.3	Cyg X-3
326.2311  38.3214    7.8  34.4  107.8   0.7757   1.5    2.8	Cyg X-2
242.3321   3.6175    2.7  51.9  -42.3   4.9761   4.4 ------	UNKNOWN
242.0702   3.6533    3.2  52.2  -42.1   4.4556   3.8 ------	UNKNOWN
Pre-slew background subtracted image of 15-350 keV band
Time interval of the image:
0.024000 0.296000

# RAcent  DECcent POSerr Theta    Phi  PeakCts   SNR AngSep     Name
#  [deg]    [deg]    ['] [deg]  [deg]                   [']
254.3331  35.2434    6.3  37.7    1.8  -0.0185  -1.9    8.5	Her X-1
268.2618  -1.4118    7.7  32.0  -68.9  -0.0153  -1.5    6.8	SW J1753.5-0127
274.0472 -14.0031   27.9  38.2  -90.6   0.0070   0.4    3.1	GX 17+2
288.8512  10.7416    0.0   9.4  -95.0  -0.0141  -1.9   12.6	GRS 1915+105
299.4988  35.3334   23.2  17.1   76.6   0.0039   0.5    9.1	Cyg X-1
308.3618  40.9923    5.7  25.4   86.2   0.0207   2.0   11.6	Cyg X-3
326.1416  38.1167    0.0  34.3  108.1  -0.0006  -0.0   12.4	Cyg X-2
285.9395  45.7061    1.1  27.1   47.5   0.1031  10.6 ------	UNKNOWN
338.3057  -0.1028    2.5  48.3  166.8   0.0903   4.6 ------	UNKNOWN
263.4171  21.8690    2.0  27.9  -20.8   0.0419   5.8 ------	UNKNOWN
229.2339  27.4189    1.6  58.6  -10.4   0.2825   7.1 ------	UNKNOWN
Post-slew image of 15-350 keV band
Time interval of the image:
61.644600 962.789600

# RAcent  DECcent POSerr Theta    Phi  PeakCts   SNR AngSep     Name
#  [deg]    [deg]    ['] [deg]  [deg]                   [']
254.6623  35.2444   12.5  25.7  -25.8  -0.4507  -0.9   11.6	Her X-1
288.8000  10.9387    0.8  34.8 -107.9  12.3897  13.7    0.4	GRS 1915+105
299.5806  35.1966    1.7  14.7 -152.3   3.2026   6.8    0.6	Cyg X-1
308.1409  40.9893    1.6  16.8  175.4   3.6373   7.0    2.6	Cyg X-3
326.0331  38.3131    4.7  30.4  166.7   1.6472   2.5    6.5	Cyg X-2
220.2148  21.2871    3.1  58.1  -14.3   9.5353   3.8 ------	UNKNOWN
220.7184  18.6301    3.0  59.6  -17.0  12.2976   3.9 ------	UNKNOWN
259.3733  11.5397    2.7  40.9  -61.0   6.4081   4.2 ------	UNKNOWN
251.3405   9.1650    3.9  47.0  -52.9   6.8963   3.0 ------	UNKNOWN
241.7345   9.7991    4.0  52.0  -42.3   8.3374   2.9 ------	UNKNOWN
278.9798   5.1757    3.4  41.0  -92.4   7.3041   3.4 ------	UNKNOWN