Analysis Summary
Notes:
- 1) No attempt has been made to eliminate the non-significant decimal places.
- 2) This batgrbproduct analysis is done using the HEASARC data.
- 3) This batgrbproduct analysis is using the flight position for the mask-weighting calculation.
======================================================================
                  BAT GRB EVENT DATA PROCESSING REPORT
    Process Script Ver: batgrbproduct v2.46
    Process Start Time: Tue Jan 14 01:07:09 EST 2014
             Host Name: batevent1
   Current Working Dir: /local/data/batevent/batevent_reproc/trigger441454
======================================================================

  Trigger: 00441454      Segment: 000

  BAT Trigger Time: 315687152   [s; MET]
      Trigger Stop: 315687216   [s; MET]
               UTC: 2011-01-02T18:52:25.474700    [includes UTCF correction]
       Where From?: TDRSS position message

  BAT
    RA: 245.879070553938   Dec: 7.619220658419  [deg; J2000]

     Catalogged Source?: NO
     Point Source?:      YES
     GRB Indicated?:     YES    [ by BAT flight software ]
     Image S/N Ratio:    11.29
     Image Trigger?:     YES
     Rate S/N Ratio:     0  [ if not an image trigger ]
     Image S/N Ratio:    11.29

  Analysis Position:   [ source = BAT ]
    RA: 245.879070553938   Dec: 7.619220658419  [deg; J2000]

  Refined Position:   [ source = BAT pre-slew burst ]
    RA: 245.878842666235   Dec: 7.61342432181446  [deg; J2000]
        { 16h 23m 30.9s , +07d 36' 48.3" }
         +/- 1.8365543189328 [arcmin] (estimated 90% radius based on SNR)
         +/- 0.799908740535413 [arcmin] (formal 1-sigma fit error)
    SNR: 12.7635100884259

  Angular difference between the analysis and refined position is 0.348044 arcmin

  Partial Coding Fraction: 0.6640625    [ including projection effects ]

  Duration
     T90: 265.915999948978 +/- 6.70215250002666
        Measured from: 5.05199998617172
                   to: 270.96799993515     [s; relative to TRIGTIME]
     T50: 81.1959999799728 +/- 2.31890315406829
        Measured from: 136.931999981403
                   to: 218.127999961376     [s; relative to TRIGTIME]


  Fluence
     Peak Flux  (peak 1 second)
        Measured from: 208.759999990463
                   to: 209.759999990463     [s; relative to TRIGTIME]
     Total Fluence
        Measured from: -58.9840000271797
                   to: 294.824000000954     [s; relative to TRIGTIME]

             Band 1     Band 2     Band 3     Band 4
              15-25      25-50     50-100    100-350     keV
 Total     7.292530   9.615733   7.434354   1.828073
           0.131501   0.130169   0.114802   0.097074 [error]
 Peak      0.226939   0.354623   0.338109   0.114850
           0.009378   0.010825   0.010784   0.008124 [error]

     [ fluence units of on-axis counts / fully illuminated detector ]

======================================================================


====== Table of the duration information =============================

        Value   tstart    tstop
T100  353.808  -58.984  294.824
T90   265.916    5.052  270.968
T50    81.196  136.932  218.128
Peak    1.000  208.760  209.760


====== Spectral Analysis Summary =====================================

Model      : spectral model: simple power-law (PL) and cutoff power-law (CPL)
Ph_index   : photon index: E^{Ph_index}
Ph_90err   : 90% error of the photon index
Epeak      : Epeak in keV
Epeak_90err: 90% error of Epeak
Norm       : normalization at 50 keV in both the PL model and CPL model
Nomr_90err : 90% error of the normalization
chi2       : Chi-Squared
dof        : degree of freedo

=== Time-averaged spectral analysis ===
(Best model with acceptable fit: PL)

Model Ph_index Ph_90err_low Ph_90err_hi  Epeak  Epeak_90err_low  Epeak_90err_hi  Norm       Nomr_90err_low    Norm_90err_hi    chi2    dof
PL      -1.500    -0.038      0.039       -           -               -         4.71e-03     -9.05e-05          9.05e-05      46.020   57
CPL     -1.497    -0.039      0.123     9996.690    -9996.690      -9996.690      4.73e-03     -9.10e-05          5.99e-04      46.040   56


=== 1-s peak spectral analysis ===
(Best model with acceptable fit: PL)

Model Ph_index Ph_90err_low Ph_90err_hi  Epeak  Epeak_90err_low  Epeak_90err_hi  Norm       Nomr_90err_low    Norm_90err_hi    chi2    dof
PL      -1.182     -0.063     0.064       -           -               -         6.63e-02     -2.27e-03          2.27e-03      52.530   57
CPL     -1.167     -0.078     0.205     9887.130    -9887.130      -9887.130      6.73e-02     -2.96e-03          1.60e-03      52.860   56


=== Fluence/Peak Flux Summary ===

              Model    Band1     Band2     Band3     Band4     Band5     Total
                       15-25     25-50    50-100    100-350    15-150    15-350    keV
Fluence         PL   2.13e-06  3.91e-06  5.53e-06  1.64e-05  1.58e-05  2.80e-05   erg/cm2
      90%_error_low -8.93e-08 -9.34e-08 -1.26e-07 -8.88e-07 -3.11e-07 -9.35e-07   erg/cm2
      90%_error_hi   9.10e-08  9.31e-08  1.26e-07  9.24e-07  3.12e-07  9.63e-07   erg/cm2
Peak flux       PL   2.01e+00  2.45e+00  2.16e+00  3.28e+00  7.77e+00  9.90e+00   ph/cm2/s
      90%_error_low -1.39e-01 -1.01e-01 -8.67e-02 -2.81e-01 -2.75e-01 -3.62e-01   ph/cm2/s
      90%_error_hi   1.43e-01  1.01e-01  8.63e-02  2.98e-01  2.75e-01  3.65e-01   ph/cm2/s

Fluence        CPL   2.13e-06  3.91e-06  5.52e-06  1.64e-05  1.59e-05  2.80e-05   erg/cm2
      90%_error_low    N/A       N/A       N/A       N/A       N/A    -2.51e-06   erg/cm2
      90%_error_hi     N/A       N/A       N/A       N/A       N/A     4.58e-07   erg/cm2
Peak flux      CPL   1.43e+00  9.48e-01  4.29e-01  3.56e-01  2.95e+00  3.13e+00   ph/cm2/s
      90%_error_low -2.07e-01 -1.35e-01 -3.70e-02 -5.22e-02 -4.27e-01 -2.74e-01   ph/cm2/s
      90%_error_hi   2.44e-01  2.02e-01  1.21e-01  1.14e-01  5.87e-01  6.05e-01   ph/cm2/s

======================================================================
Image
Pre-slew 15.0-350.0 keV image (Event data)
#   RAcent    DECcent   POSerr    Theta     Phi              Peak Cts       SNR   Name
  245.8788     7.6134   0.0151    36.9120   -14.9387         1.8501323     12.764 TRIG_00441454

Foreground time interval of the image:
 -9.099  73.101 (delta_t =  82.200 [sec])
Background time interval of the image:
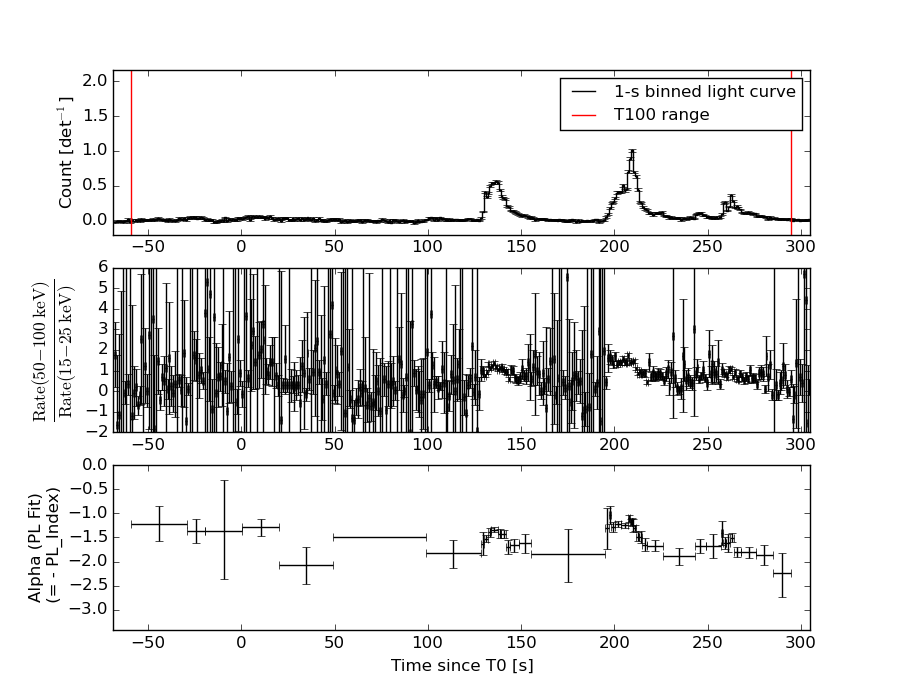
Light Curves
Note: The mask-weighted lightcurves have units of either count/det or counts/sec/det, where a det is 0.4 x 0.4 = 0.16 sq cm.
Full-time range; 1 s binning
Other quick-look light curves:
- 64 ms binning (zoomed)
- 16 ms binning (zoomed)
- 8 ms binning (zoomed)
- 2 ms binning (zoomed)
- SN=5 or 10 s binning (full-time range)
- Raw light curve
Spectra
- 64 ms binning (zoomed)
- 16 ms binning (zoomed)
- 8 ms binning (zoomed)
- 2 ms binning (zoomed)
- SN=5 or 10 s binning (full-time range)
- Raw light curve
Spectra
Notes:
- 1) The fitting includes the systematic errors.
- 2) When the burst includes telescope slew time periods, the fitting uses an average response file made from multiple 5-s response files through out the slew time plus single time preiod for the non-slew times, and weighted by the total counts in the corresponding time period using addrmf. An average response file is needed becuase a spectral fit using the pre-slew DRM will introduce some errors in both a spectral shape and a normalization if the PHA file contains a lot of the slew/post-slew time interval.
- 3) For fits to more complicated models (e.g. a power-law over a cutoff power-law), the BAT team has decided to require a chi-square improvement of more than 6 for each extra dof.
Time averaged spectrum fit using the average DRM
Power-law model
Time interval is from  -58.984 sec. to  294.824 sec.

Spectral model in power-law:
------------------------------------------------------------
Parameters  : value       lower 90%   higher 90%
Photon index: -1.50031     ( -0.0384863   0.038551 )
Norm@50keV  : 4.71434E-03    ( -9.04974e-05   9.04752e-05 )
------------------------------------------------------------
#Fit statistic : Chi-Squared =          46.02 using 59 PHA bins.
# Reduced chi-squared =         0.8074 for     57 degrees of freedom
# Null hypothesis probability =   8.507218e-01

Photon flux (15-150 keV)    in 353.8 sec: 0.588598 ( -0.013258  0.013315 ) ph/cm2/s
Energy fluence (15-150 keV)             : 1.58241e-05 ( -3.11343e-07  3.11642e-07 ) ergs/cm2
Cutoff power-law model
Time interval is from  -58.984 sec. to  294.824 sec.
Spectral model in the cutoff power-law:
------------------------------------------------------------
Parameters  : value       lower 90%   higher 90%
Photon index: -1.49736     ( -0.0388137   0.12287 )
Epeak [keV] : 9996.69      ( -9997.38 -9997.38 )
Norm@50keV  : 4.72877E-03    ( -9.04228e-05   0.000599734 )
------------------------------------------------------------
#Fit statistic : Chi-Squared =          46.04 using 59 PHA bins.
# Reduced chi-squared =         0.8222 for     56 degrees of freedom
# Null hypothesis probability =   8.262459e-01

Photon flux (15-150 keV)    in 353.8 sec: 0.590024 ( -0.020137  0.015656 ) ph/cm2/s
Energy fluence (15-150 keV)             : 1.58525e-05 ( 0  0 ) ergs/cm2
1-s peak spectrum fit
Power-law model
Time interval is from  208.760 sec. to  209.760 sec.

Spectral model in power-law:
------------------------------------------------------------
Parameters  : value       lower 90%   higher 90%
Photon index: -1.1817     ( -0.0634179   0.0635529 )
Norm@50keV  : 6.63204E-02    ( -0.00226863   0.00226857 )
------------------------------------------------------------
#Fit statistic : Chi-Squared =          52.53 using 59 PHA bins.
# Reduced chi-squared =         0.9216 for     57 degrees of freedom
# Null hypothesis probability =   6.432201e-01

Photon flux (15-150 keV)    in 1 sec: 7.76523 ( -0.27474  0.27513 ) ph/cm2/s
Energy fluence (15-150 keV)             : 6.76441e-07 ( -2.59819e-08  2.60649e-08 ) ergs/cm2
Cutoff power-law model
Time interval is from  208.760 sec. to  209.760 sec.
Spectral model in the cutoff power-law:
------------------------------------------------------------
Parameters  : value       lower 90%   higher 90%
Photon index: -1.1668     ( -0.0663041   0.21629 )
Epeak [keV] : 9887.13      ( -9999.32 -9999.32 )
Norm@50keV  : 6.73231E-02    ( -0.00226184   0.00229674 )
------------------------------------------------------------
#Fit statistic : Chi-Squared =          52.86 using 59 PHA bins.
# Reduced chi-squared =         0.9440 for     56 degrees of freedom
# Null hypothesis probability =   5.943739e-01

Photon flux (15-150 keV)    in 1 sec: 2.94876 ( -0.4273  0.58699 ) ph/cm2/s
Energy fluence (15-150 keV)             : 6.77876e-07 ( -3.4196e-08  2.61845e-08 ) ergs/cm2
Time-resolved spectra
Distribution
T90 vs. Hardness ratio plot
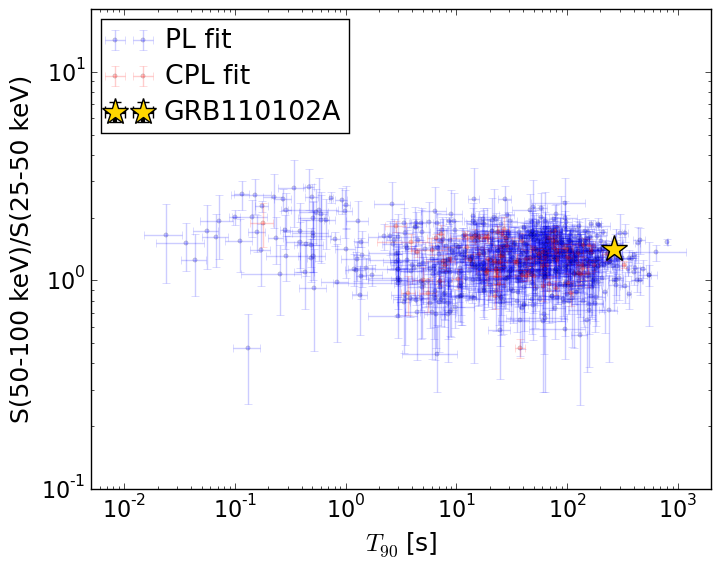
T90                                   = 265.916 sec.
Hardness ratio (energy fluence ratio) = 1.41393693825
S(15-50 keV) vs. S(50-150 keV) plot
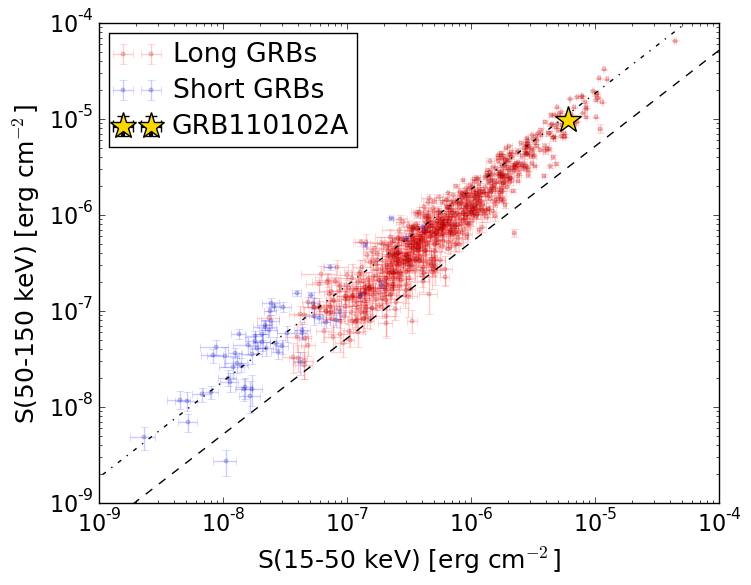
S(15-50 keV)  = 6.044406e-06
S(50-150 keV) = 9.7797e-06
The dash-dotted line and the dashed line traces the fluences calculated from the Band function with Epeak = 15 and 150 keV, respectively. Both lines assume a canonical values of alpha = -1 and beta = -2.5.
Mask shadow pattern
IMX = 7.257620045731079E-01, IMY = 1.936348075317588E-01
Spacecraft aspect plot
Bright source in the pre-burst/pre-slew/post-slew images
Pre-burst image of 15-350 keV band
Time interval of the image:
Pre-slew background subtracted image of 15-350 keV band
Time interval of the image:
-9.099400 73.100600

# RAcent  DECcent POSerr Theta    Phi  PeakCts   SNR AngSep     Name
#  [deg]    [deg]    ['] [deg]  [deg]                   [']
244.9902 -15.6055    3.3  53.8  -37.9   1.8881   3.5    2.2	Sco X-1
254.4692  35.3669    1.9  22.9   38.5   0.7408   6.1    1.6	Her X-1
268.3198  -1.3382    4.0  29.9  -57.7   0.4281   2.9    7.4	SW J1753.5-0127
273.8424 -13.9062    0.0  40.9  -72.1  -0.2193  -0.6   12.3	GX 17+2
288.7450  10.8765    3.1  18.1 -111.5   0.4138   3.7    5.2	GRS 1915+105
299.6421  35.1986    1.1  19.4  158.8   1.1872  11.0    2.5	Cyg X-1
307.9208  41.0090   17.8  27.6  151.3  -0.0961  -0.6    9.2	Cyg X-3
326.0396  38.2630   12.4  40.7  161.3   0.2089   0.9    7.1	Cyg X-2
245.8788   7.6135    0.9  36.9  -14.9   1.8500  12.8 ------	UNKNOWN
320.7316  11.9335    3.5  41.6 -157.6   0.5922   3.3 ------	UNKNOWN
290.2195   2.5300    2.4  26.3 -105.5   0.6727   4.9 ------	UNKNOWN
249.0754 -16.2912    3.1  52.0  -42.3   2.3800   4.4 ------	UNKNOWN
248.8644 -16.3305    3.5  52.1  -42.1   2.5454   4.6 ------	UNKNOWN
Post-slew image of 15-350 keV band
Time interval of the image:
137.500590 963.062100

# RAcent  DECcent POSerr Theta    Phi  PeakCts   SNR AngSep     Name
#  [deg]    [deg]    ['] [deg]  [deg]                   [']
244.9782 -15.6400    0.3  23.2  -38.5  28.2598  45.2    0.1	Sco X-1
254.4717  35.3670    1.7  28.9  153.9   5.8933   6.7    1.6	Her X-1
256.2217 -37.8135    7.2  46.4  -52.0  -4.0499  -1.6   11.3	4U 1700-377
256.3848 -36.5226    5.0  45.2  -52.6   4.9974   2.3    6.4	GX 349+2
263.0661 -24.7635    2.9  36.4  -67.6   4.9763   4.0    3.3	GX 1+4
268.3510  -1.4781    1.7  24.2 -109.6   4.6373   6.8    1.8	SW J1753.5-0127
270.3773 -25.1240    5.8  40.5  -76.1   4.1686   2.0    5.7	GX 5-1
270.3893 -25.6552    9.9  40.9  -75.6   2.5000   1.2    7.1	GRS 1758-258
273.9841 -14.0326    5.5  35.3  -93.0   2.5060   2.1    1.3	GX 17+2
288.7727  11.0020    2.7  42.4 -138.8   4.8262   4.3    3.7	GRS 1915+105
299.7260  35.3102    9.4  56.4 -168.5   3.0757   1.3    9.3	Cyg X-1
262.8285 -33.8984   14.8  44.5  -60.9   1.7741   0.8    8.9	GX 354-0
222.0962  42.6694    2.2  40.9  112.3  13.8420   5.1 ------	UNKNOWN
206.2260 -32.5968    3.5  55.1    0.2   8.5025   3.3 ------	UNKNOWN
245.8649   7.6188    0.3   0.0  106.7  20.0237  33.9 ------	UNKNOWN
298.3225  37.9605    2.5  56.1 -171.9  11.2703   4.6 ------	UNKNOWN
216.0965 -45.6954    3.2  59.6  -17.0  12.5563   3.6 ------	UNKNOWN