Analysis Summary
Notes:
- 1) No attempt has been made to eliminate the non-significant decimal places.
- 2) This batgrbproduct analysis is done using the HEASARC data.
- 3) This batgrbproduct analysis is using the flight position for the mask-weighting calculation.
======================================================================
                  BAT GRB EVENT DATA PROCESSING REPORT
    Process Script Ver: batgrbproduct v2.46
    Process Start Time: Tue Jan 14 00:58:20 EST 2014
             Host Name: batevent1
   Current Working Dir: /local/data/batevent/batevent_reproc/trigger441664
======================================================================

  Trigger: 00441664      Segment: 000

  BAT Trigger Time: 316020322.752   [s; MET]
      Trigger Stop: 316020323.776   [s; MET]
               UTC: 2011-01-06T15:25:16.214380    [includes UTCF correction]
       Where From?: TDRSS position message

  BAT
    RA: 79.2851643424613   Dec: 64.1838497908165  [deg; J2000]

     Catalogged Source?: NO
     Point Source?:      YES
     GRB Indicated?:     YES    [ by BAT flight software ]
     Image S/N Ratio:    8.16
     Image Trigger?:     NO
     Rate S/N Ratio:     11.5325625946708  [ if not an image trigger ]
     Image S/N Ratio:    8.16

  Analysis Position:   [ source = BAT ]
    RA: 79.2851643424613   Dec: 64.1838497908165  [deg; J2000]

  Refined Position:   [ source = BAT pre-slew burst ]
    RA: 79.2888078543487   Dec: 64.1912658262473  [deg; J2000]
        { 05h 17m 09.3s , +64d 11' 28.6" }
         +/- 2.20624127808641 [arcmin] (estimated 90% radius based on SNR)
         +/- 0.841460715950811 [arcmin] (formal 1-sigma fit error)
    SNR: 9.82167398914728

  Angular difference between the analysis and refined position is 0.455030 arcmin

  Partial Coding Fraction: 0.34375    [ including projection effects ]

  Duration
     T90: 3 +/- 1.4142135623731
        Measured from: -0.751999974250793
                   to: 2.24800002574921     [s; relative to TRIGTIME]
     T50: 1 +/- 1
        Measured from: 0.248000025749207
                   to: 1.24800002574921     [s; relative to TRIGTIME]


  Fluence
     Peak Flux  (peak 1 second)
        Measured from: 0.248000025749207
                   to: 1.24800002574921     [s; relative to TRIGTIME]
     Total Fluence
        Measured from: -0.751999974250793
                   to: 2.24800002574921     [s; relative to TRIGTIME]

             Band 1     Band 2     Band 3     Band 4
              15-25      25-50     50-100    100-350     keV
 Total     0.092123   0.165090   0.086249   0.027852
           0.020246   0.021144   0.018782   0.015295 [error]
 Peak      0.038560   0.099632   0.049193   0.014236
           0.011763   0.012928   0.011516   0.008839 [error]

     [ fluence units of on-axis counts / fully illuminated detector ]

======================================================================


====== Table of the duration information =============================

        Value   tstart    tstop
T100    3.000   -0.752    2.248
T90     3.000   -0.752    2.248
T50     1.000    0.248    1.248
Peak    1.000    0.248    1.248


====== Spectral Analysis Summary =====================================

Model      : spectral model: simple power-law (PL) and cutoff power-law (CPL)
Ph_index   : photon index: E^{Ph_index}
Ph_90err   : 90% error of the photon index
Epeak      : Epeak in keV
Epeak_90err: 90% error of Epeak
Norm       : normalization at 50 keV in both the PL model and CPL model
Nomr_90err : 90% error of the normalization
chi2       : Chi-Squared
dof        : degree of freedo

=== Time-averaged spectral analysis ===
(Best model with acceptable fit: PL)

Model Ph_index Ph_90err_low Ph_90err_hi  Epeak  Epeak_90err_low  Epeak_90err_hi  Norm       Nomr_90err_low    Norm_90err_hi    chi2    dof
PL      -1.569    -0.277      0.274       -           -               -         8.46e-03     -1.42e-03          1.41e-03      64.860   57
CPL     -1.236    -1.164      1.267      110.936    -110.936      -110.936      1.27e-02     -5.23e-03          4.70e-02      64.560   56


=== 1-s peak spectral analysis ===
(Best model with acceptable fit: PL)

Model Ph_index Ph_90err_low Ph_90err_hi  Epeak  Epeak_90err_low  Epeak_90err_hi  Norm       Nomr_90err_low    Norm_90err_hi    chi2    dof
PL      -1.646     -0.313     0.303       -           -               -         1.28e-02     -2.59e-03          2.56e-03      70.850   57
CPL     -0.636     -1.314     2.253       61.056     -14.318       -61.056      4.64e-02     -4.64e-02          9.69e-01      69.350   56


=== Fluence/Peak Flux Summary ===

              Model    Band1     Band2     Band3     Band4     Band5     Total
                       15-25     25-50    50-100    100-350    15-150    15-350    keV
Fluence         PL   3.46e-08  6.09e-08  8.21e-08  2.28e-07  2.38e-07  4.05e-07   erg/cm2
      90%_error_low -9.10e-09 -1.05e-08 -1.75e-08 -8.71e-08 -4.25e-08 -1.05e-07   erg/cm2
      90%_error_hi   9.67e-09  1.04e-08  1.73e-08  1.17e-07  4.29e-08  1.27e-07   erg/cm2
Peak flux       PL   6.08e-01  5.61e-01  3.59e-01  3.53e-01  1.67e+00  1.88e+00   ph/cm2/s
      90%_error_low -1.75e-01 -1.11e-01 -8.92e-02 -1.45e-01 -3.25e-01 -3.61e-01   ph/cm2/s
      90%_error_hi   1.87e-01  1.11e-01  8.83e-02  1.92e-01  3.26e-01  3.62e-01   ph/cm2/s

Fluence        CPL   3.31e-08  6.36e-08  8.39e-08  1.35e-07  2.33e-07  3.16e-07   erg/cm2
      90%_error_low -1.02e-08 -1.25e-08 -1.86e-08 -1.07e-07 -4.71e-08 -1.19e-07   erg/cm2
      90%_error_hi   1.05e-08  1.39e-08  1.92e-08  2.20e-07  4.58e-08  1.34e-07   erg/cm2
Peak flux      CPL   5.42e-01  6.36e-01  3.75e-01  1.17e-01  1.64e+00  1.67e+00   ph/cm2/s
      90%_error_low -1.96e-01 -1.51e-01 -1.06e-01 -1.17e-01 -3.31e-01 -3.53e-01   ph/cm2/s
      90%_error_hi   2.08e-01  1.72e-01  1.05e-01  3.00e-01  3.31e-01  4.47e-01   ph/cm2/s

======================================================================
Image
Pre-slew 15.0-350.0 keV image (Event data)
#   RAcent    DECcent   POSerr    Theta     Phi              Peak Cts       SNR   Name
   79.2888    64.1913   0.0196    44.2350   173.5517         0.3888617      9.822 TRIG_00441664

Foreground time interval of the image:
 -0.752   2.248 (delta_t =   3.000 [sec])
Background time interval of the image:
-515.551 -488.687 (delta_t =  26.864 [sec])
-239.752  -0.752 (delta_t = 239.000 [sec])
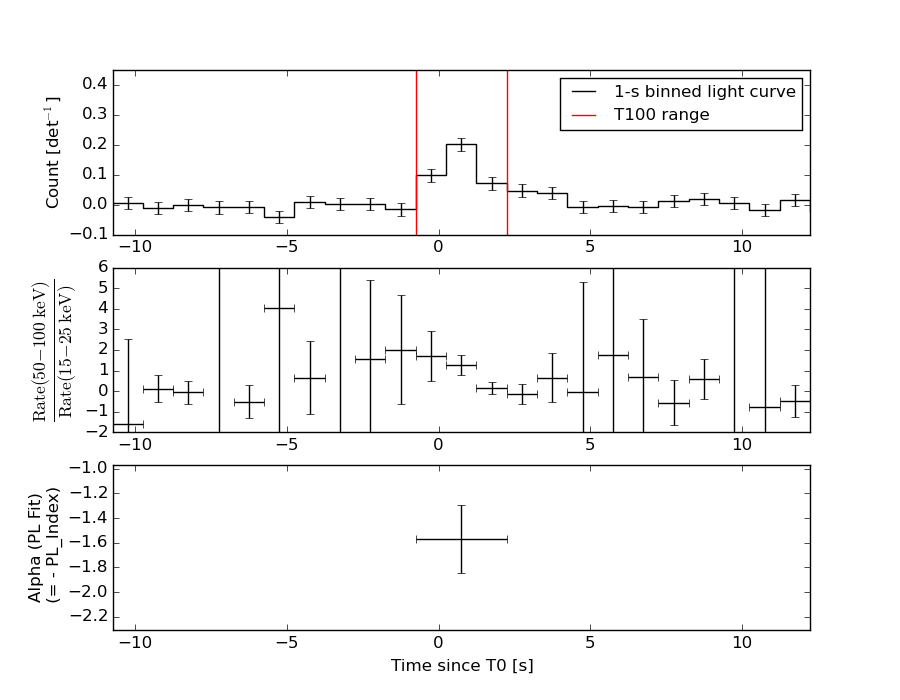
Light Curves
Note: The mask-weighted lightcurves have units of either count/det or counts/sec/det, where a det is 0.4 x 0.4 = 0.16 sq cm.
Full-time range; 1 s binning
Other quick-look light curves:
- 64 ms binning (zoomed)
- 16 ms binning (zoomed)
- 8 ms binning (zoomed)
- 2 ms binning (zoomed)
- SN=5 or 10 s binning (full-time range)
- Raw light curve
Spectra
- 64 ms binning (zoomed)
- 16 ms binning (zoomed)
- 8 ms binning (zoomed)
- 2 ms binning (zoomed)
- SN=5 or 10 s binning (full-time range)
- Raw light curve
Spectra
Notes:
- 1) The fitting includes the systematic errors.
- 2) When the burst includes telescope slew time periods, the fitting uses an average response file made from multiple 5-s response files through out the slew time plus single time preiod for the non-slew times, and weighted by the total counts in the corresponding time period using addrmf. An average response file is needed becuase a spectral fit using the pre-slew DRM will introduce some errors in both a spectral shape and a normalization if the PHA file contains a lot of the slew/post-slew time interval.
- 3) For fits to more complicated models (e.g. a power-law over a cutoff power-law), the BAT team has decided to require a chi-square improvement of more than 6 for each extra dof.
Time averaged spectrum fit using the average DRM
Power-law model
Time interval is from   -0.752 sec. to    2.248 sec.

Spectral model in power-law:
------------------------------------------------------------
Parameters  : value       lower 90%   higher 90%
Photon index: -1.56921     ( -0.277141   0.27414 )
Norm@50keV  : 8.46202E-03    ( -0.00142392   0.00141301 )
------------------------------------------------------------
#Fit statistic : Chi-Squared =          64.86 using 59 PHA bins.
# Reduced chi-squared =          1.138 for     57 degrees of freedom
# Null hypothesis probability =   2.215323e-01

Photon flux (15-150 keV)    in 3 sec: 1.07733 ( -0.181759  0.18227 ) ph/cm2/s
Energy fluence (15-150 keV)             : 2.38386e-07 ( -4.24743e-08  4.28694e-08 ) ergs/cm2
Cutoff power-law model
Time interval is from   -0.752 sec. to    2.248 sec.
Spectral model in the cutoff power-law:
------------------------------------------------------------
Parameters  : value       lower 90%   higher 90%
Photon index: -1.23576     ( -1.1638   1.26694 )
Epeak [keV] : 110.936      ( -110.964 -110.964 )
Norm@50keV  : 1.26831E-02    ( -0.00523268   0.0470166 )
------------------------------------------------------------
#Fit statistic : Chi-Squared =          64.56 using 59 PHA bins.
# Reduced chi-squared =          1.153 for     56 degrees of freedom
# Null hypothesis probability =   2.023061e-01

Photon flux (15-150 keV)    in 3 sec: 1.06707 ( -0.184479  0.18488 ) ph/cm2/s
Energy fluence (15-150 keV)             : 2.32944e-07 ( -4.71417e-08  4.58229e-08 ) ergs/cm2
1-s peak spectrum fit
Power-law model
Time interval is from    0.248 sec. to    1.248 sec.

Spectral model in power-law:
------------------------------------------------------------
Parameters  : value       lower 90%   higher 90%
Photon index: -1.64572     ( -0.312895   0.303448 )
Norm@50keV  : 1.28451E-02    ( -0.00259323   0.00255811 )
------------------------------------------------------------
#Fit statistic : Chi-Squared =          70.85 using 59 PHA bins.
# Reduced chi-squared =          1.243 for     57 degrees of freedom
# Null hypothesis probability =   1.027483e-01

Photon flux (15-150 keV)    in 1 sec: 1.67496 ( -0.32535  0.32597 ) ph/cm2/s
Energy fluence (15-150 keV)             : 1.19536e-07 ( -2.5106e-08  2.54046e-08 ) ergs/cm2
Cutoff power-law model
Time interval is from    0.248 sec. to    1.248 sec.
Spectral model in the cutoff power-law:
------------------------------------------------------------
Parameters  : value       lower 90%   higher 90%
Photon index: -0.636088     ( -1.3142   2.25295 )
Epeak [keV] : 61.0558      ( -14.2979 -61.0359 )
Norm@50keV  : 4.63920E-02    ( -0.0464481   0.96896 )
------------------------------------------------------------
#Fit statistic : Chi-Squared =          69.35 using 59 PHA bins.
# Reduced chi-squared =          1.238 for     56 degrees of freedom
# Null hypothesis probability =   1.084300e-01

Photon flux (15-150 keV)    in 1 sec: 1.63868 ( -0.33078  0.33078 ) ph/cm2/s
Energy fluence (15-150 keV)             : 1.10838e-07 ( -2.91741e-08  2.85675e-08 ) ergs/cm2
Time-resolved spectra
Distribution
T90 vs. Hardness ratio plot
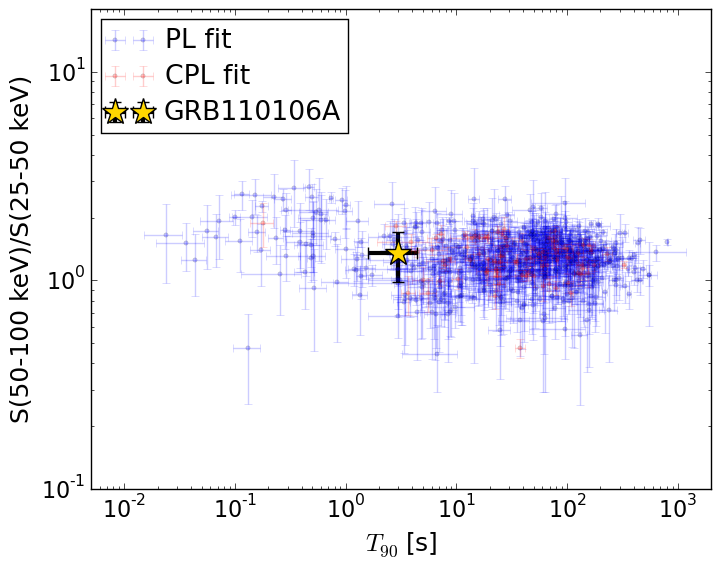
T90                                   = 3.0 sec.
Hardness ratio (energy fluence ratio) = 1.34803133556
S(15-50 keV) vs. S(50-150 keV) plot
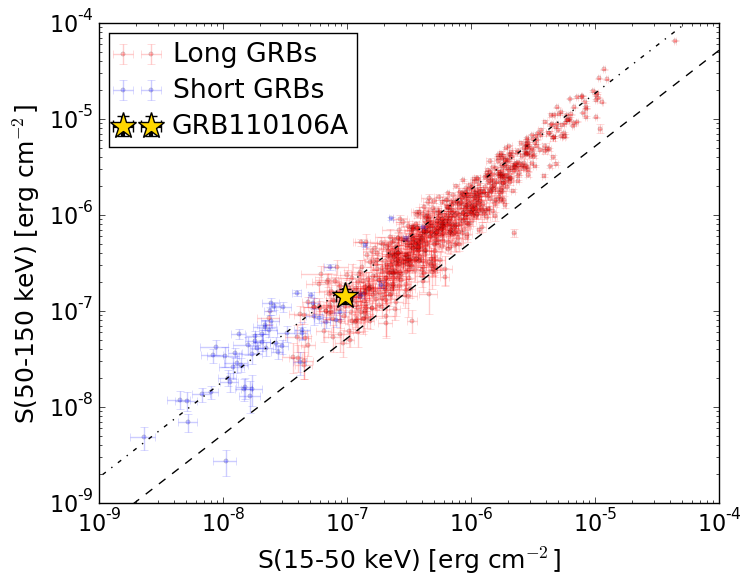
S(15-50 keV)  = 9.552225e-08
S(50-150 keV) = 1.4286297e-07
The dash-dotted line and the dashed line traces the fluences calculated from the Band function with Epeak = 15 and 150 keV, respectively. Both lines assume a canonical values of alpha = -1 and beta = -2.5.
Mask shadow pattern
IMX = -9.674886340401854E-01, IMY = -1.093474487486454E-01
Spacecraft aspect plot
Bright source in the pre-burst/pre-slew/post-slew images
Pre-burst image of 15-350 keV band
Time interval of the image:
-515.551400 -488.687000
-239.752000 -0.752000

# RAcent  DECcent POSerr Theta    Phi  PeakCts   SNR AngSep     Name
#  [deg]    [deg]    ['] [deg]  [deg]                   [']
101.1183  30.2729    2.2  40.4  118.2   3.8992   5.3 ------	UNKNOWN
160.3167  14.1197    2.3  29.9    8.7   1.1662   4.9 ------	UNKNOWN
165.6803  67.3611    2.9  26.2 -136.6   0.9062   4.0 ------	UNKNOWN
194.5105  -0.3249    3.6  58.7  -25.9   4.9541   3.2 ------	UNKNOWN
200.0597  13.6426    3.8  51.9  -42.2   3.6259   3.1 ------	UNKNOWN
205.9678  38.1128    3.0  42.3  -74.0   3.4147   3.9 ------	UNKNOWN
Pre-slew background subtracted image of 15-350 keV band
Time interval of the image:
-0.752000 2.248000

# RAcent  DECcent POSerr Theta    Phi  PeakCts   SNR AngSep     Name
#  [deg]    [deg]    ['] [deg]  [deg]                   [']
108.7013  43.9098    2.3  29.6  136.4   0.1363   4.9 ------	UNKNOWN
 79.2888  64.1913    1.2  44.2  173.6   0.3888   9.8 ------	UNKNOWN
199.8807  43.7206    2.4  36.0  -79.8   0.1884   4.8 ------	UNKNOWN
217.8520  73.5540    2.7  43.4 -127.9   0.2160   4.3 ------	UNKNOWN
203.4457  43.2254    2.6  38.6  -80.3   0.2575   4.5 ------	UNKNOWN
Post-slew image of 15-350 keV band
Time interval of the image:
89.948610 162.348600

# RAcent  DECcent POSerr Theta    Phi  PeakCts   SNR AngSep     Name
#  [deg]    [deg]    ['] [deg]  [deg]                   [']
 83.6444  22.0207    1.7  42.3  121.7   3.0729   6.9    0.7	Crab
138.6816  34.5345    2.7  46.1   48.1   2.2163   4.2 ------	UNKNOWN
117.5867  56.6089    2.4  20.0   42.0   0.5222   4.8 ------	UNKNOWN
 51.0625  49.0457    2.2  21.4 -174.0   0.5239   5.2 ------	UNKNOWN
 54.7942  55.7085    2.2  14.8 -166.0   0.4933   5.3 ------	UNKNOWN
 38.2370  66.2748    2.1  17.0 -117.1   0.5402   5.5 ------	UNKNOWN
207.0103  52.4134    2.4  56.5  -17.0   1.8488   4.9 ------	UNKNOWN
217.5078  76.6975    2.3  36.7  -37.5   0.7066   4.9 ------	UNKNOWN
241.2071  63.0794    2.9  52.0  -42.1   2.2137   3.9 ------	UNKNOWN
  0.6559  41.5585    2.6  48.6 -130.4   2.1207   4.5 ------	UNKNOWN