Analysis Summary
Notes:
- 1) No attempt has been made to eliminate the non-significant decimal places.
- 2) This batgrbproduct analysis is done using the HEASARC data.
- 3) This batgrbproduct analysis is using the flight position for the mask-weighting calculation.
======================================================================
                  BAT GRB EVENT DATA PROCESSING REPORT
    Process Script Ver: batgrbproduct v2.46
    Process Start Time: Tue Jan 14 00:50:11 EST 2014
             Host Name: batevent1
   Current Working Dir: /local/data/batevent/batevent_reproc/trigger442039
======================================================================

  Trigger: 00442039      Segment: 000

  BAT Trigger Time: 316498345.024   [s; MET]
      Trigger Stop: 316498345.536   [s; MET]
               UTC: 2011-01-12T04:12:18.468660    [includes UTCF correction]
       Where From?: TDRSS position message

  BAT
    RA: 329.940686625488   Dec: 26.4889696785716  [deg; J2000]

     Catalogged Source?: NO
     Point Source?:      YES
     GRB Indicated?:     YES    [ by BAT flight software ]
     Image S/N Ratio:    7.19
     Image Trigger?:     NO
     Rate S/N Ratio:     8.12403840463596  [ if not an image trigger ]
     Image S/N Ratio:    7.19

  Analysis Position:   [ source = BAT ]
    RA: 329.940686625488   Dec: 26.4889696785716  [deg; J2000]

  Refined Position:   [ source = BAT pre-slew burst ]
    RA: 329.931497203065   Dec: 26.4718766762079  [deg; J2000]
        { 21h 59m 43.6s , +26d 28' 18.8" }
         +/- 2.62682322334628 [arcmin] (estimated 90% radius based on SNR)
         +/- 1.4544386097635 [arcmin] (formal 1-sigma fit error)
    SNR: 7.65475782623594

  Angular difference between the analysis and refined position is 1.138146 arcmin

  Partial Coding Fraction: 0.8671875    [ including projection effects ]

  Duration
     T90: 0.523999989032745 +/- 0.147187001532429
        Measured from: -0.0640000104904175
                   to: 0.459999978542328     [s; relative to TRIGTIME]
     T50: 0.219999969005585 +/- 0.172046507558103
        Measured from: 0.0680000185966492
                   to: 0.287999987602234     [s; relative to TRIGTIME]


  Fluence
     Peak Flux  (peak 1 second)
        Measured from: -0.283999979496002
                   to: 0.716000020503998     [s; relative to TRIGTIME]
     Total Fluence
        Measured from: -0.0719999670982361
                   to: 0.504000008106232     [s; relative to TRIGTIME]

             Band 1     Band 2     Band 3     Band 4
              15-25      25-50     50-100    100-350     keV
 Total     0.024000   0.024472   0.011728   0.005901
           0.005157   0.005126   0.004606   0.004281 [error]
 Peak      0.023350   0.025135   0.012802   0.002260
           0.006589   0.006599   0.005959   0.005619 [error]

     [ fluence units of on-axis counts / fully illuminated detector ]

======================================================================


====== Table of the duration information =============================

        Value   tstart    tstop
T100    0.576   -0.072    0.504
T90     0.524   -0.064    0.460
T50     0.220    0.068    0.288
Peak    1.000   -0.284    0.716


====== Spectral Analysis Summary =====================================

Model      : spectral model: simple power-law (PL) and cutoff power-law (CPL)
Ph_index   : photon index: E^{Ph_index}
Ph_90err   : 90% error of the photon index
Epeak      : Epeak in keV
Epeak_90err: 90% error of Epeak
Norm       : normalization at 50 keV in both the PL model and CPL model
Nomr_90err : 90% error of the normalization
chi2       : Chi-Squared
dof        : degree of freedo

=== Time-averaged spectral analysis ===
(Best model with acceptable fit: PL)

Model Ph_index Ph_90err_low Ph_90err_hi  Epeak  Epeak_90err_low  Epeak_90err_hi  Norm       Nomr_90err_low    Norm_90err_hi    chi2    dof
PL      -2.124    -0.497      0.424       -           -               -         5.54e-03     -1.90e-03          1.84e-03      46.640   57
CPL     -0.889    -1.217      3.338       33.689      N/A           N/A         3.23e-02        N/A               N/A         45.470   56


=== 1-s peak spectral analysis ===
(Best model with acceptable fit: N/A)

Model Ph_index Ph_90err_low Ph_90err_hi  Epeak  Epeak_90err_low  Epeak_90err_hi  Norm       Nomr_90err_low    Norm_90err_hi    chi2    dof
PL      -1.842     -0.561     0.501       -           -               -         3.61e-03     -1.35e-03          1.31e-03      74.660   57
CPL      0.093     -2.239     5.318       42.273      N/A           N/A         5.25e-02        N/A               N/A         72.640   56


=== Fluence/Peak Flux Summary ===

              Model    Band1     Band2     Band3     Band4     Band5     Total
                       15-25     25-50    50-100    100-350    15-150    15-350    keV
Fluence         PL   7.35e-09  9.26e-09  8.50e-09  1.36e-08  2.97e-08  3.87e-08   erg/cm2
      90%_error_low -2.14e-09 -2.35e-09 -3.67e-09 -8.67e-09 -8.73e-09 -1.43e-08   erg/cm2
      90%_error_hi   2.20e-09  2.29e-09  4.04e-09  1.55e-08  9.35e-09  1.97e-08   erg/cm2
Peak flux       PL   2.07e-01  1.70e-01  9.49e-02  7.81e-02  5.06e-01  5.50e-01   ph/cm2/s
      90%_error_low -8.18e-02 -5.14e-02 -4.33e-02 -5.12e-02 -1.53e-01 -1.70e-01   ph/cm2/s
      90%_error_hi   8.75e-02  5.14e-02  4.62e-02  9.08e-02  1.53e-01  1.74e-01   ph/cm2/s

Fluence        CPL   6.97e-09  1.07e-08  7.24e-09  1.84e-09  2.64e-08  2.68e-08   erg/cm2
      90%_error_low -2.42e-09 -3.15e-09 -5.01e-09    N/A    -8.17e-09 -8.54e-09   erg/cm2
      90%_error_hi   2.36e-09  3.47e-09  4.89e-09    N/A     1.05e-08  2.53e-08   erg/cm2
Peak flux      CPL   1.78e-01  2.14e-01  8.19e-02  6.88e-03  4.80e-01  4.81e-01   ph/cm2/s
      90%_error_low -9.52e-02 -7.29e-02 -6.12e-02 -6.88e-03 -1.50e-01 -1.51e-01   ph/cm2/s
      90%_error_hi   9.75e-02  8.01e-02  5.92e-02  9.60e-02  1.53e-01  1.58e-01   ph/cm2/s

======================================================================
Image
Pre-slew 15.0-350.0 keV image (Event data)
#   RAcent    DECcent   POSerr    Theta     Phi              Peak Cts       SNR   Name
  329.9315    26.4719   0.0252    18.9451   147.6612         0.0677049      7.655 TRIG_00442039

Foreground time interval of the image:
 -0.072   0.504 (delta_t =   0.576 [sec])
Background time interval of the image:
-239.024  -0.072 (delta_t = 238.952 [sec])
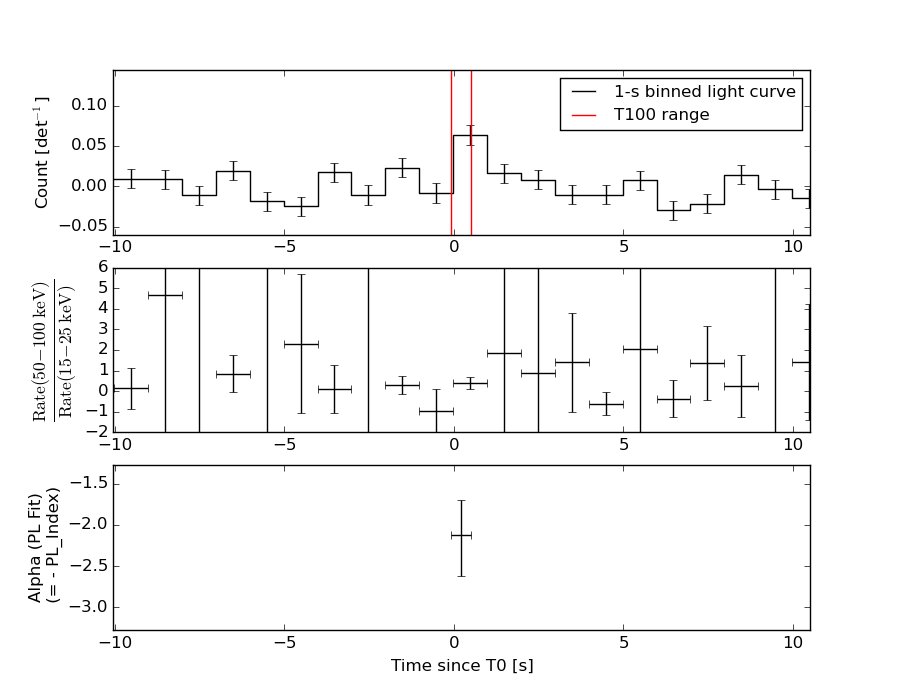
Light Curves
Note: The mask-weighted lightcurves have units of either count/det or counts/sec/det, where a det is 0.4 x 0.4 = 0.16 sq cm.
Full-time range; 1 s binning
Other quick-look light curves:
- 64 ms binning (zoomed)
- 16 ms binning (zoomed)
- 8 ms binning (zoomed)
- 2 ms binning (zoomed)
- SN=5 or 10 s binning (full-time range)
- Raw light curve
Spectra
- 64 ms binning (zoomed)
- 16 ms binning (zoomed)
- 8 ms binning (zoomed)
- 2 ms binning (zoomed)
- SN=5 or 10 s binning (full-time range)
- Raw light curve
Spectra
Notes:
- 1) The fitting includes the systematic errors.
- 2) When the burst includes telescope slew time periods, the fitting uses an average response file made from multiple 5-s response files through out the slew time plus single time preiod for the non-slew times, and weighted by the total counts in the corresponding time period using addrmf. An average response file is needed becuase a spectral fit using the pre-slew DRM will introduce some errors in both a spectral shape and a normalization if the PHA file contains a lot of the slew/post-slew time interval.
- 3) For fits to more complicated models (e.g. a power-law over a cutoff power-law), the BAT team has decided to require a chi-square improvement of more than 6 for each extra dof.
Time averaged spectrum fit using the average DRM
Power-law model
Time interval is from   -0.072 sec. to    0.504 sec.

Spectral model in power-law:
------------------------------------------------------------
Parameters  : value       lower 90%   higher 90%
Photon index: -2.12372     ( -0.496848   0.423852 )
Norm@50keV  : 5.54291E-03    ( -0.00189762   0.00183566 )
------------------------------------------------------------
#Fit statistic : Chi-Squared =          46.64 using 59 PHA bins.
# Reduced chi-squared =         0.8182 for     57 degrees of freedom
# Null hypothesis probability =   8.347757e-01

Photon flux (15-150 keV)    in 0.576 sec: 0.882470 ( -0.207503  0.20761 ) ph/cm2/s
Energy fluence (15-150 keV)             : 2.97415e-08 ( -8.72726e-09  9.34733e-09 ) ergs/cm2
Cutoff power-law model
Time interval is from   -0.072 sec. to    0.504 sec.
Spectral model in the cutoff power-law:
------------------------------------------------------------
Parameters  : value       lower 90%   higher 90%
Photon index: -0.888613     ( -1.22155   3.33423 )
Epeak [keV] : 33.6892      (   )
Norm@50keV  : 3.22977E-02    (     )
------------------------------------------------------------
#Fit statistic : Chi-Squared =          45.47 using 59 PHA bins.
# Reduced chi-squared =         0.8120 for     56 degrees of freedom
# Null hypothesis probability =   8.415607e-01

Photon flux (15-150 keV)    in 0.576 sec: 0.857807 ( -0.207059  0.209533 ) ph/cm2/s
Energy fluence (15-150 keV)             : 2.63883e-08 ( -8.17068e-09  1.04943e-08 ) ergs/cm2
1-s peak spectrum fit
Power-law model
Time interval is from   -0.284 sec. to    0.716 sec.

Spectral model in power-law:
------------------------------------------------------------
Parameters  : value       lower 90%   higher 90%
Photon index: -1.84172     ( -0.561888   0.499921 )
Norm@50keV  : 3.61406E-03    ( -0.00135356   0.00130995 )
------------------------------------------------------------
#Fit statistic : Chi-Squared =          74.66 using 59 PHA bins.
# Reduced chi-squared =          1.310 for     57 degrees of freedom
# Null hypothesis probability =   5.821682e-02

Photon flux (15-150 keV)    in 1 sec: 0.506325 ( -0.152808  0.152818 ) ph/cm2/s
Energy fluence (15-150 keV)             : 3.32491e-08 ( -1.18941e-08  1.27999e-08 ) ergs/cm2
Cutoff power-law model
Time interval is from   -0.284 sec. to    0.716 sec.
Spectral model in the cutoff power-law:
------------------------------------------------------------
Parameters  : value       lower 90%   higher 90%
Photon index: 0.0933134     ( -2.27462   5.28246 )
Epeak [keV] : 42.2734      (   )
Norm@50keV  : 5.24666E-02    (     )
------------------------------------------------------------
#Fit statistic : Chi-Squared =          72.64 using 59 PHA bins.
# Reduced chi-squared =          1.297 for     56 degrees of freedom
# Null hypothesis probability =   6.671734e-02

Photon flux (15-150 keV)    in 1 sec: 0.480170 ( -0.15009  0.153001 ) ph/cm2/s
Energy fluence (15-150 keV)             : 2.74069e-08 ( -1.00705e-08  1.37014e-08 ) ergs/cm2
Time-resolved spectra
Distribution
T90 vs. Hardness ratio plot
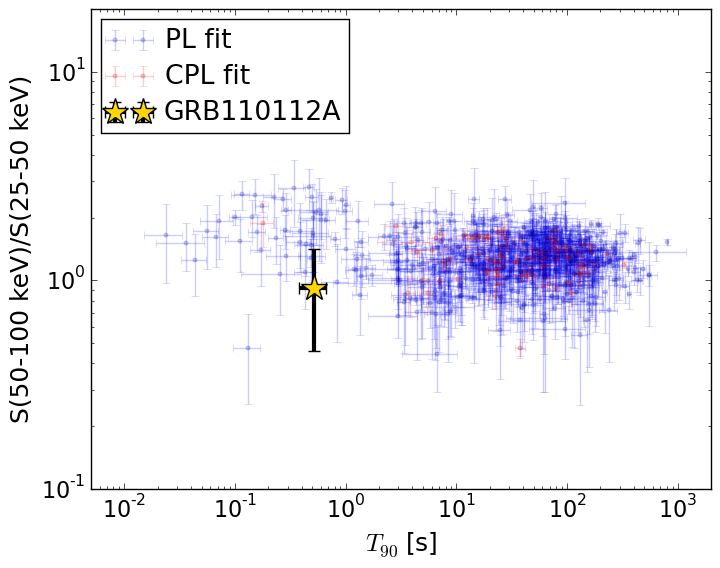
T90                                   = 0.524 sec.
Hardness ratio (energy fluence ratio) = 0.917909882563
S(15-50 keV) vs. S(50-150 keV) plot
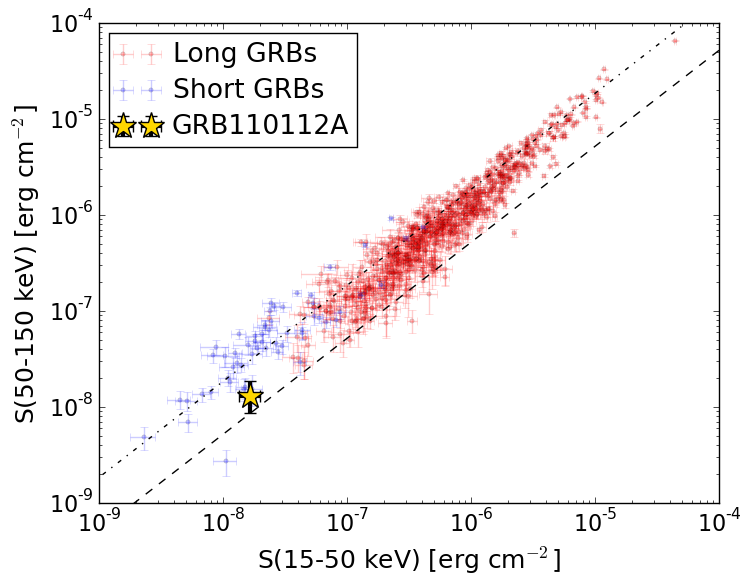
S(15-50 keV)  = 1.6603995e-08
S(50-150 keV) = 1.3138359e-08
The dash-dotted line and the dashed line traces the fluences calculated from the Band function with Epeak = 15 and 150 keV, respectively. Both lines assume a canonical values of alpha = -1 and beta = -2.5.
Mask shadow pattern
IMX = -2.900177082464261E-01, IMY = -1.836163409222701E-01
Spacecraft aspect plot
Bright source in the pre-burst/pre-slew/post-slew images
Pre-burst image of 15-350 keV band
Time interval of the image:
-239.024000 -0.072000

# RAcent  DECcent POSerr Theta    Phi  PeakCts   SNR AngSep     Name
#  [deg]    [deg]    ['] [deg]  [deg]                   [']
254.4926  35.4460    4.9  47.0   -1.4  -0.9177  -2.4    6.4	Her X-1
288.7876  10.9416    1.7  24.2  -61.8   1.7802   6.7    0.7	GRS 1915+105
299.5984  35.1981    1.0  12.0   24.6   2.1719  11.2    0.5	Cyg X-1
308.0999  40.9591    3.0  14.8   61.4   0.9219   3.9    0.6	Cyg X-3
326.1595  38.1987    7.3  19.0  109.6  -0.3884  -1.6    7.4	Cyg X-2
298.0526 -13.7506    3.2  41.2 -100.7   3.9448   3.6 ------	UNKNOWN
Pre-slew background subtracted image of 15-350 keV band
Time interval of the image:
-0.072000 0.504000

# RAcent  DECcent POSerr Theta    Phi  PeakCts   SNR AngSep     Name
#  [deg]    [deg]    ['] [deg]  [deg]                   [']
254.4994  35.2441    4.7  47.0   -1.7   0.0439   2.5    6.2	Her X-1
288.7513  11.0131    4.6  24.2  -61.6  -0.0259  -2.5    4.9	GRS 1915+105
299.4413  35.0912    4.7  12.0   23.8   0.0207   2.4    9.9	Cyg X-1
307.8460  40.8826    0.0  14.8   60.6  -0.0162  -1.7   12.7	Cyg X-3
326.2081  38.1135    0.0  18.9  109.9  -0.0109  -1.1   12.6	Cyg X-2
329.9314  26.4717    1.5  18.9  147.7   0.0677   7.7 ------	UNKNOWN
349.8246   7.4302    2.3  43.3  171.5   0.0867   5.1 ------	UNKNOWN
271.0699  35.9951    2.1  33.5   -0.2   0.0620   5.5 ------	UNKNOWN
246.0876  31.9977    2.7  54.4   -4.6   0.1243   4.3 ------	UNKNOWN
304.9515  -7.4822    2.7  33.8 -109.8   0.0662   4.3 ------	UNKNOWN
Post-slew image of 15-350 keV band
Time interval of the image:
59.276600 303.083600
360.976000 860.276580

# RAcent  DECcent POSerr Theta    Phi  PeakCts   SNR AngSep     Name
#  [deg]    [deg]    ['] [deg]  [deg]                   [']
288.8495  10.9351    6.2  41.7  -53.6   2.9795   1.9    3.1	GRS 1915+105
299.5744  35.2029    0.8  27.3  -13.6   6.8711  14.7    0.8	Cyg X-1
308.1354  40.9722    1.8  23.1    4.7   2.9676   6.3    1.6	Cyg X-3
326.0961  38.2878    4.4  12.2   36.0   1.2905   2.6    4.1	Cyg X-2
297.6299  49.1086    2.6  33.6   11.2   2.5792   4.4 ------	UNKNOWN
283.8361   8.5832    4.7  47.1  -53.3   6.3728   2.5 ------	UNKNOWN
306.3748  -7.4569    5.1  40.9  -92.4   5.5785   2.3 ------	UNKNOWN