Analysis Summary
Notes:
- 1) No attempt has been made to eliminate the non-significant decimal places.
- 2) This batgrbproduct analysis is done using the HEASARC data.
- 3) This batgrbproduct analysis is using the flight position for the mask-weighting calculation.
======================================================================
                  BAT GRB EVENT DATA PROCESSING REPORT
    Process Script Ver: batgrbproduct v2.46
    Process Start Time: Tue Jan 14 00:29:18 EST 2014
             Host Name: batevent1
   Current Working Dir: /local/data/batevent/batevent_reproc/trigger444643
======================================================================

  Trigger: 00444643      Segment: 000

  BAT Trigger Time: 318564168   [s; MET]
      Trigger Stop: 318564232   [s; MET]
               UTC: 2011-02-05T02:02:41.367420    [includes UTCF correction]
       Where From?: TDRSS position message

  BAT
    RA: 164.588577929917   Dec: 67.5160714352078  [deg; J2000]

     Catalogged Source?: NO
     Point Source?:      YES
     GRB Indicated?:     YES    [ by BAT flight software ]
     Image S/N Ratio:    10.04
     Image Trigger?:     YES
     Rate S/N Ratio:     0  [ if not an image trigger ]
     Image S/N Ratio:    10.04

  Analysis Position:   [ source = BAT ]
    RA: 164.588577929917   Dec: 67.5160714352078  [deg; J2000]

  Refined Position:   [ source = BAT pre-slew burst ]
    RA: 164.604035535156   Dec: 67.5319128004809  [deg; J2000]
        { 10h 58m 25.0s , +67d 31' 54.9" }
         +/- 2.19279854264686 [arcmin] (estimated 90% radius based on SNR)
         +/- 0.9214186084597 [arcmin] (formal 1-sigma fit error)
    SNR: 9.90780228776275

  Angular difference between the analysis and refined position is 1.014461 arcmin

  Partial Coding Fraction: 0.2929688    [ including projection effects ]

  Duration
     T90: 249.415999948978 +/- 15.0347185018493
        Measured from: 35.688000023365
                   to: 285.103999972343     [s; relative to TRIGTIME]
     T50: 103.427999913692 +/- 6.25424652328269
        Measured from: 115.276000022888
                   to: 218.703999936581     [s; relative to TRIGTIME]


  Fluence
     Peak Flux  (peak 1 second)
        Measured from: 210.439999997616
                   to: 211.439999997616     [s; relative to TRIGTIME]
     Total Fluence
        Measured from: -130.15600001812
                   to: 377.231999993324     [s; relative to TRIGTIME]

             Band 1     Band 2     Band 3     Band 4
              15-25      25-50     50-100    100-350     keV
 Total     8.410523  10.143950   7.020187   1.572839
           0.154099   0.160031   0.141811   0.124900 [error]
 Peak      0.102615   0.143083   0.128223   0.038884
           0.005912   0.006797   0.006422   0.004809 [error]

     [ fluence units of on-axis counts / fully illuminated detector ]

======================================================================


====== Table of the duration information =============================

        Value   tstart    tstop
T100  507.388 -130.156  377.232
T90   249.416   35.688  285.104
T50   103.428  115.276  218.704
Peak    1.000  210.440  211.440


====== Spectral Analysis Summary =====================================

Model      : spectral model: simple power-law (PL) and cutoff power-law (CPL)
Ph_index   : photon index: E^{Ph_index}
Ph_90err   : 90% error of the photon index
Epeak      : Epeak in keV
Epeak_90err: 90% error of Epeak
Norm       : normalization at 50 keV in both the PL model and CPL model
Nomr_90err : 90% error of the normalization
chi2       : Chi-Squared
dof        : degree of freedo

=== Time-averaged spectral analysis ===
(Best model with acceptable fit: PL)

Model Ph_index Ph_90err_low Ph_90err_hi  Epeak  Epeak_90err_low  Epeak_90err_hi  Norm       Nomr_90err_low    Norm_90err_hi    chi2    dof
PL      -1.672    -0.045      0.045       -           -               -         3.36e-03     -7.48e-05          7.48e-05      42.140   57
CPL     -1.588    -0.127      0.178      263.330    -168.101      -263.330      3.68e-03     -3.73e-04          7.47e-04      41.460   56


=== 1-s peak spectral analysis ===
(Best model with acceptable fit: PL)

Model Ph_index Ph_90err_low Ph_90err_hi  Epeak  Epeak_90err_low  Epeak_90err_hi  Norm       Nomr_90err_low    Norm_90err_hi    chi2    dof
PL      -1.344     -0.091     0.090       -           -               -         2.60e-02     -1.34e-03          1.33e-03      70.560   57
CPL     -1.226     -0.165     0.344      343.668    -343.668      -343.668      2.97e-02     -4.82e-03          1.34e-02      70.170   56


=== Fluence/Peak Flux Summary ===

              Model    Band1     Band2     Band3     Band4     Band5     Total
                       15-25     25-50    50-100    100-350    15-150    15-350    keV
Fluence         PL   2.56e-06  4.23e-06  5.32e-06  1.33e-05  1.58e-05  2.54e-05   erg/cm2
      90%_error_low -1.16e-07 -1.08e-07 -1.53e-07 -8.68e-07 -3.64e-07 -9.46e-07   erg/cm2
      90%_error_hi   1.18e-07  1.08e-07  1.53e-07  9.10e-07  3.65e-07  9.78e-07   erg/cm2
Peak flux       PL   9.20e-01  1.02e+00  8.01e-01  1.04e+00  3.12e+00  3.78e+00   ph/cm2/s
      90%_error_low -8.45e-02 -5.74e-02 -5.10e-02 -1.33e-01 -1.62e-01 -2.01e-01   ph/cm2/s
      90%_error_hi   8.70e-02  5.70e-02  5.07e-02  1.45e-01  1.62e-01  2.02e-01   ph/cm2/s

Fluence        CPL   2.51e-06  4.25e-06  5.34e-06  1.18e-05  1.57e-05  2.39e-05   erg/cm2
      90%_error_low -1.54e-07 -1.14e-07 -1.63e-07 -2.49e-06 -4.26e-07 -2.53e-06   erg/cm2
      90%_error_hi   1.36e-07  1.15e-07  1.65e-07  1.70e-06  4.24e-07  1.84e-06   erg/cm2
Peak flux      CPL   8.98e-01  1.03e+00  8.10e-01  9.05e-01  3.11e+00  3.64e+00   ph/cm2/s
      90%_error_low -1.03e-01 -6.32e-02 -5.57e-02 -2.85e-01 -1.68e-01 -3.38e-01   ph/cm2/s
      90%_error_hi   8.66e-02  6.42e-02  5.78e-02  1.74e-01  1.68e-01  3.16e-01   ph/cm2/s

======================================================================
Image
Pre-slew 15.0-350.0 keV image (Event data)
#   RAcent    DECcent   POSerr    Theta     Phi              Peak Cts       SNR   Name
  164.6040    67.5319   0.0194    43.2174   160.0189         2.7603191      9.908 TRIG_00444643

Foreground time interval of the image:
-70.099  72.101 (delta_t = 142.200 [sec])
Background time interval of the image:
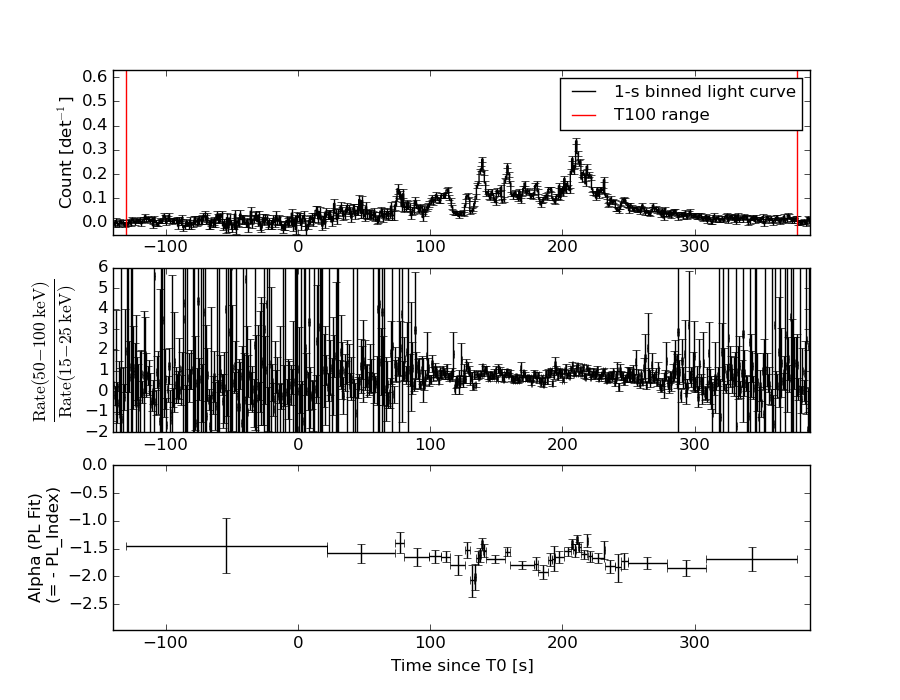
Light Curves
Note: The mask-weighted lightcurves have units of either count/det or counts/sec/det, where a det is 0.4 x 0.4 = 0.16 sq cm.
Full-time range; 1 s binning
Other quick-look light curves:
- 64 ms binning (zoomed)
- 16 ms binning (zoomed)
- 8 ms binning (zoomed)
- 2 ms binning (zoomed)
- SN=5 or 10 s binning (full-time range)
- Raw light curve
Spectra
- 64 ms binning (zoomed)
- 16 ms binning (zoomed)
- 8 ms binning (zoomed)
- 2 ms binning (zoomed)
- SN=5 or 10 s binning (full-time range)
- Raw light curve
Spectra
Notes:
- 1) The fitting includes the systematic errors.
- 2) When the burst includes telescope slew time periods, the fitting uses an average response file made from multiple 5-s response files through out the slew time plus single time preiod for the non-slew times, and weighted by the total counts in the corresponding time period using addrmf. An average response file is needed becuase a spectral fit using the pre-slew DRM will introduce some errors in both a spectral shape and a normalization if the PHA file contains a lot of the slew/post-slew time interval.
- 3) For fits to more complicated models (e.g. a power-law over a cutoff power-law), the BAT team has decided to require a chi-square improvement of more than 6 for each extra dof.
Time averaged spectrum fit using the average DRM
Power-law model
Time interval is from -130.156 sec. to  377.232 sec.

Spectral model in power-law:
------------------------------------------------------------
Parameters  : value       lower 90%   higher 90%
Photon index: -1.6719     ( -0.0447628   0.0446708 )
Norm@50keV  : 3.36028E-03    ( -7.48361e-05   7.48079e-05 )
------------------------------------------------------------
#Fit statistic : Chi-Squared =          42.14 using 59 PHA bins.
# Reduced chi-squared =         0.7393 for     57 degrees of freedom
# Null hypothesis probability =   9.293805e-01

Photon flux (15-150 keV)    in 507.4 sec: 0.442009 ( -0.011309  0.011358 ) ph/cm2/s
Energy fluence (15-150 keV)             : 1.58264e-05 ( -3.64193e-07  3.64516e-07 ) ergs/cm2
Cutoff power-law model
Time interval is from -130.156 sec. to  377.232 sec.
Spectral model in the cutoff power-law:
------------------------------------------------------------
Parameters  : value       lower 90%   higher 90%
Photon index: -1.58775     ( -0.126684   0.178412 )
Epeak [keV] : 263.330      ( -168.116 -263.345 )
Norm@50keV  : 3.67535E-03    ( -0.000372909   0.000746841 )
------------------------------------------------------------
#Fit statistic : Chi-Squared =          41.46 using 59 PHA bins.
# Reduced chi-squared =         0.7403 for     56 degrees of freedom
# Null hypothesis probability =   9.265804e-01

Photon flux (15-150 keV)    in 507.4 sec: 0.438594 ( -0.01315  0.013177 ) ph/cm2/s
Energy fluence (15-150 keV)             : 1.5717e-05 ( -4.2621e-07  4.24353e-07 ) ergs/cm2
1-s peak spectrum fit
Power-law model
Time interval is from  210.440 sec. to  211.440 sec.

Spectral model in power-law:
------------------------------------------------------------
Parameters  : value       lower 90%   higher 90%
Photon index: -1.34395     ( -0.0906578   0.0903612 )
Norm@50keV  : 2.59702E-02    ( -0.00133643   0.00133336 )
------------------------------------------------------------
#Fit statistic : Chi-Squared =          70.56 using 59 PHA bins.
# Reduced chi-squared =          1.238 for     57 degrees of freedom
# Null hypothesis probability =   1.070158e-01

Photon flux (15-150 keV)    in 1 sec: 3.12483 ( -0.16157  0.16168 ) ph/cm2/s
Energy fluence (15-150 keV)             : 2.54021e-07 ( -1.47555e-08  1.48352e-08 ) ergs/cm2
Cutoff power-law model

Time interval is from  210.440 sec. to  211.440 sec.
Spectral model in the cutoff power-law:
------------------------------------------------------------
Parameters  : value       lower 90%   higher 90%
Photon index: -1.2255     ( -0.164665   0.344064 )
Epeak [keV] : 343.668      ( -343.668 -343.668 )
Norm@50keV  : 2.96585E-02    ( -0.0048217   0.013437 )
------------------------------------------------------------
#Fit statistic : Chi-Squared =          70.17 using 59 PHA bins.
# Reduced chi-squared =          1.253 for     56 degrees of freedom
# Null hypothesis probability =   9.639663e-02

Photon flux (15-150 keV)    in 1 sec: 3.10801 ( -0.1678  0.16771 ) ph/cm2/s
Energy fluence (15-150 keV)             : 2.51971e-07 ( -1.58579e-08  1.57917e-08 ) ergs/cm2
Time-resolved spectra
Distribution
T90 vs. Hardness ratio plot
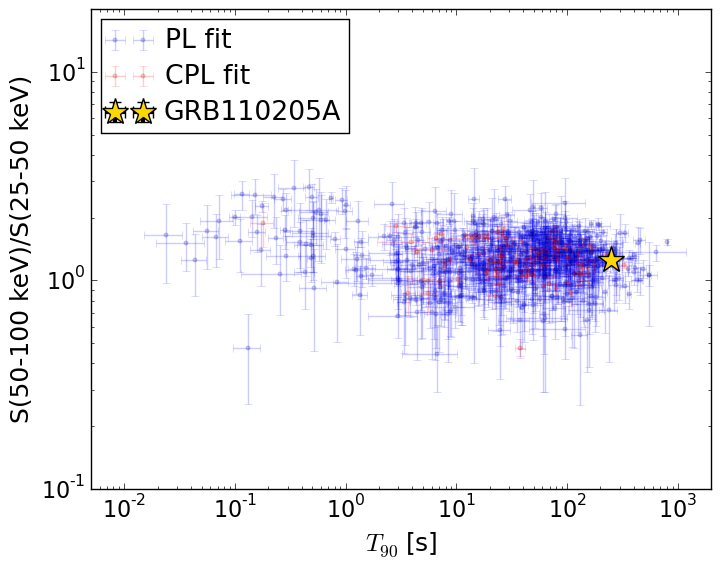
T90                                   = 249.416 sec.
Hardness ratio (energy fluence ratio) = 1.25539395205
S(15-50 keV) vs. S(50-150 keV) plot
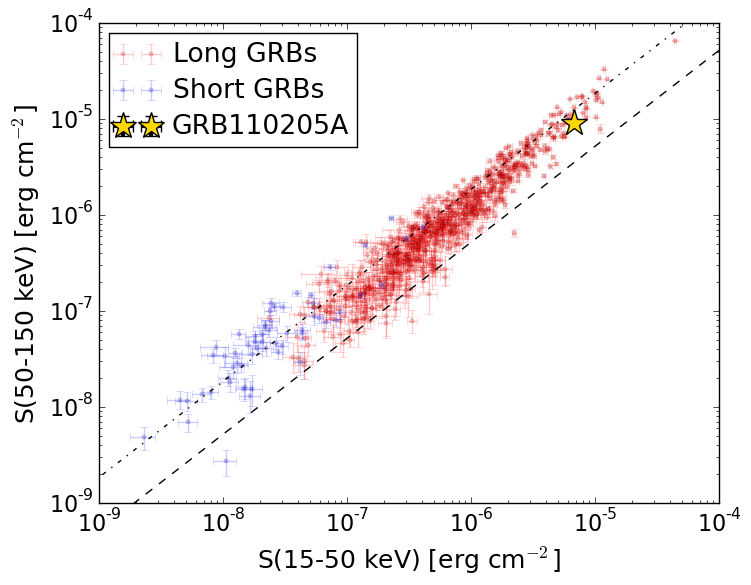
S(15-50 keV)  = 6.792859e-06
S(50-150 keV) = 9.033465e-06
The dash-dotted line and the dashed line traces the fluences calculated from the Band function with Epeak = 15 and 150 keV, respectively. Both lines assume a canonical values of alpha = -1 and beta = -2.5.
Mask shadow pattern
IMX = -8.830734206158953E-01, IMY = -3.210823008819084E-01
Spacecraft aspect plot
Bright source in the pre-burst/pre-slew/post-slew images
Pre-burst image of 15-350 keV band
Time interval of the image:
Pre-slew background subtracted image of 15-350 keV band
Time interval of the image:
-70.099400 72.100590

# RAcent  DECcent POSerr Theta    Phi  PeakCts   SNR AngSep     Name
#  [deg]    [deg]    ['] [deg]  [deg]                   [']
164.6040  67.5319    1.2  43.2  160.0   2.7606   9.9 ------	UNKNOWN
224.4769  68.4620    2.1  44.2 -168.6   1.0187   5.4 ------	UNKNOWN
208.9218 -17.0861    2.9  47.4  -23.8   0.9375   4.0 ------	UNKNOWN
227.6408  -5.8971    3.1  47.0  -53.1   2.0315   3.7 ------	UNKNOWN
Post-slew image of 15-350 keV band
Time interval of the image:
144.100620 963.064900

# RAcent  DECcent POSerr Theta    Phi  PeakCts   SNR AngSep     Name
#  [deg]    [deg]    ['] [deg]  [deg]                   [']
100.3056  64.2813    3.7  25.3  172.2   1.3325   3.1 ------	UNKNOWN
164.6177  67.5279    0.2   0.0 -158.5  19.4882  48.2 ------	UNKNOWN
227.7389  25.3580    3.0  56.5  -16.6   6.3797   3.8 ------	UNKNOWN