Analysis Summary
Notes:
- 1) No attempt has been made to eliminate the non-significant decimal places.
- 2) This batgrbproduct analysis is done using the HEASARC data.
- 3) This batgrbproduct analysis is using the flight position for the mask-weighting calculation.
======================================================================
                  BAT GRB EVENT DATA PROCESSING REPORT
    Process Script Ver: batgrbproduct v2.46
    Process Start Time: Tue Jan 14 00:17:05 EST 2014
             Host Name: batevent1
   Current Working Dir: /local/data/batevent/batevent_reproc/trigger445141
======================================================================

  Trigger: 00445141      Segment: 000

  BAT Trigger Time: 319024368   [s; MET]
      Trigger Stop: 319024432   [s; MET]
               UTC: 2011-02-10T09:52:41.350180    [includes UTCF correction]
       Where From?: TDRSS position message

  BAT
    RA: 13.0773027882465   Dec: 7.79171040387002  [deg; J2000]

     Catalogged Source?: NO
     Point Source?:      YES
     GRB Indicated?:     YES    [ by BAT flight software ]
     Image S/N Ratio:    7.13
     Image Trigger?:     YES
     Rate S/N Ratio:     0  [ if not an image trigger ]
     Image S/N Ratio:    7.13

  Analysis Position:   [ source = BAT ]
    RA: 13.0773027882465   Dec: 7.79171040387002  [deg; J2000]

  Refined Position:   [ source = BAT pre-slew burst ]
    RA: 13.0773   Dec: 7.79171  [deg; J2000]
        { 00h 52m 18.6s , +07d 47' 30.2" }
        +/- 3.16435253472 [arcmin] (estimated 90% radius based on SNR)
    SNR: 5.86789776223


  Angular difference between the analysis and refined position is 0.000168 arcmin

  Partial Coding Fraction: 0.8359375    [ including projection effects ]

  Duration
     T90: 192.887999951839 +/- 42.1038400896004
        Measured from: -101.832000017166
                   to: 91.0559999346733     [s; relative to TRIGTIME]
     T50: 101.911999940872 +/- 38.3892937705216
        Measured from: -66.9959999918938
                   to: 34.9159999489784     [s; relative to TRIGTIME]


  Fluence
     Peak Flux  (peak 1 second)
        Measured from: -54.3479999899864
                   to: -53.3479999899864     [s; relative to TRIGTIME]
     Total Fluence
        Measured from: -107.255999982357
                   to: 103.67199999094     [s; relative to TRIGTIME]

             Band 1     Band 2     Band 3     Band 4
              15-25      25-50     50-100    100-350     keV
 Total     0.483525   0.557015   0.387546   0.059963
           0.078082   0.082262   0.077614   0.080512 [error]
 Peak      0.017906   0.012840   0.010473   0.007439
           0.005419   0.005868   0.005384   0.005723 [error]

     [ fluence units of on-axis counts / fully illuminated detector ]

======================================================================


====== Table of the duration information =============================

        Value   tstart    tstop
T100  210.928 -107.256  103.672
T90   192.888 -101.832   91.056
T50   101.912  -66.996   34.916
Peak    1.000  -54.348  -53.348


====== Spectral Analysis Summary =====================================

Model      : spectral model: simple power-law (PL) and cutoff power-law (CPL)
Ph_index   : photon index: E^{Ph_index}
Ph_90err   : 90% error of the photon index
Epeak      : Epeak in keV
Epeak_90err: 90% error of Epeak
Norm       : normalization at 50 keV in both the PL model and CPL model
Nomr_90err : 90% error of the normalization
chi2       : Chi-Squared
dof        : degree of freedo

=== Time-averaged spectral analysis ===
(Best model with acceptable fit: PL)

Model Ph_index Ph_90err_low Ph_90err_hi  Epeak  Epeak_90err_low  Epeak_90err_hi  Norm       Nomr_90err_low    Norm_90err_hi    chi2    dof
PL      -1.773    -0.309      0.290       -           -               -         4.53e-04     -8.74e-05          8.41e-05      45.910   57
CPL     -1.728    -1.042      1.248      253.134    -253.124      -253.134      4.80e-04     -4.80e-04          1.97e-03      45.900   56


=== 1-s peak spectral analysis ===
(Best model with acceptable fit: N/A)

Model Ph_index Ph_90err_low Ph_90err_hi  Epeak  Epeak_90err_low  Epeak_90err_hi  Norm       Nomr_90err_low    Norm_90err_hi    chi2    dof
PL      -2.058     -0.996     0.742       -           -               -         2.22e-03     -1.32e-03          1.25e-03      63.450   57
CPL     -1.407     -0.709     7.553       34.658      N/A           N/A         5.60e-03        N/A               N/A         63.320   56


=== Fluence/Peak Flux Summary ===

              Model    Band1     Band2     Band3     Band4     Band5     Total
                       15-25     25-50    50-100    100-350    15-150    15-350    keV
Fluence         PL   1.58e-07  2.45e-07  2.87e-07  6.49e-07  8.80e-07  1.34e-06   erg/cm2
      90%_error_low -3.54e-08 -3.79e-08 -7.46e-08 -2.87e-07 -1.70e-07 -3.73e-07   erg/cm2
      90%_error_hi   3.67e-08  3.79e-08  7.62e-08  4.12e-07  1.77e-07  4.77e-07   erg/cm2
Peak flux       PL   1.57e-01  1.14e-01  5.45e-02  3.70e-02  3.42e-01  3.62e-01   ph/cm2/s
      90%_error_low -7.83e-02 -4.92e-02 -3.75e-02 -3.70e-02 -1.37e-01 -1.49e-01   ph/cm2/s
      90%_error_hi   8.30e-02  4.69e-02  4.37e-02  8.06e-02  1.38e-01  1.54e-01   ph/cm2/s

Fluence        CPL   1.57e-07  2.47e-07  2.87e-07  5.94e-07  8.75e-07  1.28e-06   erg/cm2
      90%_error_low -3.91e-08 -3.92e-08 -7.91e-08 -5.13e-07 -2.02e-07 -5.78e-07   erg/cm2
      90%_error_hi   3.79e-08  5.17e-08  7.65e-08  2.88e-07  1.79e-07  3.78e-07   erg/cm2
Peak flux      CPL   1.51e-01  1.23e-01  5.17e-02  1.36e-02  3.36e-01  3.40e-01   ph/cm2/s
      90%_error_low -8.70e-02     N/A       N/A   -1.36e-02 -1.35e-01 -1.40e-01   ph/cm2/s
      90%_error_hi   8.65e-02     N/A       N/A    5.42e-02  1.40e-01  1.75e-01   ph/cm2/s

======================================================================
Image
Pre-slew 15.0-50.0 keV image (Event data)
#RAcent DECcent POSerr Theta  Phi  Peak_Cts  SNR Name
13.077 7.792 0.000 29.776 -7.890 0.383 5.868 TRIG_00445141

Image time interval: 0.000 to 64.000 [sec]
Light Curves
Note: The mask-weighted lightcurves have units of either count/det or counts/sec/det, where a det is 0.4 x 0.4 = 0.16 sq cm.
Full-time range; 1 s binning
Other quick-look light curves:
- 64 ms binning (zoomed)
- 16 ms binning (zoomed)
- 8 ms binning (zoomed)
- 2 ms binning (zoomed)
- SN=5 or 10 s binning (full-time range)
- Raw light curve
Spectra
- 64 ms binning (zoomed)
- 16 ms binning (zoomed)
- 8 ms binning (zoomed)
- 2 ms binning (zoomed)
- SN=5 or 10 s binning (full-time range)
- Raw light curve
Spectra
Notes:
- 1) The fitting includes the systematic errors.
- 2) When the burst includes telescope slew time periods, the fitting uses an average response file made from multiple 5-s response files through out the slew time plus single time preiod for the non-slew times, and weighted by the total counts in the corresponding time period using addrmf. An average response file is needed becuase a spectral fit using the pre-slew DRM will introduce some errors in both a spectral shape and a normalization if the PHA file contains a lot of the slew/post-slew time interval.
- 3) For fits to more complicated models (e.g. a power-law over a cutoff power-law), the BAT team has decided to require a chi-square improvement of more than 6 for each extra dof.
Time averaged spectrum fit using the average DRM
Power-law model
Time interval is from -107.256 sec. to  103.672 sec.

Spectral model in power-law:
------------------------------------------------------------
Parameters  : value       lower 90%   higher 90%
Photon index: -1.77314     ( -0.309485   0.289678 )
Norm@50keV  : 4.52730E-04    ( -8.73561e-05   8.41298e-05 )
------------------------------------------------------------
#Fit statistic : Chi-Squared =          45.91 using 59 PHA bins.
# Reduced chi-squared =         0.8054 for     57 degrees of freedom
# Null hypothesis probability =   8.534873e-01

Photon flux (15-150 keV)    in 210.9 sec: 6.17507E-02 ( -0.0095285  0.0095286 ) ph/cm2/s
Energy fluence (15-150 keV)             : 8.80109e-07 ( -1.70128e-07  1.76506e-07 ) ergs/cm2
Cutoff power-law model
Time interval is from -107.256 sec. to  103.672 sec.
Spectral model in the cutoff power-law:
------------------------------------------------------------
Parameters  : value       lower 90%   higher 90%
Photon index: -1.72849     ( -1.04104   1.24958 )
Epeak [keV] : 253.134      ( -272.223 -272.233 )
Norm@50keV  : 4.80007E-04    ( -0.000478775   0.00196876 )
------------------------------------------------------------
#Fit statistic : Chi-Squared =          45.90 using 59 PHA bins.
# Reduced chi-squared =         0.8197 for     56 degrees of freedom
# Null hypothesis probability =   8.299966e-01

Photon flux (15-150 keV)    in 210.9 sec: 6.16358E-02 ( -0.0099386  0.0096297 ) ph/cm2/s
Energy fluence (15-150 keV)             : 8.754e-07 ( -2.02227e-07  1.79076e-07 ) ergs/cm2
1-s peak spectrum fit
Power-law model
Time interval is from  -54.348 sec. to  -53.348 sec.

Spectral model in power-law:
------------------------------------------------------------
Parameters  : value       lower 90%   higher 90%
Photon index: -2.05822     ( -0.995828   0.74197 )
Norm@50keV  : 2.21954E-03    ( -0.00131735   0.00124895 )
------------------------------------------------------------
#Fit statistic : Chi-Squared =          63.45 using 59 PHA bins.
# Reduced chi-squared =          1.113 for     57 degrees of freedom
# Null hypothesis probability =   2.596159e-01

Photon flux (15-150 keV)    in 1 sec: 0.342191 ( -0.137289  0.137553 ) ph/cm2/s
Energy fluence (15-150 keV)             : 2.05504e-08 ( -1.02299e-08  1.17018e-08 ) ergs/cm2
Cutoff power-law model
Time interval is from  -54.348 sec. to  -53.348 sec.
Spectral model in the cutoff power-law:
------------------------------------------------------------
Parameters  : value       lower 90%   higher 90%
Photon index: -1.40679     ( -0.709258   7.55291 )
Epeak [keV] : 34.6583      (   )
Norm@50keV  : 5.60067E-03    (     )
------------------------------------------------------------
#Fit statistic : Chi-Squared =          63.32 using 59 PHA bins.
# Reduced chi-squared =          1.131 for     56 degrees of freedom
# Null hypothesis probability =   2.340206e-01

Photon flux (15-150 keV)    in 1 sec: 0.336075 ( -0.13503  0.140187 ) ph/cm2/s
Energy fluence (15-150 keV)             : 1.90064e-08 ( -9.84166e-09  1.23272e-08 ) ergs/cm2
Time-resolved spectra

Distribution
T90 vs. Hardness ratio plot
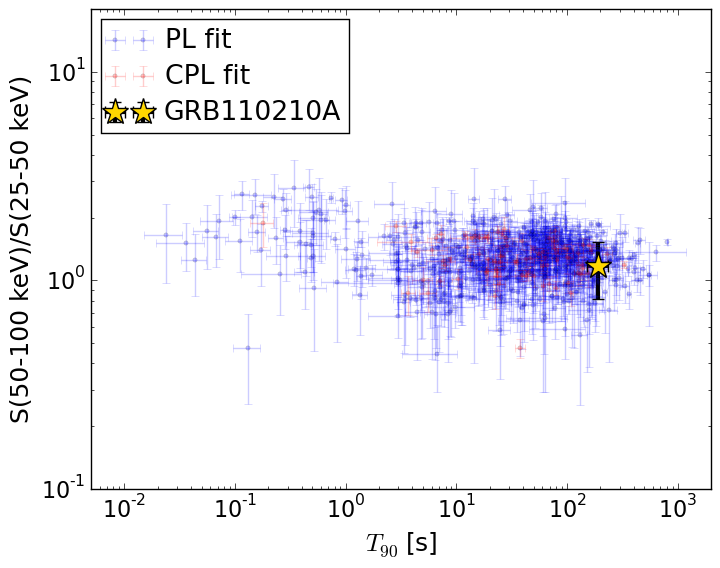
T90                                   = 192.888 sec.
Hardness ratio (energy fluence ratio) = 1.17030702977
S(15-50 keV) vs. S(50-150 keV) plot
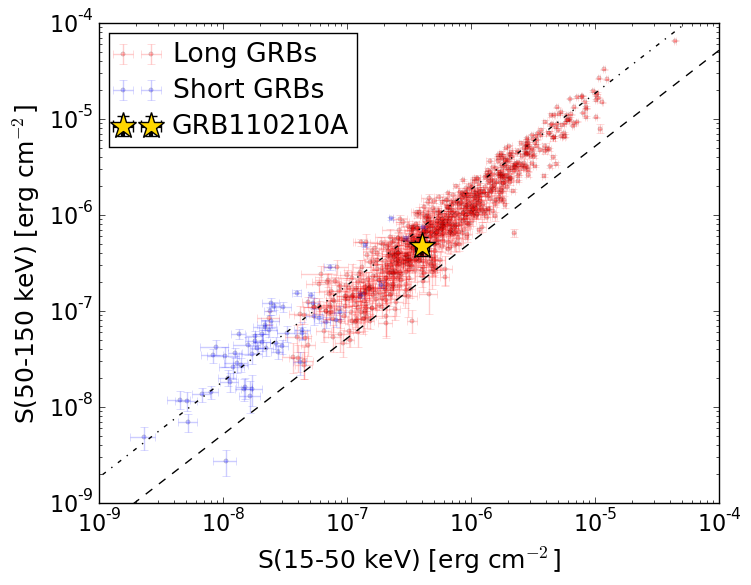
S(15-50 keV)  = 4.029453e-07
S(50-150 keV) = 4.771668e-07
The dash-dotted line and the dashed line traces the fluences calculated from the Band function with Epeak = 15 and 150 keV, respectively. Both lines assume a canonical values of alpha = -1 and beta = -2.5.
Mask shadow pattern

IMX = 0.56673621053, IMY = 0.0785388118557
Spacecraft aspect plot
Bright source in the pre-burst/pre-slew/post-slew images
Pre-burst image of 15-350 keV band
Time interval of the image:
-239.000000 -107.256000

# RAcent  DECcent POSerr Theta    Phi  PeakCts   SNR AngSep     Name
#  [deg]    [deg]    ['] [deg]  [deg]                   [']
 64.3574 -32.2537    2.7  39.1  127.3   1.4686   4.3 ------	UNKNOWN
340.4508  -8.5047    3.2  42.2  -68.7   1.8578   3.6 ------	UNKNOWN
Pre-slew background subtracted image of 15-350 keV band
Time interval of the image:
-107.256000 72.500590

# RAcent  DECcent POSerr Theta    Phi  PeakCts   SNR AngSep     Name
#  [deg]    [deg]    ['] [deg]  [deg]                   [']
 13.1107   7.7701    1.8  29.7   -7.8   1.3288   6.3 ------	UNKNOWN
347.5114 -58.4102    2.9  45.5 -144.1   1.8534   4.0 ------	UNKNOWN
Post-slew image of 15-350 keV band
Time interval of the image:
125.700590 963.028200

# RAcent  DECcent POSerr Theta    Phi  PeakCts   SNR AngSep     Name
#  [deg]    [deg]    ['] [deg]  [deg]                   [']
326.1381  38.2733    3.8  52.0  -22.2   3.1850   3.0    3.3	Cyg X-2
 11.1861 -19.2905    2.3  27.1 -151.7   2.0512   5.0 ------	UNKNOWN