Analysis Summary
Notes:
- 1) No attempt has been made to eliminate the non-significant decimal places.
- 2) This batgrbproduct analysis is done using the HEASARC data.
- 3) This batgrbproduct analysis is using the flight position for the mask-weighting calculation.
======================================================================
BAT GRB EVENT DATA PROCESSING REPORT
Process Script Ver: batgrbproduct v2.46
Process Start Time: Tue Jan 14 00:13:16 EST 2014
Host Name: batevent1
Current Working Dir: /local/data/batevent/batevent_reproc/trigger445321
======================================================================
Trigger: 00445321 Segment: 000
BAT Trigger Time: 319165755.392 [s; MET]
Trigger Stop: 319165756.416 [s; MET]
UTC: 2011-02-12T01:09:08.736900 [includes UTCF correction]
Where From?: TDRSS position message
BAT
RA: 69.05298334334 Dec: 43.7024727760153 [deg; J2000]
Catalogged Source?: NO
Point Source?: YES
GRB Indicated?: YES [ by BAT flight software ]
Image S/N Ratio: 10.65
Image Trigger?: NO
Rate S/N Ratio: 21.51743479135 [ if not an image trigger ]
Image S/N Ratio: 10.65
Analysis Position: [ source = BAT ]
RA: 69.05298334334 Dec: 43.7024727760153 [deg; J2000]
Refined Position: [ source = BAT pre-slew burst ]
RA: 69.0243350559923 Dec: 43.7153313494056 [deg; J2000]
{ 04h 36m 05.8s , +43d 42' 55.2" }
+/- 1.42391928048895 [arcmin] (estimated 90% radius based on SNR)
+/- 0.590810873400363 [arcmin] (formal 1-sigma fit error)
SNR: 18.3591920483152
Angular difference between the analysis and refined position is 1.462564 arcmin
Partial Coding Fraction: 0.71875 [ including projection effects ]
Duration
T90: 3.69999998807907 +/- 0.499295502260052
Measured from: -1.34400004148483
to: 2.35599994659424 [s; relative to TRIGTIME]
T50: 1.86799997091293 +/- 0.425619563991435
Measured from: 0.0079999566078186
to: 1.87599992752075 [s; relative to TRIGTIME]
Fluence
Peak Flux (peak 1 second)
Measured from: 0.255999982357025
to: 1.25599998235703 [s; relative to TRIGTIME]
Total Fluence
Measured from: -1.76399999856949
to: 2.58799999952316 [s; relative to TRIGTIME]
Band 1 Band 2 Band 3 Band 4
15-25 25-50 50-100 100-350 keV
Total 0.159246 0.200452 0.090642 0.020854
0.013251 0.013957 0.012055 0.009572 [error]
Peak 0.049457 0.077979 0.033032 0.005341
0.006575 0.007012 0.006000 0.004746 [error]
[ fluence units of on-axis counts / fully illuminated detector ]
======================================================================
====== Table of the duration information =============================
Value tstart tstop
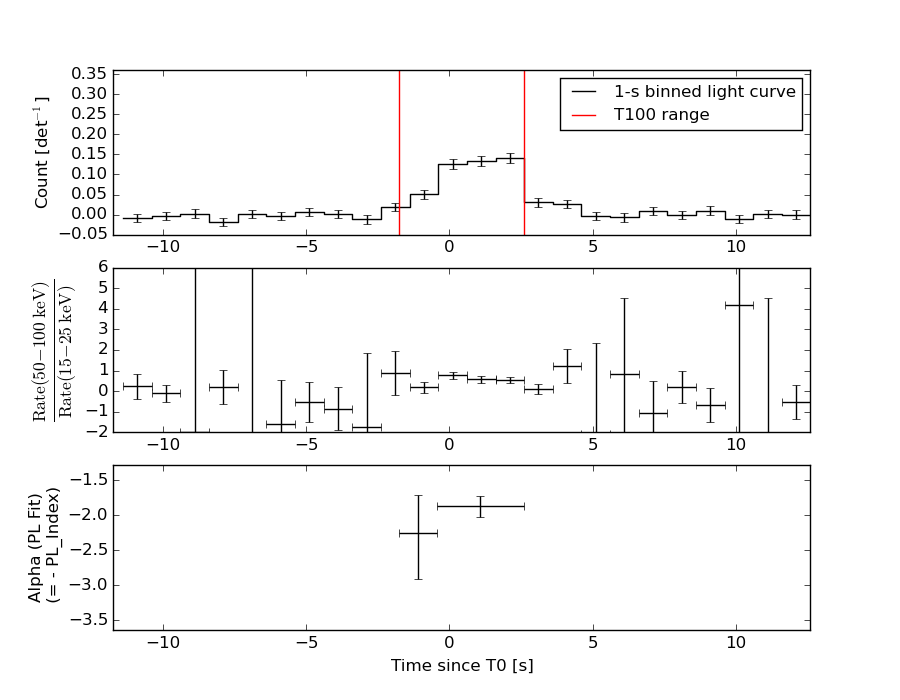
T100 4.352 -1.764 2.588
T90 3.700 -1.344 2.356
T50 1.868 0.008 1.876
Peak 1.000 0.256 1.256
====== Spectral Analysis Summary =====================================
Model : spectral model: simple power-law (PL) and cutoff power-law (CPL)
Ph_index : photon index: E^{Ph_index}
Ph_90err : 90% error of the photon index
Epeak : Epeak in keV
Epeak_90err: 90% error of Epeak
Norm : normalization at 50 keV in both the PL model and CPL model
Nomr_90err : 90% error of the normalization
chi2 : Chi-Squared
dof : degree of freedo
=== Time-averaged spectral analysis ===
(Best model with acceptable fit: CPL)
Model Ph_index Ph_90err_low Ph_90err_hi Epeak Epeak_90err_low Epeak_90err_hi Norm Nomr_90err_low Norm_90err_hi chi2 dof
PL -1.942 -0.157 0.151 - - - 6.60e-03 -6.88e-04 6.78e-04 46.790 57
CPL -0.790 -0.760 0.933 44.177 -7.416 12.187 3.01e-02 -1.89e-02 7.38e-02 39.510 56
=== 1-s peak spectral analysis ===
(Best model with acceptable fit: PL)
Model Ph_index Ph_90err_low Ph_90err_hi Epeak Epeak_90err_low Epeak_90err_hi Norm Nomr_90err_low Norm_90err_hi chi2 dof
PL -1.809 -0.207 0.197 - - - 1.06e-02 -1.44e-03 1.42e-03 57.400 57
CPL -0.198 -1.160 1.563 48.612 -7.882 19.851 8.43e-02 -8.43e-02 5.51e-01 51.320 56
=== Fluence/Peak Flux Summary ===
Model Band1 Band2 Band3 Band4 Band5 Total
15-25 25-50 50-100 100-350 15-150 15-350 keV
Fluence PL 5.57e-08 7.82e-08 8.14e-08 1.56e-07 2.64e-07 3.71e-07 erg/cm2
90%_error_low -6.77e-09 -6.72e-09 -1.13e-08 -3.91e-08 -2.65e-08 -5.25e-08 erg/cm2
90%_error_hi 6.93e-09 6.73e-09 1.15e-08 4.68e-08 2.69e-08 5.82e-08 erg/cm2
Peak flux PL 5.89e-01 4.94e-01 2.82e-01 2.39e-01 1.47e+00 1.60e+00 ph/cm2/s
90%_error_low -1.01e-01 -5.87e-02 -4.87e-02 -7.11e-02 -1.75e-01 -1.91e-01 ph/cm2/s
90%_error_hi 1.05e-01 5.87e-02 4.88e-02 8.66e-02 1.75e-01 1.92e-01 ph/cm2/s
Fluence CPL 5.00e-08 8.92e-08 7.76e-08 3.04e-08 2.39e-07 2.47e-07 erg/cm2
90%_error_low -7.94e-09 -9.71e-09 -1.48e-08 -1.96e-08 -2.88e-08 -3.50e-08 erg/cm2
90%_error_hi 7.94e-09 1.00e-08 1.38e-08 5.13e-08 3.07e-08 5.73e-08 erg/cm2
Peak flux CPL 4.87e-01 5.84e-01 2.84e-01 4.65e-02 1.39e+00 1.40e+00 ph/cm2/s
90%_error_low -1.27e-01 -8.64e-02 -6.42e-02 -4.65e-02 -1.84e-01 -1.89e-01 ph/cm2/s
90%_error_hi 1.28e-01 9.05e-02 5.99e-02 9.55e-02 1.84e-01 1.97e-01 ph/cm2/s
======================================================================
Image
Pre-slew 15.0-350.0 keV image (Event data)
#   RAcent    DECcent   POSerr    Theta     Phi              Peak Cts       SNR   Name
   69.0243    43.7153   0.0105    33.3720  -155.1575         0.4870249     18.359 TRIG_00445321

Foreground time interval of the image:
 -1.764   2.588 (delta_t =   4.352 [sec])
Background time interval of the image:
-239.392  -1.764 (delta_t = 237.628 [sec])
Light Curves
Note: The mask-weighted lightcurves have units of either count/det or counts/sec/det, where a det is 0.4 x 0.4 = 0.16 sq cm.
Full-time range; 1 s binning
Other quick-look light curves:
- 64 ms binning (zoomed)
- 16 ms binning (zoomed)
- 8 ms binning (zoomed)
- 2 ms binning (zoomed)
- SN=5 or 10 s binning (full-time range)
- Raw light curve
Spectra
- 64 ms binning (zoomed)
- 16 ms binning (zoomed)
- 8 ms binning (zoomed)
- 2 ms binning (zoomed)
- SN=5 or 10 s binning (full-time range)
- Raw light curve
Spectra
Notes:
- 1) The fitting includes the systematic errors.
- 2) When the burst includes telescope slew time periods, the fitting uses an average response file made from multiple 5-s response files through out the slew time plus single time preiod for the non-slew times, and weighted by the total counts in the corresponding time period using addrmf. An average response file is needed becuase a spectral fit using the pre-slew DRM will introduce some errors in both a spectral shape and a normalization if the PHA file contains a lot of the slew/post-slew time interval.
- 3) For fits to more complicated models (e.g. a power-law over a cutoff power-law), the BAT team has decided to require a chi-square improvement of more than 6 for each extra dof.
Time averaged spectrum fit using the average DRM
Power-law model
Time interval is from   -1.764 sec. to    2.588 sec.

Spectral model in power-law:
------------------------------------------------------------
Parameters  : value       lower 90%   higher 90%
Photon index: -1.94206     ( -0.15735   0.151049 )
Norm@50keV  : 6.60436E-03    ( -0.000688309   0.000677632 )
------------------------------------------------------------
#Fit statistic : Chi-Squared =          46.79 using 59 PHA bins.
# Reduced chi-squared =         0.8208 for     57 degrees of freedom
# Null hypothesis probability =   8.307482e-01

Photon flux (15-150 keV)    in 4.352 sec: 0.965237 ( -0.08355  0.083583 ) ph/cm2/s
Energy fluence (15-150 keV)             : 2.64496e-07 ( -2.65112e-08  2.69037e-08 ) ergs/cm2
Cutoff power-law model
Time interval is from   -1.764 sec. to    2.588 sec.
Spectral model in the cutoff power-law:
------------------------------------------------------------
Parameters  : value       lower 90%   higher 90%
Photon index: -0.790421     ( -0.760297   0.932866 )
Epeak [keV] : 44.1774      ( -7.41602 12.1875 )
Norm@50keV  : 3.00939E-02    ( -0.0188746   0.0738189 )
------------------------------------------------------------
#Fit statistic : Chi-Squared =          39.51 using 59 PHA bins.
# Reduced chi-squared =         0.7056 for     56 degrees of freedom
# Null hypothesis probability =   9.534661e-01

Photon flux (15-150 keV)    in 4.352 sec: 0.926616 ( -0.087143  0.087184 ) ph/cm2/s
Energy fluence (15-150 keV)             : 2.38962e-07 ( -2.88367e-08  3.06682e-08 ) ergs/cm2
1-s peak spectrum fit
Power-law model
Time interval is from    0.256 sec. to    1.256 sec.

Spectral model in power-law:
------------------------------------------------------------
Parameters  : value       lower 90%   higher 90%
Photon index: -1.80949     ( -0.206624   0.1971 )
Norm@50keV  : 1.06269E-02    ( -0.00144085   0.00141541 )
------------------------------------------------------------
#Fit statistic : Chi-Squared =          57.40 using 59 PHA bins.
# Reduced chi-squared =          1.007 for     57 degrees of freedom
# Null hypothesis probability =   4.601285e-01

Photon flux (15-150 keV)    in 1 sec: 1.46987 ( -0.17498  0.17507 ) ph/cm2/s
Energy fluence (15-150 keV)             : 9.7816e-08 ( -1.33231e-08  1.35186e-08 ) ergs/cm2
Cutoff power-law model
Time interval is from    0.256 sec. to    1.256 sec.
Spectral model in the cutoff power-law:
------------------------------------------------------------
Parameters  : value       lower 90%   higher 90%
Photon index: -0.197659     ( -1.16081   1.5621 )
Epeak [keV] : 48.6118      ( -7.87497 19.8587 )
Norm@50keV  : 8.42748E-02    ( -0.0844755   0.550459 )
------------------------------------------------------------
#Fit statistic : Chi-Squared =          51.32 using 59 PHA bins.
# Reduced chi-squared =         0.9165 for     56 degrees of freedom
# Null hypothesis probability =   6.522154e-01

Photon flux (15-150 keV)    in 1 sec: 1.39435 ( -0.18424  0.18383 ) ph/cm2/s
Energy fluence (15-150 keV)             : 8.63853e-08 ( -1.388e-08  1.53121e-08 ) ergs/cm2
Time-resolved spectra
Distribution
T90 vs. Hardness ratio plot
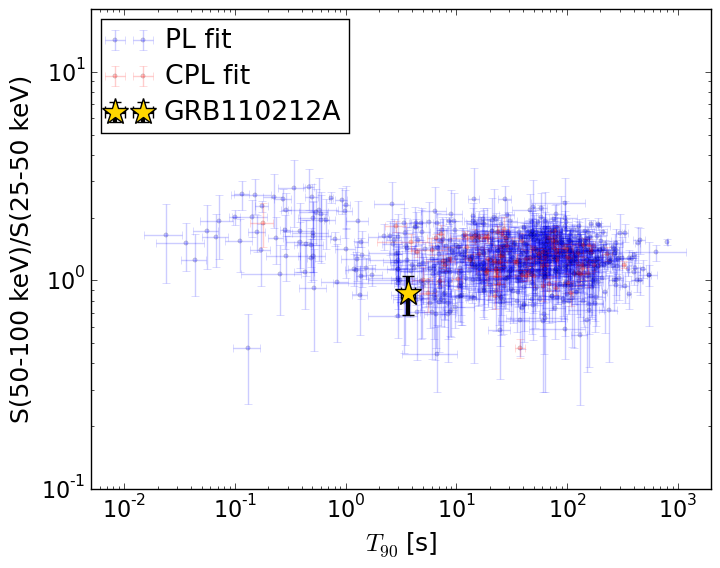
T90                                   = 3.7 sec.
Hardness ratio (energy fluence ratio) = 0.870402376873
S(15-50 keV) vs. S(50-150 keV) plot
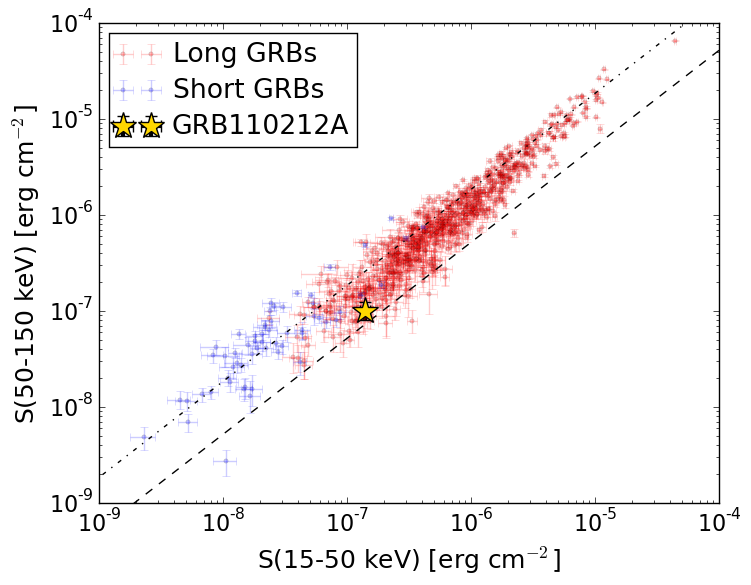
S(15-50 keV)  = 1.391888e-07
S(50-150 keV) = 9.977375e-08
The dash-dotted line and the dashed line traces the fluences calculated from the Band function with Epeak = 15 and 150 keV, respectively. Both lines assume a canonical values of alpha = -1 and beta = -2.5.
Mask shadow pattern
IMX = -5.977284130399158E-01, IMY = 2.767280725799086E-01
Spacecraft aspect plot
Bright source in the pre-burst/pre-slew/post-slew images
Pre-burst image of 15-350 keV band
Time interval of the image:
-239.392000 -1.764000

# RAcent  DECcent POSerr Theta    Phi  PeakCts   SNR AngSep     Name
#  [deg]    [deg]    ['] [deg]  [deg]                   [']
 83.6432  22.0026    0.5  43.9  168.1   9.4266  24.6    0.9	Crab
142.6923  22.6297    2.3  39.5   81.9   3.4501   5.0 ------	UNKNOWN
202.1004  41.6524    2.2  52.6    7.7   2.9440   5.2 ------	UNKNOWN
158.5332  53.7991    2.2  22.5   22.0   0.8325   5.3 ------	UNKNOWN
265.8150  70.8018    2.5  49.0  -48.0   4.1061   4.7 ------	UNKNOWN
Pre-slew background subtracted image of 15-350 keV band
Time interval of the image:
-1.764000 2.588000

# RAcent  DECcent POSerr Theta    Phi  PeakCts   SNR AngSep     Name
#  [deg]    [deg]    ['] [deg]  [deg]                   [']
 83.4264  21.9655    0.0  44.1  168.4  -0.0862  -2.1   11.9	Crab
 74.9994  26.9521    2.3  43.4 -178.4   0.1733   5.0 ------	UNKNOWN
 69.0244  43.7153    0.6  33.4 -155.2   0.4870  18.4 ------	UNKNOWN
Post-slew image of 15-350 keV band
Time interval of the image:
674.808620 962.705100

# RAcent  DECcent POSerr Theta    Phi  PeakCts   SNR AngSep     Name
#  [deg]    [deg]    ['] [deg]  [deg]                   [']
187.7006 -21.6691    2.7  52.7   26.1   3.6943   4.4 ------	UNKNOWN
166.5391  50.9743    2.7  25.7  172.4   0.7705   4.2 ------	UNKNOWN
209.2002 -16.7968    1.7  51.8   -0.4   2.9416   7.0 ------	UNKNOWN
181.2971  43.6406    2.9  13.8 -176.9   0.6847   4.0 ------	UNKNOWN
200.2579  40.7856    2.0  13.7 -113.8   1.0295   5.7 ------	UNKNOWN
231.0718  -7.8214    2.8  56.3  -28.6   4.0112   4.1 ------	UNKNOWN
237.1265  32.5377    2.7  41.1  -80.2   3.5576   4.3 ------	UNKNOWN