Analysis Summary
Notes:
- 1) No attempt has been made to eliminate the non-significant decimal places.
- 2) This batgrbproduct analysis is done using the HEASARC data.
- 3) This batgrbproduct analysis is using the flight position for the mask-weighting calculation.
======================================================================
BAT GRB EVENT DATA PROCESSING REPORT
Process Script Ver: batgrbproduct v2.46
Process Start Time: Sun Jun 14 02:42:48 EDT 2015
Host Name: bat1
Current Working Dir: /local/data/bat1/alien/Swift_3rdBATcatalog/event/batevent_reproc/trigger446674
======================================================================
Trigger: 00446674 Segment: 000
BAT Trigger Time: 320187425.92 [s; MET]
Trigger Stop: 320187427.968 [s; MET]
UTC: 2011-02-23T20:56:59.226720 [includes UTCF correction]
Where From?: TDRSS position message
BAT
RA: 345.599224203527 Dec: 87.5675078814022 [deg; J2000]
Catalogged Source?: NO
Point Source?: YES
GRB Indicated?: YES [ by BAT flight software ]
Image S/N Ratio: 7.37
Image Trigger?: NO
Rate S/N Ratio: 9.89949493661167 [ if not an image trigger ]
Image S/N Ratio: 7.37
Analysis Position: [ source = BAT ]
RA: 345.599224203527 Dec: 87.5675078814022 [deg; J2000]
Refined Position: [ source = BAT pre-slew burst ]
RA: 345.477174596784 Dec: 87.588203667138 [deg; J2000]
{ 23h 01m 54.5s , +87d 35' 17.5" }
+/- 2.50700517246376 [arcmin] (estimated 90% radius based on SNR)
+/- 1.73983045137516 [arcmin] (formal 1-sigma fit error)
SNR: 8.18269988308016
Angular difference between the analysis and refined position is 1.279732 arcmin
Partial Coding Fraction: 0.6015625 [ including projection effects ]
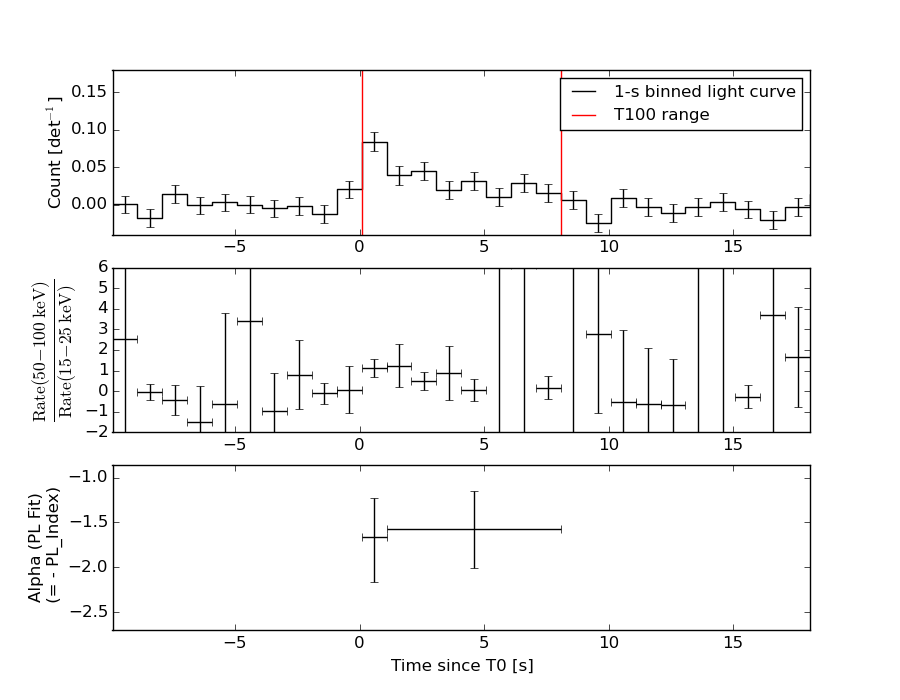
Duration
T90: 7 +/- 2.23606797749979
Measured from: 0.0799999833106995
to: 7.0799999833107 [s; relative to TRIGTIME]
T50: 4 +/- 2
Measured from: 0.0799999833106995
to: 4.0799999833107 [s; relative to TRIGTIME]
Fluence
Peak Flux (peak 1 second)
Measured from: 0.0799999833106995
to: 1.0799999833107 [s; relative to TRIGTIME]
Total Fluence
Measured from: 0.0799999833106995
to: 8.0799999833107 [s; relative to TRIGTIME]
Band 1 Band 2 Band 3 Band 4
15-25 25-50 50-100 100-350 keV
Total 0.077786 0.118965 0.070202 0.007867
0.017963 0.018682 0.016882 0.015137 [error]
Peak 0.023225 0.029818 0.026211 0.004813
0.006644 0.006775 0.006307 0.005627 [error]
[ fluence units of on-axis counts / fully illuminated detector ]
======================================================================
====== Table of the duration information =============================
Value tstart tstop
T100 8.000 0.080 8.080
T90 7.000 0.080 7.080
T50 4.000 0.080 4.080
Peak 1.000 0.080 1.080
====== Spectral Analysis Summary =====================================
Model : spectral model: simple power-law (PL) and cutoff power-law (CPL)
Ph_index : photon index: E^{Ph_index}
Ph_90err : 90% error of the photon index
Epeak : Epeak in keV
Epeak_90err: 90% error of Epeak
Norm : normalization at 50 keV in both the PL model and CPL model
Nomr_90err : 90% error of the normalization
chi2 : Chi-Squared
dof : degree of freedo
=== Time-averaged spectral analysis ===
(Best model with acceptable fit: PL)
Model Ph_index Ph_90err_low Ph_90err_hi Epeak Epeak_90err_low Epeak_90err_hi Norm Nomr_90err_low Norm_90err_hi chi2 dof
PL -1.583 -0.335 0.322 - - - 2.22e-03 -4.73e-04 4.63e-04 40.020 57
CPL -0.671 -1.306 1.709 65.158 -21.347 -65.158 7.09e-03 -7.09e-03 5.63e-02 38.500 56
=== 1-s peak spectral analysis ===
(Best model with acceptable fit: PL)
Model Ph_index Ph_90err_low Ph_90err_hi Epeak Epeak_90err_low Epeak_90err_hi Norm Nomr_90err_low Norm_90err_hi chi2 dof
PL -1.664 -0.492 0.441 - - - 4.73e-03 -1.42e-03 1.36e-03 52.800 57
CPL -0.820 -1.425 2.370 68.920 N/A N/A 1.28e-02 N/A N/A 52.030 56
=== Fluence/Peak Flux Summary ===
Model Band1 Band2 Band3 Band4 Band5 Total
15-25 25-50 50-100 100-350 15-150 15-350 keV
Fluence PL 2.45e-08 4.29e-08 5.72e-08 1.56e-07 1.67e-07 2.81e-07 erg/cm2
90%_error_low -6.89e-09 -8.28e-09 -1.58e-08 -7.26e-08 -3.77e-08 -9.06e-08 erg/cm2
90%_error_hi 7.27e-09 8.26e-09 1.60e-08 1.06e-07 3.89e-08 1.18e-07 erg/cm2
Peak flux PL 2.28e-01 2.08e-01 1.31e-01 1.27e-01 6.20e-01 6.94e-01 ph/cm2/s
90%_error_low -8.41e-02 -5.38e-02 -5.00e-02 -7.46e-02 -1.59e-01 -1.84e-01 ph/cm2/s
90%_error_hi 9.21e-02 5.36e-02 5.01e-02 1.17e-01 1.59e-01 1.88e-01 ph/cm2/s
Fluence CPL 2.23e-08 4.79e-08 5.73e-08 4.07e-08 1.52e-07 1.68e-07 erg/cm2
90%_error_low -7.87e-09 -1.08e-08 -1.95e-08 N/A -3.99e-08 -5.45e-08 erg/cm2
90%_error_hi 8.01e-09 1.15e-08 1.83e-08 N/A 4.33e-08 1.58e-07 erg/cm2
Peak flux CPL 1.98e-01 2.26e-01 1.41e-01 5.62e-02 6.02e-01 6.19e-01 ph/cm2/s
90%_error_low -1.98e-01 -6.34e-02 -5.65e-02 -5.62e-02 -1.63e-01 -1.76e-01 ph/cm2/s
90%_error_hi 1.08e-01 6.77e-02 6.02e-02 1.06e-01 1.63e-01 1.97e-01 ph/cm2/s
======================================================================
Image
Pre-slew 15.0-350.0 keV image (Event data)
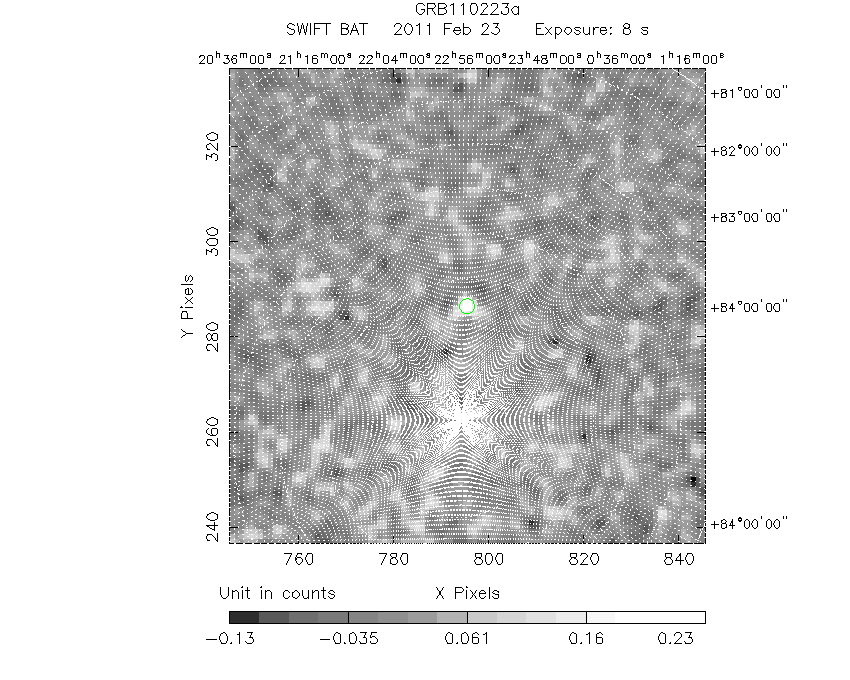
#   RAcent    DECcent   POSerr    Theta     Phi              Peak Cts       SNR   Name
  345.4772    87.5882   0.0235    23.6089    66.1071         0.2939093      8.183 TRIG_00446674

Foreground time interval of the image:
  0.080   8.080 (delta_t =   8.000 [sec])
Background time interval of the image:
-239.920   0.080 (delta_t = 240.000 [sec])
Light Curves
Note: The mask-weighted lightcurves have units of either count/det or counts/sec/det, where a det is 0.4 x 0.4 = 0.16 sq cm.
Full-time range; 1 s binning
Other quick-look light curves:
- 64 ms binning (zoomed)
- 16 ms binning (zoomed)
- 8 ms binning (zoomed)
- 2 ms binning (zoomed)
- SN=5 or 10 s binning (full-time range)
- Raw light curve
Spectra
- 64 ms binning (zoomed)
- 16 ms binning (zoomed)
- 8 ms binning (zoomed)
- 2 ms binning (zoomed)
- SN=5 or 10 s binning (full-time range)
- Raw light curve
Spectra
Notes:
- 1) The fitting includes the systematic errors.
- 2) When the burst includes telescope slew time periods, the fitting uses an average response file made from multiple 5-s response files through out the slew time plus single time preiod for the non-slew times, and weighted by the total counts in the corresponding time period using addrmf. An average response file is needed becuase a spectral fit using the pre-slew DRM will introduce some errors in both a spectral shape and a normalization if the PHA file contains a lot of the slew/post-slew time interval.
- 3) For fits to more complicated models (e.g. a power-law over a cutoff power-law), the BAT team has decided to require a chi-square improvement of more than 6 for each extra dof.
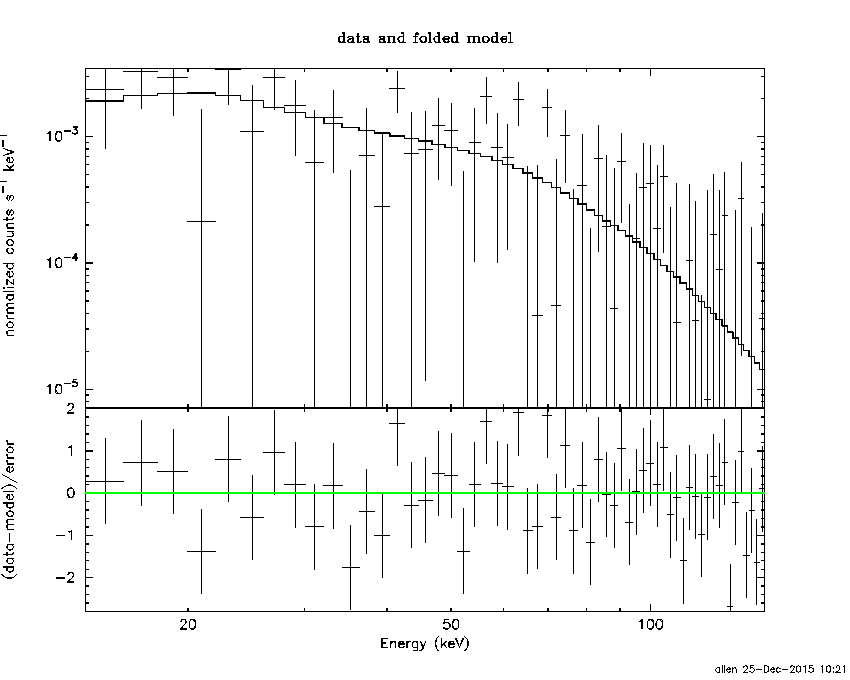
Time averaged spectrum fit using the average DRM
Power-law model
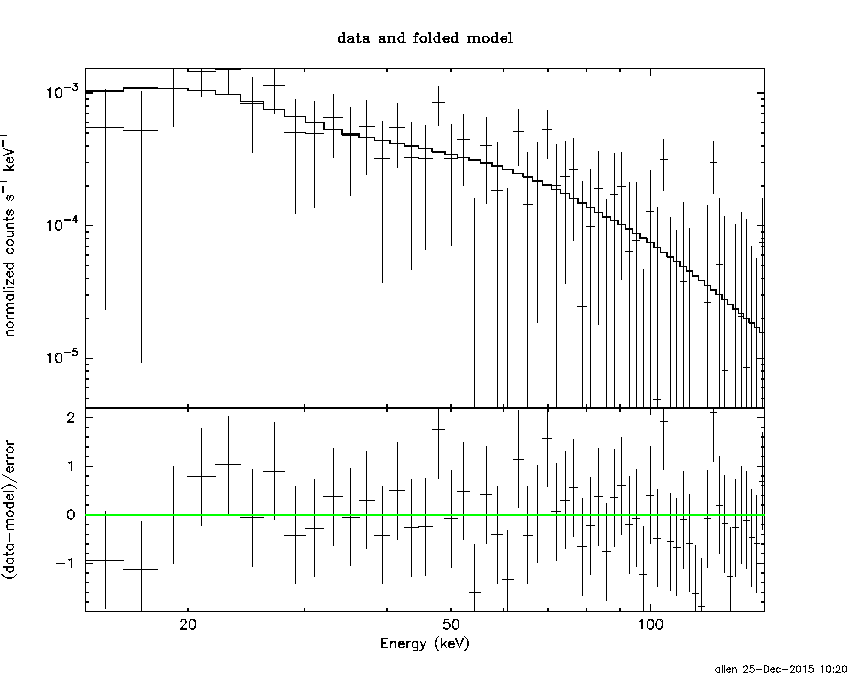
Time interval is from    0.080 sec. to    8.080 sec.

Spectral model in power-law:
------------------------------------------------------------
Parameters  : value       lower 90%   higher 90%
Photon index: -1.58323     ( -0.334499   0.321612 )
Norm@50keV  : 2.22185E-03    ( -0.00047321   0.000462926 )
------------------------------------------------------------
#Fit statistic : Chi-Squared =          40.02 using 59 PHA bins.
# Reduced chi-squared =         0.7022 for     57 degrees of freedom
# Null hypothesis probability =   9.571332e-01

Photon flux (15-150 keV)    in 8 sec: 0.284065 ( -0.054573  0.054593 ) ph/cm2/s
Energy fluence (15-150 keV)             : 1.66602e-07 ( -3.7655e-08  3.88738e-08 ) ergs/cm2
Cutoff power-law model
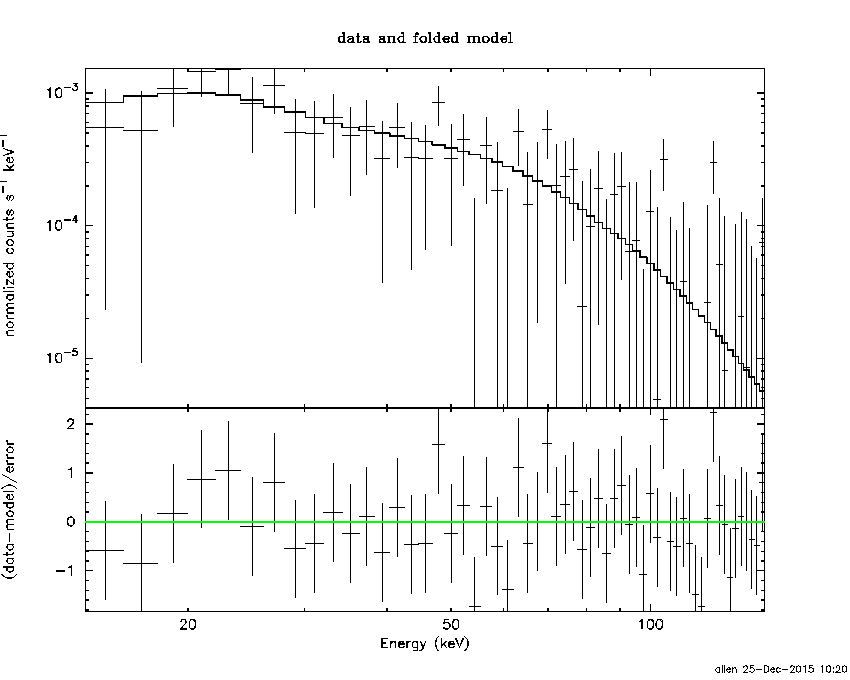
Time interval is from    0.080 sec. to    8.080 sec.
Spectral model in the cutoff power-law:
------------------------------------------------------------
Parameters  : value       lower 90%   higher 90%
Photon index: -0.670849     ( -1.30588   1.70922 )
Epeak [keV] : 65.1582      ( -21.3473 -65.1582 )
Norm@50keV  : 7.08904E-03    ( -0.00708903   0.0563317 )
------------------------------------------------------------
#Fit statistic : Chi-Squared =          38.50 using 59 PHA bins.
# Reduced chi-squared =         0.6875 for     56 degrees of freedom
# Null hypothesis probability =   9.641785e-01

Photon flux (15-150 keV)    in 8 sec: 0.275192 ( -0.055587  0.05583 ) ph/cm2/s
Energy fluence (15-150 keV)             : 1.52262e-07 ( -3.98503e-08  4.32714e-08 ) ergs/cm2
1-s peak spectrum fit
Power-law model
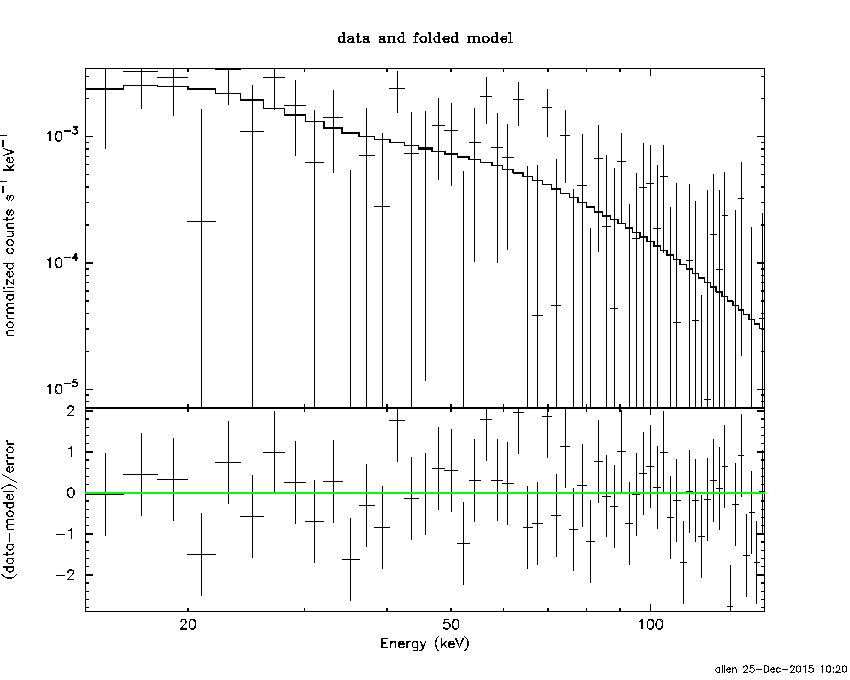
Time interval is from    0.080 sec. to    1.080 sec.

Spectral model in power-law:
------------------------------------------------------------
Parameters  : value       lower 90%   higher 90%
Photon index: -1.66426     ( -0.492389   0.441077 )
Norm@50keV  : 4.72808E-03    ( -0.00142397   0.0013612 )
------------------------------------------------------------
#Fit statistic : Chi-Squared =          52.80 using 59 PHA bins.
# Reduced chi-squared =         0.9263 for     57 degrees of freedom
# Null hypothesis probability =   6.333445e-01

Photon flux (15-150 keV)    in 1 sec: 0.620331 ( -0.159192  0.159218 ) ph/cm2/s
Energy fluence (15-150 keV)             : 4.39177e-08 ( -1.34899e-08  1.41093e-08 ) ergs/cm2
Cutoff power-law model
Time interval is from    0.080 sec. to    1.080 sec.
Spectral model in the cutoff power-law:
------------------------------------------------------------
Parameters  : value       lower 90%   higher 90%
Photon index: -0.820282     ( -1.42526   2.36988 )
Epeak [keV] : 68.9196      (   )
Norm@50keV  : 1.28271E-02    (     )
------------------------------------------------------------
#Fit statistic : Chi-Squared =          52.03 using 59 PHA bins.
# Reduced chi-squared =         0.9291 for     56 degrees of freedom
# Null hypothesis probability =   6.259883e-01

Photon flux (15-150 keV)    in 1 sec: 0.602144 ( -0.162552  0.1631 ) ph/cm2/s
Energy fluence (15-150 keV)             : 4.19411e-08 ( -1.33395e-08  1.45162e-08 ) ergs/cm2
Time-resolved spectra
Distribution
T90 vs. Hardness ratio plot
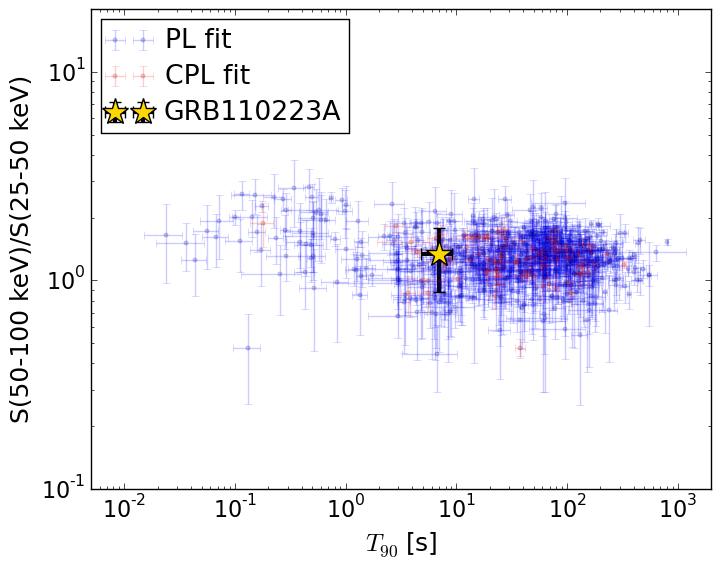
T90                                   = 7.0 sec.
Hardness ratio (energy fluence ratio) = 1.33490388635
S(15-50 keV) vs. S(50-150 keV) plot
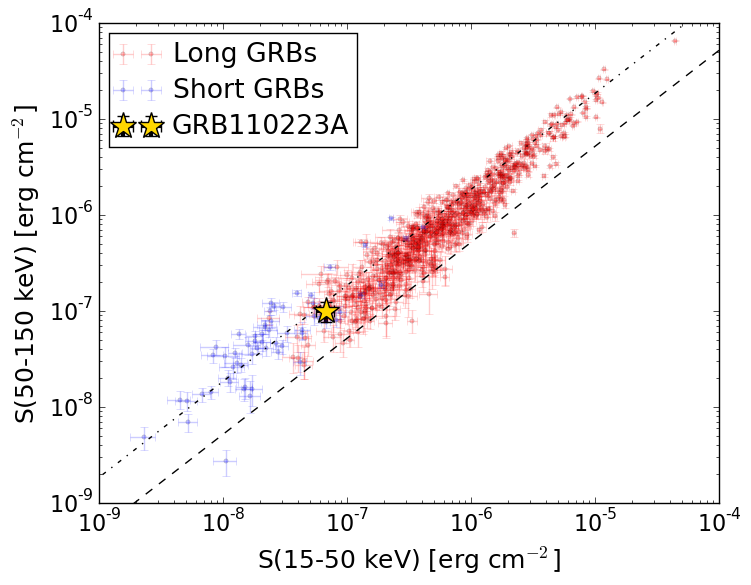
S(15-50 keV)  = 6.740376e-08
S(50-150 keV) = 9.919803e-08
The dash-dotted line and the dashed line traces the fluences calculated from the Band function with Epeak = 15 and 150 keV, respectively. Both lines assume a canonical values of alpha = -1 and beta = -2.5.
Mask shadow pattern
IMX = 1.770268091758329E-01, IMY = -3.996183056345154E-01
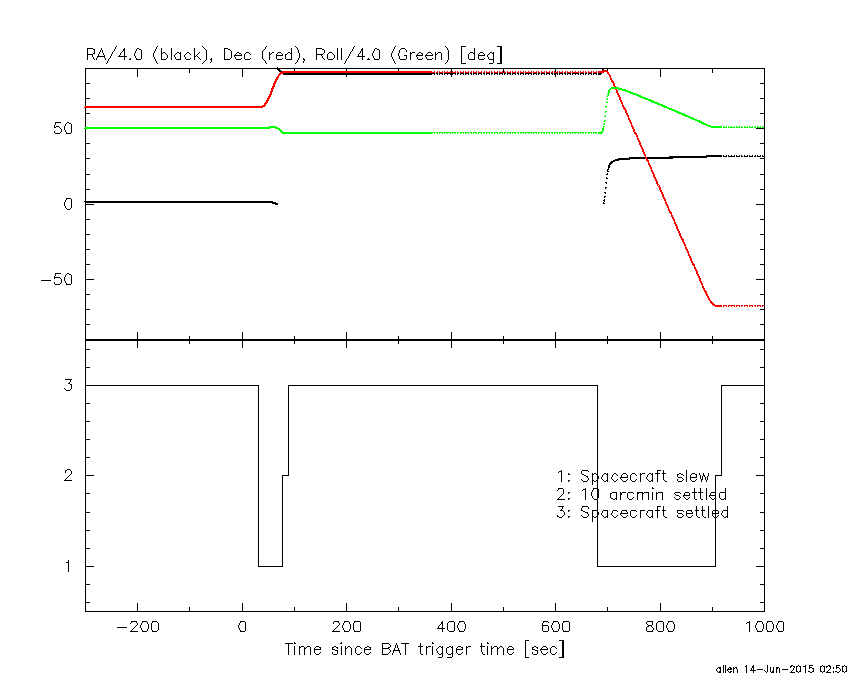
Spacecraft aspect plot
Bright source in the pre-burst/pre-slew/post-slew images
Pre-burst image of 15-350 keV band
Time interval of the image:
-239.920000 0.080000

# RAcent  DECcent POSerr Theta    Phi  PeakCts   SNR AngSep     Name
#  [deg]    [deg]    ['] [deg]  [deg]                   [']
299.5978  35.2016    1.7  48.8  -24.7   3.0065   6.9    0.4	Cyg X-1
308.1064  41.0827   10.4  40.2  -28.0   0.3070   1.1    7.8	Cyg X-3
325.9489  38.4344    8.2  35.0  -49.4   0.3811   1.4   12.5	Cyg X-2
 53.2042  29.9159    2.8  45.0 -175.2   1.2880   4.2 ------	UNKNOWN
 34.0339  12.3620    4.8  55.3 -145.2   2.8411   2.5 ------	UNKNOWN
Pre-slew background subtracted image of 15-350 keV band
Time interval of the image:
0.080000 8.080000

# RAcent  DECcent POSerr Theta    Phi  PeakCts   SNR AngSep     Name
#  [deg]    [deg]    ['] [deg]  [deg]                   [']
299.5012  35.0684   11.7  48.9  -24.7   0.0601   1.0    9.1	Cyg X-1
308.2614  40.8726    2.9  40.3  -28.3  -0.1687  -4.0    8.4	Cyg X-3
326.1067  38.3257   12.0  35.0  -49.6  -0.0411  -1.0    3.1	Cyg X-2
345.4767  87.5881    1.4  23.6   66.1   0.2938   8.2 ------	UNKNOWN
Post-slew image of 15-350 keV band
Time interval of the image:
77.780600 302.140000
360.080000 680.480600

# RAcent  DECcent POSerr Theta    Phi  PeakCts   SNR AngSep     Name
#  [deg]    [deg]    ['] [deg]  [deg]                   [']
254.4618  35.2971    6.9  54.8   -5.8   0.8994   1.7    2.7	Her X-1
 77.9517  35.2636    2.8  54.9  167.3   3.3820   4.1 ------	UNKNOWN
308.5030  43.1826    2.8  44.9  -60.1   3.1526   4.1 ------	UNKNOWN