Analysis Summary
Notes:
- 1) No attempt has been made to eliminate the non-significant decimal places.
- 2) This batgrbproduct analysis is done using the HEASARC data.
- 3) This batgrbproduct analysis is using the flight position for the mask-weighting calculation.
======================================================================
                  BAT GRB EVENT DATA PROCESSING REPORT
    Process Script Ver: batgrbproduct v2.46
    Process Start Time: Mon Jan 13 23:49:40 EST 2014
             Host Name: batevent1
   Current Working Dir: /local/data/batevent/batevent_reproc/trigger449074
======================================================================

  Trigger: 00449074      Segment: 000

  BAT Trigger Time: 321645344   [s; MET]
      Trigger Stop: 321645408   [s; MET]
               UTC: 2011-03-12T17:55:37.252060    [includes UTCF correction]
       Where From?: TDRSS position message

  BAT
    RA: 157.478927330622   Dec: -5.25539715048247  [deg; J2000]

     Catalogged Source?: NO
     Point Source?:      YES
     GRB Indicated?:     YES    [ by BAT flight software ]
     Image S/N Ratio:    8.46
     Image Trigger?:     YES
     Rate S/N Ratio:     0  [ if not an image trigger ]
     Image S/N Ratio:    8.46

  Analysis Position:   [ source = BAT ]
    RA: 157.478927330622   Dec: -5.25539715048247  [deg; J2000]

  Refined Position:   [ source = BAT pre-slew burst ]
    RA: 157.501452086839   Dec: -5.24851311355309  [deg; J2000]
        { 10h 30m 00.3s , -05d 14' 54.6" }
         +/- 2.17469144269274 [arcmin] (estimated 90% radius based on SNR)
         +/- 0.942252018649503 [arcmin] (formal 1-sigma fit error)
    SNR: 10.0258624842532

  Angular difference between the analysis and refined position is 1.407769 arcmin

  Partial Coding Fraction: 0.265625    [ including projection effects ]

  Duration
     T90: 35.1360000371933 +/- 7.78107652907125
        Measured from: 26.7760000228882
                   to: 61.9120000600815     [s; relative to TRIGTIME]
     T50: 14.6720000505447 +/- 4.83978840572785
        Measured from: 35.9599999785423
                   to: 50.6320000290871     [s; relative to TRIGTIME]


  Fluence
     Peak Flux  (peak 1 second)
        Measured from: 44.2039999961853
                   to: 45.2039999961853     [s; relative to TRIGTIME]
     Total Fluence
        Measured from: 24.727999985218
                   to: 64.7760000228882     [s; relative to TRIGTIME]

             Band 1     Band 2     Band 3     Band 4
              15-25      25-50     50-100    100-350     keV
 Total     0.736212   0.633860   0.215651   0.070906
           0.068068   0.070712   0.065264   0.067413 [error]
 Peak      0.058484   0.036804   0.040830   0.016228
           0.011313   0.011064   0.009979   0.010671 [error]

     [ fluence units of on-axis counts / fully illuminated detector ]

======================================================================


====== Table of the duration information =============================

        Value   tstart    tstop
T100   40.048   24.728   64.776
T90    35.136   26.776   61.912
T50    14.672   35.960   50.632
Peak    1.000   44.204   45.204


====== Spectral Analysis Summary =====================================

Model      : spectral model: simple power-law (PL) and cutoff power-law (CPL)
Ph_index   : photon index: E^{Ph_index}
Ph_90err   : 90% error of the photon index
Epeak      : Epeak in keV
Epeak_90err: 90% error of Epeak
Norm       : normalization at 50 keV in both the PL model and CPL model
Nomr_90err : 90% error of the normalization
chi2       : Chi-Squared
dof        : degree of freedo

=== Time-averaged spectral analysis ===
(Best model with acceptable fit: PL)

Model Ph_index Ph_90err_low Ph_90err_hi  Epeak  Epeak_90err_low  Epeak_90err_hi  Norm       Nomr_90err_low    Norm_90err_hi    chi2    dof
PL      -2.333    -0.271      0.248       -           -               -         2.11e-03     -4.11e-04          4.07e-04      47.950   57
CPL     -1.526    -0.767      1.457       20.593      N/A           N/A         6.94e-03        N/A               N/A         46.450   56


=== 1-s peak spectral analysis ===
(Best model with acceptable fit: PL)

Model Ph_index Ph_90err_low Ph_90err_hi  Epeak  Epeak_90err_low  Epeak_90err_hi  Norm       Nomr_90err_low    Norm_90err_hi    chi2    dof
PL      -1.849     -0.527     0.468       -           -               -         8.34e-03     -2.53e-03          2.33e-03      59.860   57
CPL     -1.855     -1.047     1.082     9999.320      N/A           N/A         8.33e-03        N/A               N/A         59.860   56


=== Fluence/Peak Flux Summary ===

              Model    Band1     Band2     Band3     Band4     Band5     Total
                       15-25     25-50    50-100    100-350    15-150    15-350    keV
Fluence         PL   2.37e-07  2.64e-07  2.09e-07  2.75e-07  8.12e-07  9.85e-07   erg/cm2
      90%_error_low -3.59e-08 -3.58e-08 -5.36e-08 -1.14e-07 -1.25e-07 -1.95e-07   erg/cm2
      90%_error_hi   3.63e-08  3.51e-08  5.77e-08  1.62e-07  1.30e-07  2.32e-07   erg/cm2
Peak flux       PL   4.81e-01  3.94e-01  2.19e-01  1.79e-01  1.17e+00  1.27e+00   ph/cm2/s
      90%_error_low -1.73e-01 -9.21e-02 -8.58e-02 -1.09e-01 -2.75e-01 -3.01e-01   ph/cm2/s
      90%_error_hi   1.86e-01  9.20e-02  8.55e-02  1.79e-01  2.75e-01  3.03e-01   ph/cm2/s

Fluence        CPL   2.31e-07  2.86e-07  1.77e-07  5.70e-08  7.36e-07  7.52e-07   erg/cm2
      90%_error_low -3.85e-08    N/A    -7.78e-08    N/A       N/A    -1.47e-07   erg/cm2
      90%_error_hi   3.81e-08    N/A     7.41e-08    N/A       N/A     3.35e-07   erg/cm2
Peak flux      CPL     N/A      N/A      N/A      N/A      N/A      N/A     ph/cm2/s
      90%_error_low -1.73e-01 -9.21e-02 -8.58e-02 -1.09e-01 -2.75e-01 -3.01e-01   ph/cm2/s
      90%_error_hi   1.86e-01  9.20e-02  8.55e-02  1.79e-01  2.75e-01  3.03e-01   ph/cm2/s

======================================================================
Image
Pre-slew 15.0-350.0 keV image (Event data)
#   RAcent    DECcent   POSerr    Theta     Phi              Peak Cts       SNR   Name
  157.5015    -5.2485   0.0191    33.0788    81.3812         1.6105041     10.026 TRIG_00449074

Foreground time interval of the image:
 24.728  64.776 (delta_t =  40.048 [sec])
Background time interval of the image:
-133.499  24.728 (delta_t = 158.227 [sec])
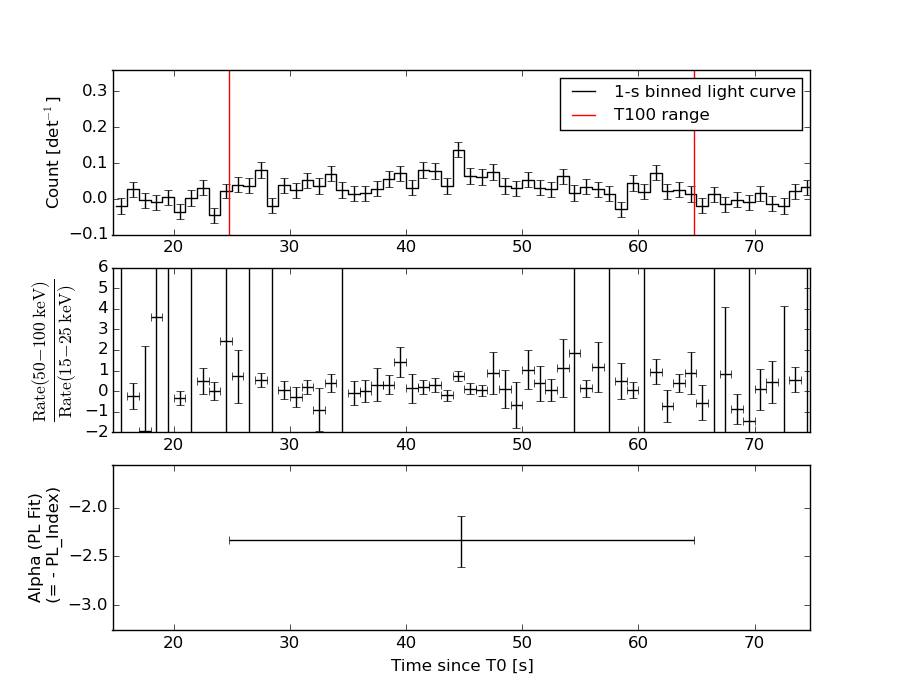
Light Curves
Note: The mask-weighted lightcurves have units of either count/det or counts/sec/det, where a det is 0.4 x 0.4 = 0.16 sq cm.
Full-time range; 1 s binning
Other quick-look light curves:
- 64 ms binning (zoomed)
- 16 ms binning (zoomed)
- 8 ms binning (zoomed)
- 2 ms binning (zoomed)
- SN=5 or 10 s binning (full-time range)
- Raw light curve
Spectra
- 64 ms binning (zoomed)
- 16 ms binning (zoomed)
- 8 ms binning (zoomed)
- 2 ms binning (zoomed)
- SN=5 or 10 s binning (full-time range)
- Raw light curve
Spectra
Notes:
- 1) The fitting includes the systematic errors.
- 2) When the burst includes telescope slew time periods, the fitting uses an average response file made from multiple 5-s response files through out the slew time plus single time preiod for the non-slew times, and weighted by the total counts in the corresponding time period using addrmf. An average response file is needed becuase a spectral fit using the pre-slew DRM will introduce some errors in both a spectral shape and a normalization if the PHA file contains a lot of the slew/post-slew time interval.
- 3) For fits to more complicated models (e.g. a power-law over a cutoff power-law), the BAT team has decided to require a chi-square improvement of more than 6 for each extra dof.
Time averaged spectrum fit using the average DRM
Power-law model
Time interval is from   24.728 sec. to   64.776 sec.

Spectral model in power-law:
------------------------------------------------------------
Parameters  : value       lower 90%   higher 90%
Photon index: -2.33265     ( -0.271473   0.248326 )
Norm@50keV  : 2.10710E-03    ( -0.00041114   0.000406723 )
------------------------------------------------------------
#Fit statistic : Chi-Squared =          47.95 using 59 PHA bins.
# Reduced chi-squared =         0.8413 for     57 degrees of freedom
# Null hypothesis probability =   7.977318e-01

Photon flux (15-150 keV)    in 40.05 sec: 0.375086 ( -0.045199  0.045207 ) ph/cm2/s
Energy fluence (15-150 keV)             : 8.11657e-07 ( -1.24949e-07  1.30498e-07 ) ergs/cm2
Cutoff power-law model
Time interval is from   24.728 sec. to   64.776 sec.
Spectral model in the cutoff power-law:
------------------------------------------------------------
Parameters  : value       lower 90%   higher 90%
Photon index: -1.5258     ( -0.767225   1.45718 )
Epeak [keV] : 20.5928      (   )
Norm@50keV  : 6.93979E-03    (     )
------------------------------------------------------------
#Fit statistic : Chi-Squared =          46.45 using 59 PHA bins.
# Reduced chi-squared =         0.8295 for     56 degrees of freedom
# Null hypothesis probability =   8.146238e-01

Photon flux (15-150 keV)    in 40.05 sec: 0.375599 ( -0.04559  0.044936 ) ph/cm2/s
Energy fluence (15-150 keV)             : 7.36467e-07 ( 0  0 ) ergs/cm2
1-s peak spectrum fit
Power-law model
Time interval is from   44.204 sec. to   45.204 sec.

Spectral model in power-law:
------------------------------------------------------------
Parameters  : value       lower 90%   higher 90%
Photon index: -1.84912     ( -0.52711   0.468376 )
Norm@50keV  : 8.34142E-03    ( -0.00253136   0.00232784 )
------------------------------------------------------------
#Fit statistic : Chi-Squared =          59.86 using 59 PHA bins.
# Reduced chi-squared =          1.050 for     57 degrees of freedom
# Null hypothesis probability =   3.724263e-01

Photon flux (15-150 keV)    in 1 sec: 1.17212 ( -0.275033  0.27534 ) ph/cm2/s
Energy fluence (15-150 keV)             : 7.67096e-08 ( -2.1887e-08  2.27645e-08 ) ergs/cm2
Cutoff power-law model
Time interval is from   44.204 sec. to   45.204 sec.
Spectral model in the cutoff power-law:
------------------------------------------------------------
Parameters  : value       lower 90%   higher 90%
Photon index: -2.68935     ( -0.212669   1.91627 )
Epeak [keV] : 227.047      (   )
Norm@50keV  : 3.26588E-03    (     )
------------------------------------------------------------
#Fit statistic : Chi-Squared =          59.43 using 59 PHA bins.
# Reduced chi-squared =          1.061 for     56 degrees of freedom
# Null hypothesis probability =   3.518850e-01

Photon flux (15-150 keV)    in 1 sec:  (    ) ph/cm2/s
Energy fluence (15-150 keV)             : 5.77364e-08 ( 0  0 ) ergs/cm2
Time-resolved spectra
Distribution
T90 vs. Hardness ratio plot
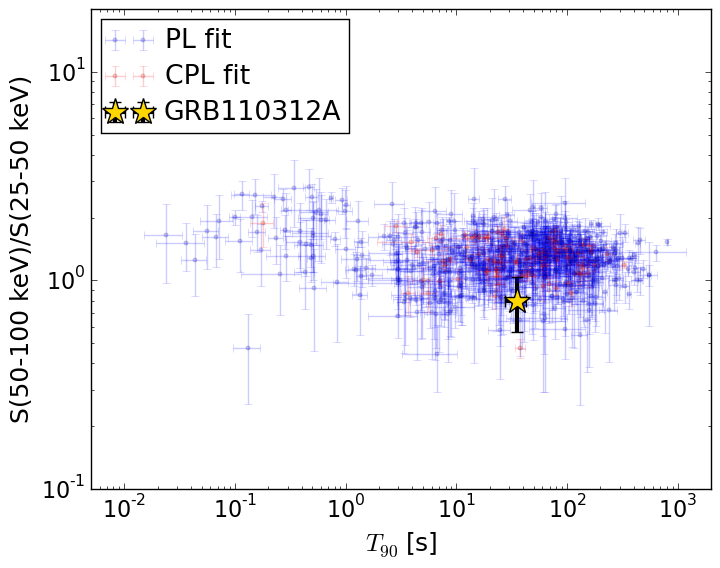
T90                                   = 35.136 sec.
Hardness ratio (energy fluence ratio) = 0.794127245419
S(15-50 keV) vs. S(50-150 keV) plot
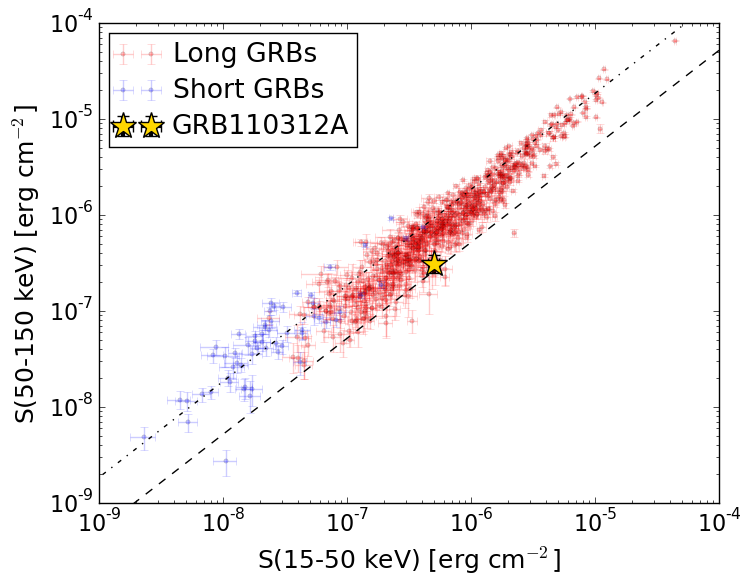
S(15-50 keV)  = 5.005823e-07
S(50-150 keV) = 3.110949e-07
The dash-dotted line and the dashed line traces the fluences calculated from the Band function with Epeak = 15 and 150 keV, respectively. Both lines assume a canonical values of alpha = -1 and beta = -2.5.
Mask shadow pattern
IMX = 9.761395287750096E-02, IMY = -6.440098545552502E-01
Spacecraft aspect plot
Bright source in the pre-burst/pre-slew/post-slew images
Pre-burst image of 15-350 keV band
Time interval of the image:
-133.499410 24.728000

# RAcent  DECcent POSerr Theta    Phi  PeakCts   SNR AngSep     Name
#  [deg]    [deg]    ['] [deg]  [deg]                   [']
135.5276 -40.5328    1.3  17.0  -23.1   1.4418   8.7    1.3	Vela X-1
170.1533 -60.6159    5.2  23.7 -114.4   0.4225   2.2    4.8	Cen X-3
186.4957 -62.7335    5.1  30.1 -125.2   0.5056   2.3    4.9	GX 301-2
189.9443  -7.6090    2.6  42.5  133.4   2.3863   4.4 ------	UNKNOWN
132.1855 -18.8571    2.4  29.3   25.7   0.9258   4.9 ------	UNKNOWN
209.2856 -31.3967    2.4  42.6  178.2   1.3703   4.8 ------	UNKNOWN
165.2340 -41.9674    2.4   7.0 -155.0   0.7211   4.8 ------	UNKNOWN
116.8714 -28.4762    2.7  34.9   -4.8   0.8645   4.2 ------	UNKNOWN
105.9640 -26.0590    2.6  44.6   -8.6   1.1784   4.5 ------	UNKNOWN
138.6884 -61.7681    2.8  26.1  -78.6   0.8748   4.2 ------	UNKNOWN
234.4169 -40.6506    2.9  57.5 -160.1   3.3889   3.9 ------	UNKNOWN
 87.9354 -26.6532    2.6  58.4  -19.5   4.0303   4.5 ------	UNKNOWN
 85.0375 -30.0422    2.9  58.9  -24.4   4.9576   4.0 ------	UNKNOWN
Pre-slew background subtracted image of 15-350 keV band
Time interval of the image:
24.728000 64.776000

# RAcent  DECcent POSerr Theta    Phi  PeakCts   SNR AngSep     Name
#  [deg]    [deg]    ['] [deg]  [deg]                   [']
135.4650 -40.4428    3.2  17.0  -22.8  -0.2734  -3.6    7.3	Vela X-1
170.1703 -60.6978    8.7  23.8 -114.4  -0.1149  -1.3    6.2	Cen X-3
186.3478 -62.7582   10.7  30.0 -125.1  -0.1101  -1.1    8.5	GX 301-2
157.5015  -5.2485    1.1  33.1   81.4   1.6101  10.0 ------	UNKNOWN
174.8128 -20.7926    2.0  23.1  126.7   0.5455   5.8 ------	UNKNOWN
158.8245 -63.2338    2.1  24.9 -100.3   0.5138   5.4 ------	UNKNOWN
Post-slew image of 15-350 keV band
Time interval of the image:
146.700650 963.160000

# RAcent  DECcent POSerr Theta    Phi  PeakCts   SNR AngSep     Name
#  [deg]    [deg]    ['] [deg]  [deg]                   [']
135.5021 -40.5318    1.1  40.4 -124.5   9.3784  10.1    1.8	Vela X-1
170.2574 -60.6358   17.7  56.2 -158.0  -1.4477  -0.6    1.9	Cen X-3
155.5829 -35.6594    2.5  30.5 -147.5   2.3892   4.7 ------	UNKNOWN
148.6460 -60.0888    4.0  55.3 -145.2   9.2846   2.9 ------	UNKNOWN