Analysis Summary
Notes:
- 1) No attempt has been made to eliminate the non-significant decimal places.
- 2) This batgrbproduct analysis is done using the HEASARC data.
- 3) This batgrbproduct analysis is using the flight position for the mask-weighting calculation.
======================================================================
BAT GRB EVENT DATA PROCESSING REPORT
Process Script Ver: batgrbproduct v2.46
Process Start Time: Mon Jan 13 23:42:52 EST 2014
Host Name: batevent1
Current Working Dir: /local/data/batevent/batevent_reproc/trigger449399
======================================================================
Trigger: 00449399 Segment: 000
BAT Trigger Time: 321926231.296 [s; MET]
Trigger Stop: 321926235.392 [s; MET]
UTC: 2011-03-15T23:57:04.537480 [includes UTCF correction]
Where From?: TDRSS position message
BAT
RA: 279.191126332668 Dec: 17.5321484999389 [deg; J2000]
Catalogged Source?: NO
Point Source?: YES
GRB Indicated?: YES [ by BAT flight software ]
Image S/N Ratio: 11.06
Image Trigger?: NO
Rate S/N Ratio: 9.74679434480896 [ if not an image trigger ]
Image S/N Ratio: 11.06
Analysis Position: [ source = BAT ]
RA: 279.191126332668 Dec: 17.5321484999389 [deg; J2000]
Refined Position: [ source = BAT pre-slew burst ]
RA: 279.204684110321 Dec: 17.5367582609684 [deg; J2000]
{ 18h 36m 49.1s , +17d 32' 12.3" }
+/- 1.03659230859771 [arcmin] (estimated 90% radius based on SNR)
+/- 0.361548924956912 [arcmin] (formal 1-sigma fit error)
SNR: 28.8949044519654
Angular difference between the analysis and refined position is 0.823507 arcmin
Partial Coding Fraction: 0.5703125 [ including projection effects ]
Duration
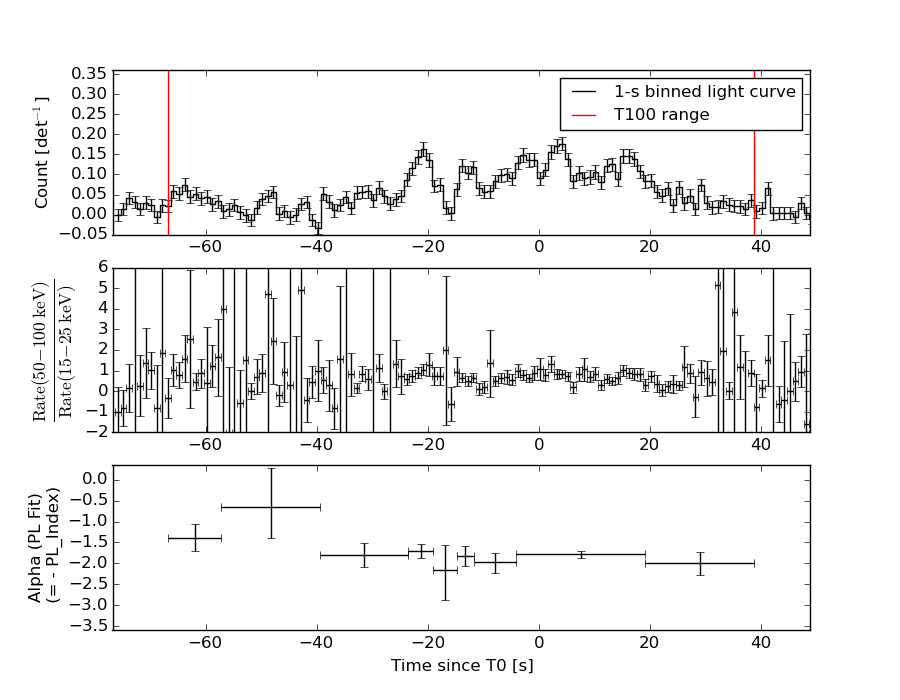
T90: 87.6759999394417 +/- 11.8267709656415
Measured from: -60.6359999775887
to: 27.039999961853 [s; relative to TRIGTIME]
T50: 32.5839999318123 +/- 2.15692374081893
Measured from: -20.7519999742508
to: 11.8319999575615 [s; relative to TRIGTIME]
Fluence
Peak Flux (peak 1 second)
Measured from: 3.12800002098083
to: 4.12800002098083 [s; relative to TRIGTIME]
Total Fluence
Measured from: -66.7639999985695
to: 38.839999973774 [s; relative to TRIGTIME]
Band 1 Band 2 Band 3 Band 4
15-25 25-50 50-100 100-350 keV
Total 2.083191 2.569981 1.654212 0.375730
0.095410 0.088663 0.076001 0.068294 [error]
Peak 0.059155 0.078618 0.041313 0.021078
0.009719 0.009618 0.008157 0.006943 [error]
[ fluence units of on-axis counts / fully illuminated detector ]
======================================================================
====== Table of the duration information =============================
Value tstart tstop
T100 105.604 -66.764 38.840
T90 87.676 -60.636 27.040
T50 32.584 -20.752 11.832
Peak 1.000 3.128 4.128
====== Spectral Analysis Summary =====================================
Model : spectral model: simple power-law (PL) and cutoff power-law (CPL)
Ph_index : photon index: E^{Ph_index}
Ph_90err : 90% error of the photon index
Epeak : Epeak in keV
Epeak_90err: 90% error of Epeak
Norm : normalization at 50 keV in both the PL model and CPL model
Nomr_90err : 90% error of the normalization
chi2 : Chi-Squared
dof : degree of freedo
=== Time-averaged spectral analysis ===
(Best model with acceptable fit: PL)
Model Ph_index Ph_90err_low Ph_90err_hi Epeak Epeak_90err_low Epeak_90err_hi Norm Nomr_90err_low Norm_90err_hi chi2 dof
PL -1.767 -0.081 0.080 - - - 4.19e-03 -1.81e-04 1.81e-04 48.500 57
CPL -1.655 -0.183 0.327 155.622 -81.334 -155.622 4.76e-03 -8.08e-04 2.08e-03 48.120 56
=== 1-s peak spectral analysis ===
(Best model with acceptable fit: PL)
Model Ph_index Ph_90err_low Ph_90err_hi Epeak Epeak_90err_low Epeak_90err_hi Norm Nomr_90err_low Norm_90err_hi chi2 dof
PL -1.658 -0.247 0.242 - - - 1.30e-02 -1.92e-03 1.90e-03 69.980 57
CPL -1.153 -0.721 1.473 80.310 -80.310 -80.310 2.40e-02 -2.40e-02 1.17e-01 69.390 56
=== Fluence/Peak Flux Summary ===
Model Band1 Band2 Band3 Band4 Band5 Total
15-25 25-50 50-100 100-350 15-150 15-350 keV
Fluence PL 7.26e-07 1.13e-06 1.33e-06 3.03e-06 4.08e-06 6.22e-06 erg/cm2
90%_error_low -5.51e-08 -5.06e-08 -7.70e-08 -3.69e-07 -1.81e-07 -4.25e-07 erg/cm2
90%_error_hi 5.66e-08 5.04e-08 7.69e-08 4.02e-07 1.81e-07 4.50e-07 erg/cm2
Peak flux PL 6.24e-01 5.72e-01 3.62e-01 3.52e-01 1.70e+00 1.91e+00 ph/cm2/s
90%_error_low -1.43e-01 -8.53e-02 -6.73e-02 -1.16e-01 -2.48e-01 -2.69e-01 ph/cm2/s
90%_error_hi 1.52e-01 8.45e-02 6.65e-02 1.45e-01 2.48e-01 2.69e-01 ph/cm2/s
Fluence CPL 7.11e-07 1.14e-06 1.34e-06 2.56e-06 4.04e-06 5.75e-06 erg/cm2
90%_error_low -6.89e-08 -5.72e-08 -8.03e-08 -9.26e-07 -2.08e-07 -9.52e-07 erg/cm2
90%_error_hi 5.67e-08 5.83e-08 8.13e-08 5.70e-07 2.05e-07 6.39e-07 erg/cm2
Peak flux CPL 5.77e-01 6.02e-01 3.74e-01 1.98e-01 1.67e+00 1.75e+00 ph/cm2/s
90%_error_low -1.78e-01 -1.02e-01 -7.33e-02 -1.98e-01 -2.62e-01 -3.18e-01 ph/cm2/s
90%_error_hi 1.80e-01 1.14e-01 7.62e-02 1.93e-01 2.59e-01 3.37e-01 ph/cm2/s
======================================================================
Image
Pre-slew 15.0-350.0 keV image (Event data)
#   RAcent    DECcent   POSerr    Theta     Phi              Peak Cts       SNR   Name
  279.2047    17.5368   0.0066    40.4920  -170.6491         6.5049972     28.895 TRIG_00449399

Foreground time interval of the image:
-66.764  35.405 (delta_t = 102.169 [sec])
Background time interval of the image:
-239.296 -66.764 (delta_t = 172.532 [sec])
Light Curves
Note: The mask-weighted lightcurves have units of either count/det or counts/sec/det, where a det is 0.4 x 0.4 = 0.16 sq cm.
Full-time range; 1 s binning
Other quick-look light curves:
- 64 ms binning (zoomed)
- 16 ms binning (zoomed)
- 8 ms binning (zoomed)
- 2 ms binning (zoomed)
- SN=5 or 10 s binning (full-time range)
- Raw light curve
Spectra
- 64 ms binning (zoomed)
- 16 ms binning (zoomed)
- 8 ms binning (zoomed)
- 2 ms binning (zoomed)
- SN=5 or 10 s binning (full-time range)
- Raw light curve
Spectra
Notes:
- 1) The fitting includes the systematic errors.
- 2) When the burst includes telescope slew time periods, the fitting uses an average response file made from multiple 5-s response files through out the slew time plus single time preiod for the non-slew times, and weighted by the total counts in the corresponding time period using addrmf. An average response file is needed becuase a spectral fit using the pre-slew DRM will introduce some errors in both a spectral shape and a normalization if the PHA file contains a lot of the slew/post-slew time interval.
- 3) For fits to more complicated models (e.g. a power-law over a cutoff power-law), the BAT team has decided to require a chi-square improvement of more than 6 for each extra dof.
Time averaged spectrum fit using the average DRM
Power-law model
Time interval is from  -66.764 sec. to   38.840 sec.

Spectral model in power-law:
------------------------------------------------------------
Parameters  : value       lower 90%   higher 90%
Photon index: -1.76706     ( -0.0809815   0.080343 )
Norm@50keV  : 4.18892E-03    ( -0.000181151   0.000180617 )
------------------------------------------------------------
#Fit statistic : Chi-Squared =          48.50 using 59 PHA bins.
# Reduced chi-squared =         0.8508 for     57 degrees of freedom
# Null hypothesis probability =   7.812731e-01

Photon flux (15-150 keV)    in 105.6 sec: 0.570044 ( -0.026018  0.026126 ) ph/cm2/s
Energy fluence (15-150 keV)             : 4.07863e-06 ( -1.80791e-07  1.81313e-07 ) ergs/cm2
Cutoff power-law model
Time interval is from  -66.764 sec. to   38.840 sec.
Spectral model in the cutoff power-law:
------------------------------------------------------------
Parameters  : value       lower 90%   higher 90%
Photon index: -1.65503     ( -0.183149   0.326623 )
Epeak [keV] : 155.622      ( -81.3396 -155.628 )
Norm@50keV  : 4.75883E-03    ( -0.000807525   0.00208478 )
------------------------------------------------------------
#Fit statistic : Chi-Squared =          48.12 using 59 PHA bins.
# Reduced chi-squared =         0.8593 for     56 degrees of freedom
# Null hypothesis probability =   7.639419e-01

Photon flux (15-150 keV)    in 105.6 sec: 0.565455 ( -0.028762  0.028458 ) ph/cm2/s
Energy fluence (15-150 keV)             : 4.04161e-06 ( -2.0768e-07  2.05017e-07 ) ergs/cm2
1-s peak spectrum fit
Power-law model
Time interval is from    3.128 sec. to    4.128 sec.

Spectral model in power-law:
------------------------------------------------------------
Parameters  : value       lower 90%   higher 90%
Photon index: -1.65803     ( -0.247375   0.241913 )
Norm@50keV  : 1.30166E-02    ( -0.0019233   0.00190256 )
------------------------------------------------------------
#Fit statistic : Chi-Squared =          69.98 using 59 PHA bins.
# Reduced chi-squared =          1.228 for     57 degrees of freedom
# Null hypothesis probability =   1.159081e-01

Photon flux (15-150 keV)    in 1 sec: 1.70424 ( -0.2477  0.24845 ) ph/cm2/s
Energy fluence (15-150 keV)             : 1.20979e-07 ( -1.86685e-08  1.88573e-08 ) ergs/cm2
Cutoff power-law model
Time interval is from    3.128 sec. to    4.128 sec.
Spectral model in the cutoff power-law:
------------------------------------------------------------
Parameters  : value       lower 90%   higher 90%
Photon index: -1.15338     ( -0.720559   1.47342 )
Epeak [keV] : 80.3096      ( -80.3644 -80.3644 )
Norm@50keV  : 2.39688E-02    ( -0.0239443   0.117054 )
------------------------------------------------------------
#Fit statistic : Chi-Squared =          69.39 using 59 PHA bins.
# Reduced chi-squared =          1.239 for     56 degrees of freedom
# Null hypothesis probability =   1.078293e-01

Photon flux (15-150 keV)    in 1 sec: 1.67055 ( -0.26219  0.25934 ) ph/cm2/s
Energy fluence (15-150 keV)             : 1.16445e-07 ( -2.1793e-08  2.12157e-08 ) ergs/cm2
Time-resolved spectra
Distribution
T90 vs. Hardness ratio plot
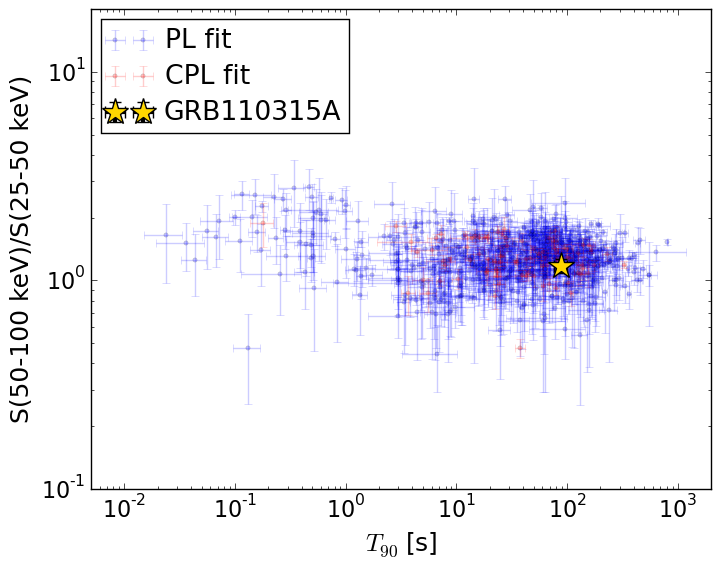
T90                                   = 87.676 sec.
Hardness ratio (energy fluence ratio) = 1.17524944186
S(15-50 keV) vs. S(50-150 keV) plot
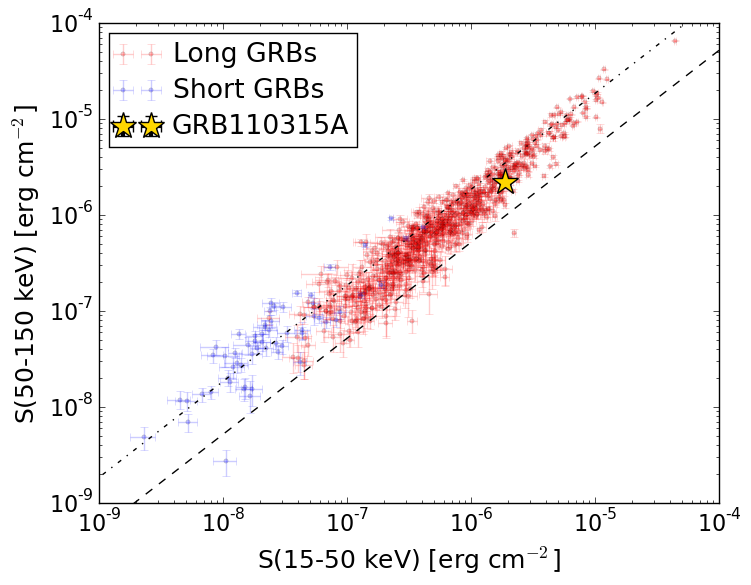
S(15-50 keV)  = 1.8602779e-06
S(50-150 keV) = 2.2183582e-06
The dash-dotted line and the dashed line traces the fluences calculated from the Band function with Epeak = 15 and 150 keV, respectively. Both lines assume a canonical values of alpha = -1 and beta = -2.5.
Mask shadow pattern
IMX = -8.424927693442371E-01, IMY = 1.387327467616037E-01
Spacecraft aspect plot
Bright source in the pre-burst/pre-slew/post-slew images
Pre-burst image of 15-350 keV band
Time interval of the image:
-239.296000 -66.764000

# RAcent  DECcent POSerr Theta    Phi  PeakCts   SNR AngSep     Name
#  [deg]    [deg]    ['] [deg]  [deg]                   [']
244.9813 -15.6396    0.4  26.0   98.2   7.2703  28.4    0.1	Sco X-1
255.9185 -37.8373    1.4  20.6   35.6   1.5295   8.0    3.3	4U 1700-377
256.3032 -36.4328    4.9  19.4   37.9   0.4407   2.3    6.4	GX 349+2
263.0921 -24.7381    2.0   8.2   69.0   0.9593   5.7    4.6	GX 1+4
264.5677 -44.2850    0.0  22.8   11.3   0.3553   2.0   12.4	4U 1735-44
268.4029  -1.4177    4.3  21.1  169.2   0.5183   2.7    3.0	SW J1753.5-0127
270.2820 -25.0678    2.6   3.1   21.5   0.8424   4.5    0.7	GX 5-1
270.2121 -25.7243    4.5   3.7   18.3   0.4879   2.6    5.0	GRS 1758-258
274.1583 -14.0741    6.2   8.5 -165.0   0.3360   1.9    9.2	GX 17+2
275.7520 -30.5174    0.0   9.0  -25.1   0.2403   1.4   12.7	H1820-303
285.2083 -25.0269    4.1  12.7  -76.7   0.5053   2.9   11.3	HT1900.1-2455
288.7978  10.9331    1.5  37.2 -153.2   1.8614   7.8    0.7	GRS 1915+105
262.9226 -33.7791    2.5  13.8   29.9   0.7627   4.6    4.7	GX 354-0
238.7225 -14.2669    2.8  32.2   96.8   1.3778   4.1 ------	UNKNOWN
303.7665  23.2510    2.9  55.2 -145.3   5.1629   4.0 ------	UNKNOWN
Pre-slew background subtracted image of 15-350 keV band
Time interval of the image:
-66.764000 35.404600

# RAcent  DECcent POSerr Theta    Phi  PeakCts   SNR AngSep     Name
#  [deg]    [deg]    ['] [deg]  [deg]                   [']
245.0054 -15.5518    2.5  26.0   98.5   1.0023   4.6    5.5	Sco X-1
256.0181 -37.8361  187.2  20.5   35.4  -0.0098  -0.1    1.6	4U 1700-377
256.4355 -36.4234    4.7  19.3   37.7   0.3839   2.5    0.0	GX 349+2
263.1589 -24.9078    0.0   8.2   67.7  -0.1132  -0.8   12.7	GX 1+4
264.7258 -44.3397    6.9  22.8   11.0   0.2513   1.7    6.7	4U 1735-44
268.5000  -1.6065    0.0  20.9  169.4   0.2843   1.8   12.2	SW J1753.5-0127
270.4251 -24.9344    8.3   2.9   20.2   0.1992   1.4   11.6	GX 5-1
270.4748 -25.6065    4.8   3.5   15.3   0.3582   2.5   12.4	GRS 1758-258
273.9717 -13.9578    3.7   8.6 -166.4   0.4312   3.1    5.1	GX 17+2
275.8936 -30.2176   11.8   8.8  -26.7  -0.1358  -1.0    9.1	H1820-303
284.9679 -25.0468    4.7  12.5  -76.4  -0.3596  -2.5    8.4	HT1900.1-2455
288.6538  11.1028    0.0  37.3 -153.5   0.4243   2.1   12.7	GRS 1915+105
263.0800 -33.6935    6.4  13.7   29.7  -0.2431  -1.8    9.6	GX 354-0
228.9457 -42.1475    2.7  40.6   48.7   1.7341   4.2 ------	UNKNOWN
279.2047  17.5367    0.4  40.5 -170.6   6.5046  28.9 ------	UNKNOWN
Post-slew image of 15-350 keV band
Time interval of the image:
93.804590 559.304600

# RAcent  DECcent POSerr Theta    Phi  PeakCts   SNR AngSep     Name
#  [deg]    [deg]    ['] [deg]  [deg]                   [']
244.9749 -15.6469    0.8  47.3   41.5  18.9665  13.6    0.5	Sco X-1
254.4593  35.3465   19.1  28.3  128.0  -0.2761  -0.6    0.3	Her X-1
262.9863 -24.7232    3.2  45.1   15.0   2.4604   3.6    1.8	GX 1+4
268.4278  -1.4826    2.3  21.8   24.3   1.5682   5.0    4.0	SW J1753.5-0127
270.2438 -25.1034    3.7  43.5    5.9   1.6705   3.1    2.6	GX 5-1
270.1980 -25.6868    4.2  44.1    5.7   1.5347   2.7    6.6	GRS 1758-258
273.9243 -14.0241    3.2  32.0    3.7   1.4073   3.6    4.8	GX 17+2
275.8884 -30.4985    5.4  48.1   -2.1  -1.5225  -2.2    8.1	H1820-303
284.9562 -24.9355    9.3  42.8  -13.6   0.6147   1.3    4.4	HT1900.1-2455
288.8081  10.9442    0.5  11.4  -62.0   7.4452  24.6    0.6	GRS 1915+105
299.6094  35.1995    2.2  25.3 -144.1   1.6935   5.2    0.9	Cyg X-1
308.0637  41.1269   14.0  34.2 -145.6   0.3553   0.8   10.7	Cyg X-3
326.3090  38.3049    7.2  45.9 -132.7   1.7817   1.6    6.5	Cyg X-2
263.0931 -33.9582    5.0  53.7   10.6   3.1858   2.3    9.0	GX 354-0
239.8359  17.0201    3.4  37.5   89.4   3.7733   3.4 ------	UNKNOWN
245.3513  18.2019    2.2  32.2   90.6   3.7251   5.3 ------	UNKNOWN
268.3370  23.7797    3.2  11.9  117.6   1.1412   3.6 ------	UNKNOWN
286.5694  71.5135    3.5  54.2  177.0   4.2523   3.3 ------	UNKNOWN
303.5440  39.8085    3.0  30.7 -147.5   1.2951   3.9 ------	UNKNOWN
335.6099  50.0656    5.6  55.3 -145.3   5.0587   2.1 ------	UNKNOWN