Analysis Summary
Notes:
- 1) No attempt has been made to eliminate the non-significant decimal places.
- 2) This batgrbproduct analysis is done using the HEASARC data.
- 3) This batgrbproduct analysis is using the flight position for the mask-weighting calculation.
======================================================================
                  BAT GRB EVENT DATA PROCESSING REPORT
    Process Script Ver: batgrbproduct v2.46
    Process Start Time: Mon Jan 13 23:33:28 EST 2014
             Host Name: batevent1
   Current Working Dir: /local/data/batevent/batevent_reproc/trigger449542
======================================================================

  Trigger: 00449542      Segment: 000

  BAT Trigger Time: 322146866.368   [s; MET]
      Trigger Stop: 322146867.392   [s; MET]
               UTC: 2011-03-18T13:14:19.601160    [includes UTCF correction]
       Where From?: TDRSS position message

  BAT
    RA: 338.274381831747   Dec: -15.2822115542523  [deg; J2000]

     Catalogged Source?: NO
     Point Source?:      YES
     GRB Indicated?:     YES    [ by BAT flight software ]
     Image S/N Ratio:    16.94
     Image Trigger?:     NO
     Rate S/N Ratio:     41.194659848092  [ if not an image trigger ]
     Image S/N Ratio:    16.94

  Analysis Position:   [ source = BAT ]
    RA: 338.274381831747   Dec: -15.2822115542523  [deg; J2000]

  Refined Position:   [ source = BAT pre-slew burst ]
    RA: 338.291195629056   Dec: -15.2778466028388  [deg; J2000]
        { 22h 33m 09.9s , -15d 16' 40.2" }
         +/- 0.848138601613953 [arcmin] (estimated 90% radius based on SNR)
         +/- 0.277983595282066 [arcmin] (formal 1-sigma fit error)
    SNR: 38.4865181965621

  Angular difference between the analysis and refined position is 1.007790 arcmin

  Partial Coding Fraction: 0.2734375    [ including projection effects ]

  Duration
     T90: 15.9599999189377 +/- 1.6960849271487
        Measured from: -6.85999995470047
                   to: 9.09999996423721     [s; relative to TRIGTIME]
     T50: 4.92399996519089 +/- 0.295296446025789
        Measured from: 0.856000006198883
                   to: 5.77999997138977     [s; relative to TRIGTIME]


  Fluence
     Peak Flux  (peak 1 second)
        Measured from: 1.95200002193451
                   to: 2.95200002193451     [s; relative to TRIGTIME]
     Total Fluence
        Measured from: -12.9879999756813
                   to: 10.6040000319481     [s; relative to TRIGTIME]

             Band 1     Band 2     Band 3     Band 4
              15-25      25-50     50-100    100-350     keV
 Total     1.947306   2.974612   2.299857   0.479398
           0.062070   0.071184   0.065614   0.058348 [error]
 Peak      0.158802   0.357134   0.365609   0.080457
           0.014845   0.018720   0.018718   0.013888 [error]

     [ fluence units of on-axis counts / fully illuminated detector ]

======================================================================


====== Table of the duration information =============================

        Value   tstart    tstop
T100   23.592  -12.988   10.604
T90    15.960   -6.860    9.100
T50     4.924    0.856    5.780
Peak    1.000    1.952    2.952


====== Spectral Analysis Summary =====================================

Model      : spectral model: simple power-law (PL) and cutoff power-law (CPL)
Ph_index   : photon index: E^{Ph_index}
Ph_90err   : 90% error of the photon index
Epeak      : Epeak in keV
Epeak_90err: 90% error of Epeak
Norm       : normalization at 50 keV in both the PL model and CPL model
Nomr_90err : 90% error of the normalization
chi2       : Chi-Squared
dof        : degree of freedo

=== Time-averaged spectral analysis ===
(Best model with acceptable fit: CPL)

Model Ph_index Ph_90err_low Ph_90err_hi  Epeak  Epeak_90err_low  Epeak_90err_hi  Norm       Nomr_90err_low    Norm_90err_hi    chi2    dof
PL      -1.580    -0.054      0.054       -           -               -         2.31e-02     -7.01e-04          7.00e-04      58.310   57
CPL     -1.060    -0.229      0.241       94.647     -14.838        33.375      4.10e-02     -8.95e-03          1.22e-02      42.290   56


=== 1-s peak spectral analysis ===
(Best model with acceptable fit: CPL)

Model Ph_index Ph_90err_low Ph_90err_hi  Epeak  Epeak_90err_low  Epeak_90err_hi  Norm       Nomr_90err_low    Norm_90err_hi    chi2    dof
PL      -1.141     -0.088     0.089       -           -               -         6.90e-02     -3.91e-03          3.91e-03      62.100   57
CPL     -0.154     -0.400     0.439      104.324     -16.606        33.597      1.98e-01     -6.70e-02          1.12e-01      42.090   56


=== Fluence/Peak Flux Summary ===

              Model    Band1     Band2     Band3     Band4     Band5     Total
                       15-25     25-50    50-100    100-350    15-150    15-350    keV
Fluence         PL   7.49e-07  1.31e-06  1.76e-06  4.81e-06  5.11e-06  8.63e-06   erg/cm2
      90%_error_low -4.11e-08 -4.32e-08 -6.78e-08 -3.96e-07 -1.64e-07 -4.44e-07   erg/cm2
      90%_error_hi   4.19e-08  4.31e-08  6.77e-08  4.19e-07  1.64e-07  4.62e-07   erg/cm2
Peak flux       PL   4.41e-04  5.27e-03  5.68e-02  6.99e+00  2.50e-01  7.00e+00   ph/cm2/s
      90%_error_low     N/A       N/A       N/A       N/A       N/A       N/A     ph/cm2/s
      90%_error_hi      N/A       N/A       N/A       N/A       N/A       N/A     ph/cm2/s

Fluence        CPL   6.72e-07  1.36e-06  1.82e-06  2.46e-06  4.93e-06  6.32e-06   erg/cm2
      90%_error_low -5.11e-08 -4.96e-08 -7.55e-08 -5.72e-07 -1.82e-07 -5.95e-07   erg/cm2
      90%_error_hi   5.21e-08  5.00e-08  7.61e-08  7.86e-07  1.82e-07  7.93e-07   erg/cm2
Peak flux      CPL   1.61e+00  2.71e+00  2.58e+00  1.60e+00  7.87e+00  8.49e+00   ph/cm2/s
      90%_error_low -2.47e-01 -1.94e-01 -1.87e-01 -4.12e-01 -4.72e-01 -6.25e-01   ph/cm2/s
      90%_error_hi   2.56e-01  1.97e-01  1.90e-01  5.65e-01  4.73e-01  6.98e-01   ph/cm2/s

======================================================================
Image
Pre-slew 15.0-350.0 keV image (Event data)
#   RAcent    DECcent   POSerr    Theta     Phi              Peak Cts       SNR   Name
  338.2912   -15.2778   0.0050    38.1579  -120.5873         8.0844562     38.487 TRIG_00449542

Foreground time interval of the image:
-12.988  10.604 (delta_t =  23.592 [sec])
Background time interval of the image:
-119.368 -12.988 (delta_t = 106.380 [sec])
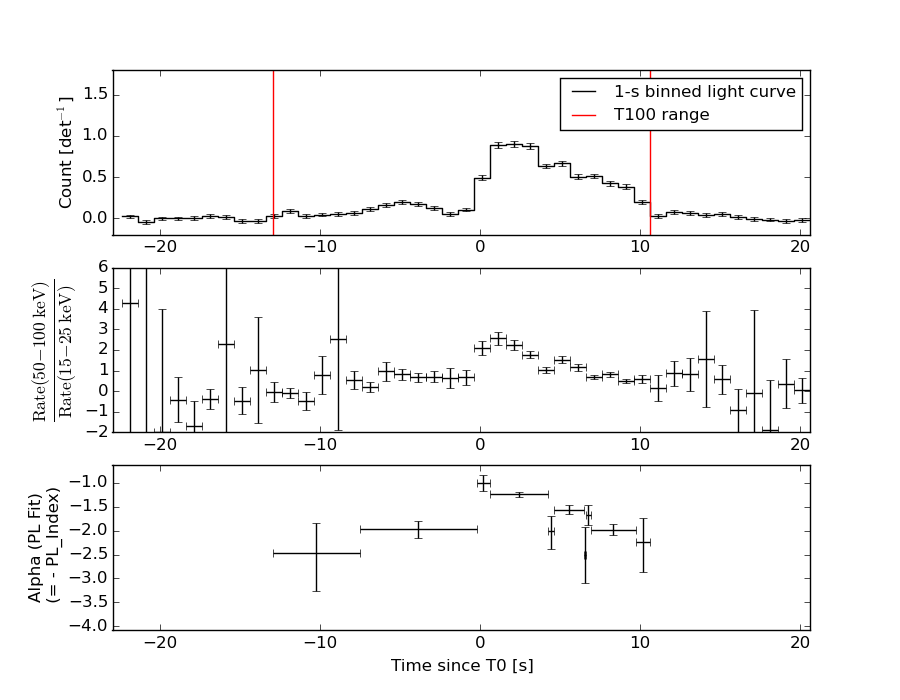
Light Curves
Note: The mask-weighted lightcurves have units of either count/det or counts/sec/det, where a det is 0.4 x 0.4 = 0.16 sq cm.
Full-time range; 1 s binning
Other quick-look light curves:
- 64 ms binning (zoomed)
- 16 ms binning (zoomed)
- 8 ms binning (zoomed)
- 2 ms binning (zoomed)
- SN=5 or 10 s binning (full-time range)
- Raw light curve
Spectra
- 64 ms binning (zoomed)
- 16 ms binning (zoomed)
- 8 ms binning (zoomed)
- 2 ms binning (zoomed)
- SN=5 or 10 s binning (full-time range)
- Raw light curve
Spectra
Notes:
- 1) The fitting includes the systematic errors.
- 2) When the burst includes telescope slew time periods, the fitting uses an average response file made from multiple 5-s response files through out the slew time plus single time preiod for the non-slew times, and weighted by the total counts in the corresponding time period using addrmf. An average response file is needed becuase a spectral fit using the pre-slew DRM will introduce some errors in both a spectral shape and a normalization if the PHA file contains a lot of the slew/post-slew time interval.
- 3) For fits to more complicated models (e.g. a power-law over a cutoff power-law), the BAT team has decided to require a chi-square improvement of more than 6 for each extra dof.
Time averaged spectrum fit using the average DRM
Power-law model
Time interval is from  -12.988 sec. to   10.604 sec.

Spectral model in power-law:
------------------------------------------------------------
Parameters  : value       lower 90%   higher 90%
Photon index: -1.57966     ( -0.0545001   0.0543272 )
Norm@50keV  : 2.30839E-02    ( -0.000700819   0.000700376 )
------------------------------------------------------------
#Fit statistic : Chi-Squared =          58.31 using 59 PHA bins.
# Reduced chi-squared =          1.023 for     57 degrees of freedom
# Null hypothesis probability =   4.271114e-01

Photon flux (15-150 keV)    in 23.59 sec: 2.94809 ( -0.09508  0.09528 ) ph/cm2/s
Energy fluence (15-150 keV)             : 5.10643e-06 ( -1.64032e-07  1.64384e-07 ) ergs/cm2
Cutoff power-law model
Time interval is from  -12.988 sec. to   10.604 sec.
Spectral model in the cutoff power-law:
------------------------------------------------------------
Parameters  : value       lower 90%   higher 90%
Photon index: -1.06002     ( -0.228541   0.240679 )
Epeak [keV] : 94.6468      ( -14.8381 33.3748 )
Norm@50keV  : 4.10066E-02    ( -0.00894939   0.0121905 )
------------------------------------------------------------
#Fit statistic : Chi-Squared =          42.29 using 59 PHA bins.
# Reduced chi-squared =         0.7553 for     56 degrees of freedom
# Null hypothesis probability =   9.122141e-01

Photon flux (15-150 keV)    in 23.59 sec: 2.85317 ( -0.10252  0.1028 ) ph/cm2/s
Energy fluence (15-150 keV)             : 4.92786e-06 ( -1.82401e-07  1.82108e-07 ) ergs/cm2
1-s peak spectrum fit
Power-law model
Time interval is from    1.952 sec. to    2.952 sec.

Spectral model in power-law:
------------------------------------------------------------
Parameters  : value       lower 90%   higher 90%
Photon index: -1.14082     ( -0.0881721   0.0886128 )
Norm@50keV  : 6.90058E-02    ( -0.00391032   0.00390986 )
------------------------------------------------------------
#Fit statistic : Chi-Squared =          62.10 using 59 PHA bins.
# Reduced chi-squared =          1.090 for     57 degrees of freedom
# Null hypothesis probability =   2.993223e-01

Photon flux (15-150 keV)    in 1 sec: 0.249722 (    ) ph/cm2/s
Energy fluence (15-150 keV)             : 7.12426e-07 ( -4.37588e-08  4.38669e-08 ) ergs/cm2
Cutoff power-law model
Time interval is from    1.952 sec. to    2.952 sec.
Spectral model in the cutoff power-law:
------------------------------------------------------------
Parameters  : value       lower 90%   higher 90%
Photon index: -0.153751     ( -0.399573   0.43872 )
Epeak [keV] : 104.324      ( -16.6057 33.5978 )
Norm@50keV  : 0.197971    ( -0.0670203   0.112108 )
------------------------------------------------------------
#Fit statistic : Chi-Squared =          42.09 using 59 PHA bins.
# Reduced chi-squared =         0.7516 for     56 degrees of freedom
# Null hypothesis probability =   9.159247e-01

Photon flux (15-150 keV)    in 1 sec: 7.86563 ( -0.47249  0.47261 ) ph/cm2/s
Energy fluence (15-150 keV)             : 6.90987e-07 ( -4.60311e-08  4.59664e-08 ) ergs/cm2
Time-resolved spectra
Distribution
T90 vs. Hardness ratio plot
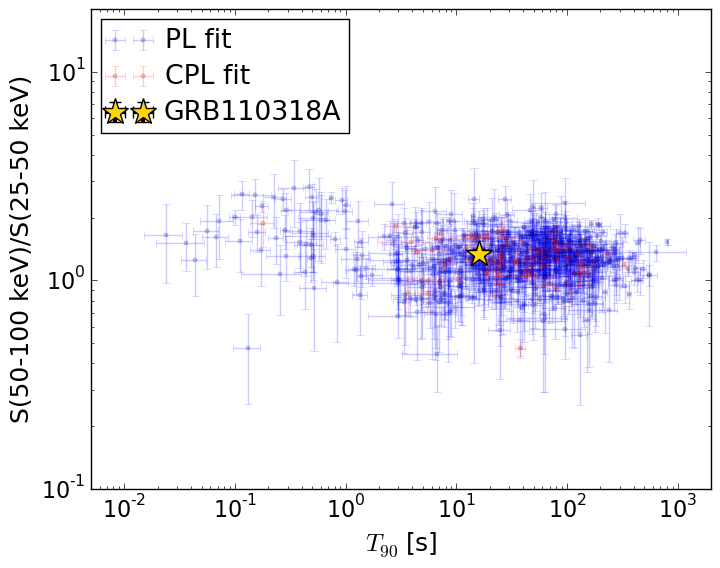
T90                                   = 15.96 sec.
Hardness ratio (energy fluence ratio) = 1.33330645989
S(15-50 keV) vs. S(50-150 keV) plot
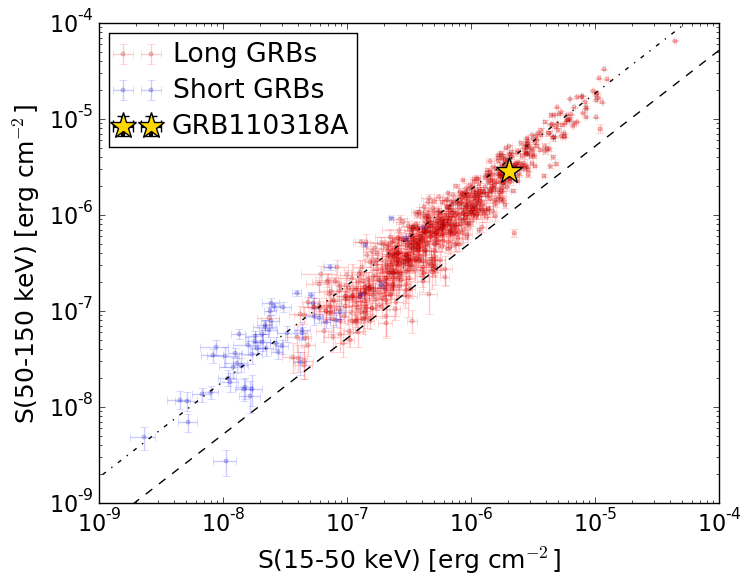
S(15-50 keV)  = 2.0365727e-06
S(50-150 keV) = 2.891297e-06
The dash-dotted line and the dashed line traces the fluences calculated from the Band function with Epeak = 15 and 150 keV, respectively. Both lines assume a canonical values of alpha = -1 and beta = -2.5.
Mask shadow pattern
IMX = -3.998211337545512E-01, IMY = 6.764018492904426E-01
Spacecraft aspect plot
Bright source in the pre-burst/pre-slew/post-slew images
Pre-burst image of 15-350 keV band
Time interval of the image:
-119.368000 -12.988000

# RAcent  DECcent POSerr Theta    Phi  PeakCts   SNR AngSep     Name
#  [deg]    [deg]    ['] [deg]  [deg]                   [']
295.6474 -28.0400    2.8  51.3 -178.1   2.8793   4.1 ------	UNKNOWN
325.3212 -35.5352    3.1  27.6 -160.0   1.0536   3.8 ------	UNKNOWN
 54.3635 -18.8135    4.0  54.4  -12.8   2.3929   2.9 ------	UNKNOWN
357.0201 -21.6230    2.8  28.4  -90.7   1.5780   4.1 ------	UNKNOWN
Pre-slew background subtracted image of 15-350 keV band
Time interval of the image:
-12.988000 10.604000

# RAcent  DECcent POSerr Theta    Phi  PeakCts   SNR AngSep     Name
#  [deg]    [deg]    ['] [deg]  [deg]                   [']
 79.1049 -47.7674    2.5  50.7   31.8   1.6849   4.6 ------	UNKNOWN
 75.3951 -45.5836    2.4  49.9   27.6   1.3677   4.7 ------	UNKNOWN
338.2912 -15.2778    0.3  38.2 -120.6   8.0845  38.5 ------	UNKNOWN
Post-slew image of 15-350 keV band
Time interval of the image:
317.332600 962.662000

# RAcent  DECcent POSerr Theta    Phi  PeakCts   SNR AngSep     Name
#  [deg]    [deg]    ['] [deg]  [deg]                   [']
 83.6300  22.0225    0.9  55.4    4.5  25.0710  12.4    0.5	Crab
135.5198 -40.6373    3.9  37.4  125.9   2.9582   3.0    5.0	Vela X-1
101.4164 -11.4698    2.8  24.4   41.0   1.8315   4.1 ------	UNKNOWN
161.6433 -78.4922    3.6  54.1  177.1   4.8547   3.2 ------	UNKNOWN
 73.7522 -35.7445    2.7  12.9  -95.2   1.7182   4.4 ------	UNKNOWN
 58.5543 -29.0967    2.7  26.4  -78.8   2.3858   4.2 ------	UNKNOWN
 57.0157 -38.4502    4.1  26.4 -100.1   1.5898   2.8 ------	UNKNOWN