Analysis Summary
Notes:
- 1) No attempt has been made to eliminate the non-significant decimal places.
- 2) This batgrbproduct analysis is done using the HEASARC data.
- 3) This batgrbproduct analysis is using the flight position for the mask-weighting calculation.
======================================================================
                  BAT GRB EVENT DATA PROCESSING REPORT
    Process Script Ver: batgrbproduct v2.46
    Process Start Time: Mon Jan 13 23:21:18 EST 2014
             Host Name: batevent1
   Current Working Dir: /local/data/batevent/batevent_reproc/trigger449578
======================================================================

  Trigger: 00449578      Segment: 000

  BAT Trigger Time: 322193808.384   [s; MET]
      Trigger Stop: 322193809.408   [s; MET]
               UTC: 2011-03-19T02:16:41.615380    [includes UTCF correction]
       Where From?: TDRSS position message

  BAT
    RA: 356.401203320955   Dec: -66.0171233760089  [deg; J2000]

     Catalogged Source?: NO
     Point Source?:      YES
     GRB Indicated?:     YES    [ by BAT flight software ]
     Image S/N Ratio:    7.06
     Image Trigger?:     NO
     Rate S/N Ratio:     12.1655250605964  [ if not an image trigger ]
     Image S/N Ratio:    7.06

  Analysis Position:   [ source = BAT ]
    RA: 356.401203320955   Dec: -66.0171233760089  [deg; J2000]

  Refined Position:   [ source = BAT pre-slew burst ]
    RA: 356.507489050582   Dec: -66.008348789258  [deg; J2000]
        { 23h 46m 01.8s , -66d 00' 30.1" }
         +/- 0.797350467285248 [arcmin] (estimated 90% radius based on SNR)
         +/- 0.236900467714755 [arcmin] (formal 1-sigma fit error)
    SNR: 42.0358125781118

  Angular difference between the analysis and refined position is 2.645439 arcmin

  Partial Coding Fraction: 1.015625    [ including projection effects ]

  Duration
     T90: 20.6799999475479 +/- 1.60441395332415
        Measured from: 1.99599999189377
                   to: 22.6759999394417     [s; relative to TRIGTIME]
     T50: 10.3719999790192 +/- 0.404474986949819
        Measured from: 5.31999999284744
                   to: 15.6919999718666     [s; relative to TRIGTIME]


  Fluence
     Peak Flux  (peak 1 second)
        Measured from: 13.1039999723434
                   to: 14.1039999723434     [s; relative to TRIGTIME]
     Total Fluence
        Measured from: -0.251999974250793
                   to: 31.0719999670982     [s; relative to TRIGTIME]

             Band 1     Band 2     Band 3     Band 4
              15-25      25-50     50-100    100-350     keV
 Total     1.674661   1.415216   0.416656   0.027770
           0.031839   0.031667   0.026652   0.022937 [error]
 Peak      0.125850   0.096399   0.029241   0.006560
           0.006637   0.006378   0.004995   0.004104 [error]

     [ fluence units of on-axis counts / fully illuminated detector ]

======================================================================


====== Table of the duration information =============================

        Value   tstart    tstop
T100   31.324   -0.252   31.072
T90    20.680    1.996   22.676
T50    10.372    5.320   15.692
Peak    1.000   13.104   14.104


====== Spectral Analysis Summary =====================================

Model      : spectral model: simple power-law (PL) and cutoff power-law (CPL)
Ph_index   : photon index: E^{Ph_index}
Ph_90err   : 90% error of the photon index
Epeak      : Epeak in keV
Epeak_90err: 90% error of Epeak
Norm       : normalization at 50 keV in both the PL model and CPL model
Nomr_90err : 90% error of the normalization
chi2       : Chi-Squared
dof        : degree of freedo

=== Time-averaged spectral analysis ===
(Best model with acceptable fit: N/A)

Model Ph_index Ph_90err_low Ph_90err_hi  Epeak  Epeak_90err_low  Epeak_90err_hi  Norm       Nomr_90err_low    Norm_90err_hi    chi2    dof
PL      -2.551    -0.079      0.077       -           -               -         5.04e-03     -2.36e-04          2.34e-04      84.010   57
CPL     -1.375    -0.407      0.448       21.035      -9.980         5.450      2.40e-02     -9.97e-03          1.97e-02      54.840   56


=== 1-s peak spectral analysis ===
(Best model with acceptable fit: PL)

Model Ph_index Ph_90err_low Ph_90err_hi  Epeak  Epeak_90err_low  Epeak_90err_hi  Norm       Nomr_90err_low    Norm_90err_hi    chi2    dof
PL      -2.601     -0.178     0.168       -           -               -         1.05e-02     -1.32e-03          1.32e-03      55.900   57
CPL     -1.643     -0.350     1.130       12.824      N/A           N/A         4.31e-02        N/A               N/A         52.090   56


=== Fluence/Peak Flux Summary ===

              Model    Band1     Band2     Band3     Band4     Band5     Total
                       15-25     25-50    50-100    100-350    15-150    15-350    keV
Fluence         PL   5.47e-07  5.34e-07  3.65e-07  3.91e-07  1.60e-06  1.84e-06   erg/cm2
      90%_error_low -2.98e-08 -1.83e-08 -2.40e-08 -4.97e-08 -5.65e-08 -7.85e-08   erg/cm2
      90%_error_hi   3.03e-08  1.83e-08  2.44e-08  5.47e-08  5.66e-08  8.10e-08   erg/cm2
Peak flux       PL   1.25e+00  6.64e-01  2.19e-01  9.32e-02  2.19e+00  2.23e+00   ph/cm2/s
      90%_error_low -1.28e-01 -5.49e-02 -3.59e-02 -2.55e-02 -1.69e-01 -1.71e-01   ph/cm2/s
      90%_error_hi   1.31e-01  5.45e-02  3.76e-02  3.15e-02  1.69e-01  1.71e-01   ph/cm2/s

Fluence        CPL   4.76e-07  5.79e-07  3.18e-07  7.30e-08  1.43e-06  1.45e-06   erg/cm2
      90%_error_low -3.68e-08 -2.34e-08 -3.25e-08 -2.97e-08 -7.08e-08 -7.84e-08   erg/cm2
      90%_error_hi   3.73e-08  2.36e-08  3.18e-08  4.79e-08  7.32e-08  8.93e-08   erg/cm2
Peak flux      CPL   1.19e+00  7.22e-01  1.83e-01  2.05e-02  2.12e+00  2.12e+00   ph/cm2/s
      90%_error_low -1.42e-01 -7.01e-02 -5.71e-02     N/A   -1.79e-01 -1.81e-01   ph/cm2/s
      90%_error_hi   1.40e-01  7.63e-02  5.16e-02     N/A    1.78e-01  1.78e-01   ph/cm2/s

======================================================================
Image
Pre-slew 15.0-350.0 keV image (Event data)
#   RAcent    DECcent   POSerr    Theta     Phi              Peak Cts       SNR   Name
  356.5075   -66.0083   0.0046     9.1476  -122.2227         1.6000691     42.036 TRIG_00449578

Foreground time interval of the image:
 -0.252  10.917 (delta_t =  11.169 [sec])
Background time interval of the image:
-236.683  -0.252 (delta_t = 236.431 [sec])
Light Curves
Note: The mask-weighted lightcurves have units of either count/det or counts/sec/det, where a det is 0.4 x 0.4 = 0.16 sq cm.
Full-time range; 1 s binning
Other quick-look light curves:
- 64 ms binning (zoomed)
- 16 ms binning (zoomed)
- 8 ms binning (zoomed)
- 2 ms binning (zoomed)
- SN=5 or 10 s binning (full-time range)
- Raw light curve
Spectra
- 64 ms binning (zoomed)
- 16 ms binning (zoomed)
- 8 ms binning (zoomed)
- 2 ms binning (zoomed)
- SN=5 or 10 s binning (full-time range)
- Raw light curve
Spectra
Notes:
- 1) The fitting includes the systematic errors.
- 2) When the burst includes telescope slew time periods, the fitting uses an average response file made from multiple 5-s response files through out the slew time plus single time preiod for the non-slew times, and weighted by the total counts in the corresponding time period using addrmf. An average response file is needed becuase a spectral fit using the pre-slew DRM will introduce some errors in both a spectral shape and a normalization if the PHA file contains a lot of the slew/post-slew time interval.
- 3) For fits to more complicated models (e.g. a power-law over a cutoff power-law), the BAT team has decided to require a chi-square improvement of more than 6 for each extra dof.
Time averaged spectrum fit using the average DRM
Power-law model
Time interval is from   -0.252 sec. to   31.072 sec.

Spectral model in power-law:
------------------------------------------------------------
Parameters  : value       lower 90%   higher 90%
Photon index: -2.55061     ( -0.0787472   0.0772689 )
Norm@50keV  : 5.04302E-03    ( -0.000235621   0.000234254 )
------------------------------------------------------------
#Fit statistic : Chi-Squared =          84.01 using 59 PHA bins.
# Reduced chi-squared =          1.474 for     57 degrees of freedom
# Null hypothesis probability =   1.147416e-02

Photon flux (15-150 keV)    in 31.32 sec: 1.02237 ( -0.038851  0.03908 ) ph/cm2/s
Energy fluence (15-150 keV)             : 1.60229e-06 ( -5.64634e-08  5.66122e-08 ) ergs/cm2
Cutoff power-law model
Time interval is from   -0.252 sec. to   31.072 sec.
Spectral model in the cutoff power-law:
------------------------------------------------------------
Parameters  : value       lower 90%   higher 90%
Photon index: -1.37548     ( -0.40654   0.448084 )
Epeak [keV] : 21.0352      ( -9.98031 5.44973 )
Norm@50keV  : 2.40307E-02    ( -0.00997434   0.0197388 )
------------------------------------------------------------
#Fit statistic : Chi-Squared =          54.84 using 59 PHA bins.
# Reduced chi-squared =         0.9793 for     56 degrees of freedom
# Null hypothesis probability =   5.188601e-01

Photon flux (15-150 keV)    in 31.32 sec: 0.996266 (    ) ph/cm2/s
Energy fluence (15-150 keV)             : 1.43219e-06 ( -7.08386e-08  7.32393e-08 ) ergs/cm2
1-s peak spectrum fit
Power-law model
Time interval is from   13.104 sec. to   14.104 sec.

Spectral model in power-law:
------------------------------------------------------------
Parameters  : value       lower 90%   higher 90%
Photon index: -2.60093     ( -0.178374   0.168388 )
Norm@50keV  : 1.04540E-02    ( -0.00132476   0.00131844 )
------------------------------------------------------------
#Fit statistic : Chi-Squared =          55.90 using 59 PHA bins.
# Reduced chi-squared =         0.9806 for     57 degrees of freedom
# Null hypothesis probability =   5.165443e-01

Photon flux (15-150 keV)    in 1 sec: 2.18786 ( -0.16919  0.16927 ) ph/cm2/s
Energy fluence (15-150 keV)             : 1.07664e-07 ( -9.58636e-09  9.77707e-09 ) ergs/cm2
Cutoff power-law model
Time interval is from   13.104 sec. to   14.104 sec.
Spectral model in the cutoff power-law:
------------------------------------------------------------
Parameters  : value       lower 90%   higher 90%
Photon index: -1.643     ( -0.350882   1.12976 )
Epeak [keV] : 12.8240      (   )
Norm@50keV  : 4.31391E-02    (     )
------------------------------------------------------------
#Fit statistic : Chi-Squared =          52.09 using 59 PHA bins.
# Reduced chi-squared =         0.9302 for     56 degrees of freedom
# Null hypothesis probability =   6.235253e-01

Photon flux (15-150 keV)    in 1 sec: 2.11585 ( -0.17907  0.17831 ) ph/cm2/s
Energy fluence (15-150 keV)             : 0 ( 0  0 ) ergs/cm2
Time-resolved spectra
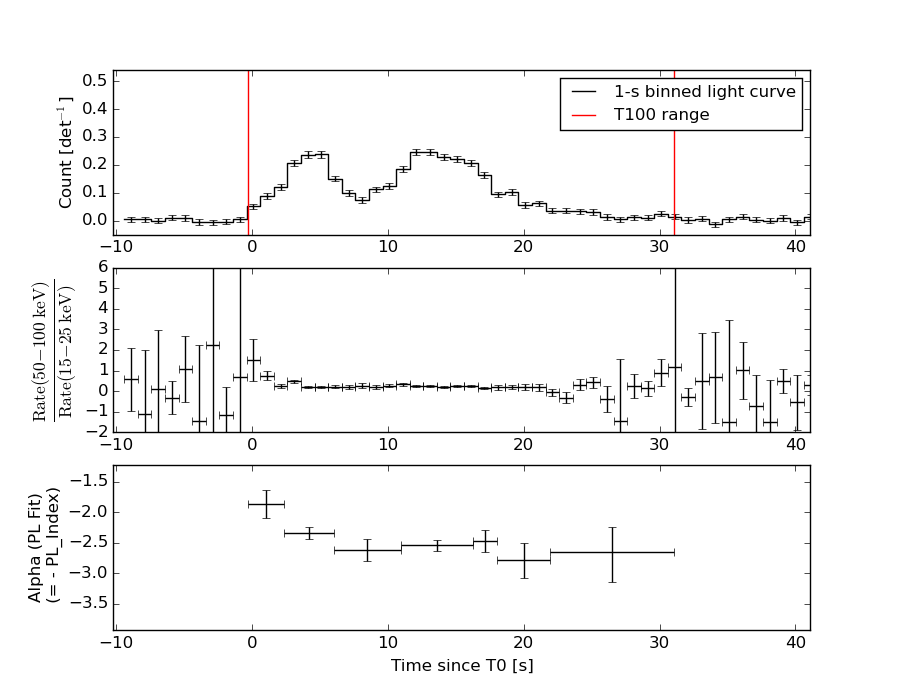
Distribution
T90 vs. Hardness ratio plot
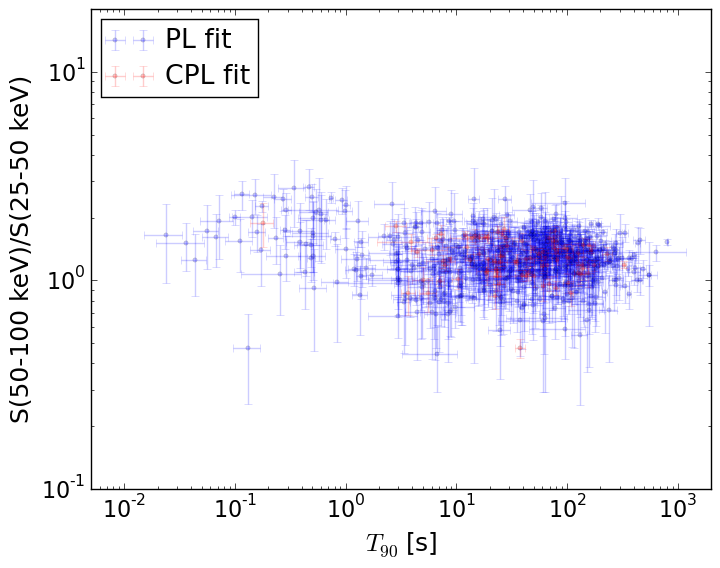
T90                                   = N/A sec.
Hardness ratio (energy fluence ratio) = N/A
S(15-50 keV) vs. S(50-150 keV) plot
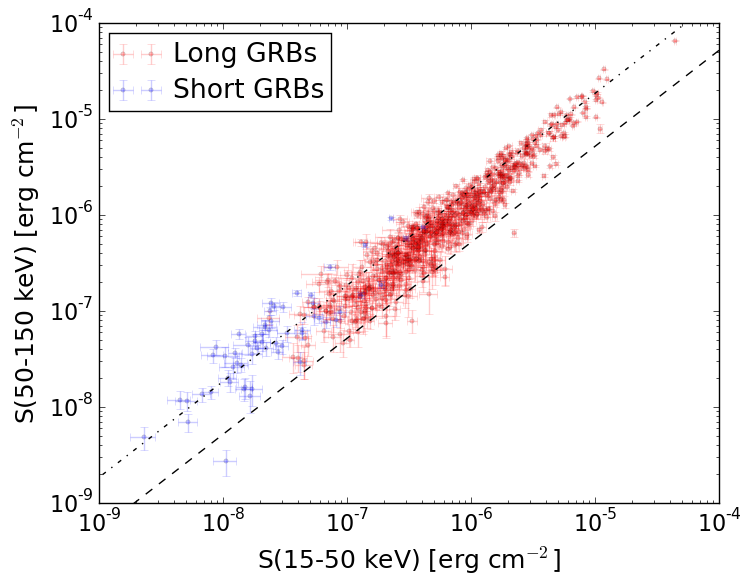
S(15-50 keV)  = N/A
S(50-150 keV) = N/A
The dash-dotted line and the dashed line traces the fluences calculated from the Band function with Epeak = 15 and 150 keV, respectively. Both lines assume a canonical values of alpha = -1 and beta = -2.5.
Mask shadow pattern
IMX = -8.586079636805807E-02, IMY = 1.362249670017142E-01
Spacecraft aspect plot

Bright source in the pre-burst/pre-slew/post-slew images
Pre-burst image of 15-350 keV band
Time interval of the image:
-236.683400 -0.252000

# RAcent  DECcent POSerr Theta    Phi  PeakCts   SNR AngSep     Name
#  [deg]    [deg]    ['] [deg]  [deg]                   [']
264.6184 -44.4627   21.9  54.1  171.5   0.4187   0.5    5.4	4U 1735-44
222.7819 -58.8347    2.6  47.8  134.8   3.3466   4.4 ------	UNKNOWN
230.8314 -65.6043    2.8  40.4  137.8   1.8019   4.1 ------	UNKNOWN
 62.2034 -19.7997    2.3  58.5  -10.7   4.9102   5.1 ------	UNKNOWN
 56.3209 -20.4417    3.0  56.4  -16.9   2.5467   3.8 ------	UNKNOWN
 50.4025 -16.6144    2.7  58.9  -24.4   4.9335   4.2 ------	UNKNOWN
Pre-slew background subtracted image of 15-350 keV band
Time interval of the image:
-0.252000 10.916590

# RAcent  DECcent POSerr Theta    Phi  PeakCts   SNR AngSep     Name
#  [deg]    [deg]    ['] [deg]  [deg]                   [']
264.8815 -44.5216   10.2  54.0  171.7   0.1804   1.1    7.3	4U 1735-44
356.5075 -66.0084    0.3   9.1 -122.2   1.6001  42.1 ------	UNKNOWN
345.2151 -41.3026    2.0  34.2 -106.7   0.3931   5.9 ------	UNKNOWN
Post-slew image of 15-350 keV band
Time interval of the image:
43.916600 232.265900
233.616000 395.716600

# RAcent  DECcent POSerr Theta    Phi  PeakCts   SNR AngSep     Name
#  [deg]    [deg]    ['] [deg]  [deg]                   [']
264.7839 -44.3176    6.3  50.9  155.2   1.8199   1.8    8.1	4U 1735-44