Analysis Summary
Notes:
- 1) No attempt has been made to eliminate the non-significant decimal places.
- 2) This batgrbproduct analysis is done using the HEASARC data.
- 3) This batgrbproduct analysis is using the flight position for the mask-weighting calculation.
======================================================================
                  BAT GRB EVENT DATA PROCESSING REPORT
    Process Script Ver: batgrbproduct v2.46
    Process Start Time: Mon Jan 13 23:09:28 EST 2014
             Host Name: batevent1
   Current Working Dir: /local/data/batevent/batevent_reproc/trigger451165
======================================================================

  Trigger: 00451165      Segment: 000

  BAT Trigger Time: 324243258.688   [s; MET]
      Trigger Stop: 324243259.712   [s; MET]
               UTC: 2011-04-11T19:34:11.842080    [includes UTCF correction]
       Where From?: TDRSS position message

  BAT
    RA: 291.436981024355   Dec: 67.7320243410843  [deg; J2000]

     Catalogged Source?: NO
     Point Source?:      YES
     GRB Indicated?:     YES    [ by BAT flight software ]
     Image S/N Ratio:    6.94
     Image Trigger?:     NO
     Rate S/N Ratio:     12  [ if not an image trigger ]
     Image S/N Ratio:    6.94

  Analysis Position:   [ source = BAT ]
    RA: 291.436981024355   Dec: 67.7320243410843  [deg; J2000]

  Refined Position:   [ source = BAT pre-slew burst ]
    RA: 291.448880720844   Dec: 67.7042292570359  [deg; J2000]
        { 19h 25m 47.7s , +67d 42' 15.2" }
         +/- 0.72842527514196 [arcmin] (estimated 90% radius based on SNR)
         +/- 0.250003935088861 [arcmin] (formal 1-sigma fit error)
    SNR: 47.8311945925477

  Angular difference between the analysis and refined position is 1.689535 arcmin

  Partial Coding Fraction: 0.71875    [ including projection effects ]

  Duration
     T90: 79.3999999761581 +/- 5.2503505399316
        Measured from: -7.60000002384186
                   to: 71.7999999523163     [s; relative to TRIGTIME]
     T50: 51.5479999184608 +/- 2.48366266590847
        Measured from: 4.7960000038147
                   to: 56.3439999222755     [s; relative to TRIGTIME]


  Fluence
     Peak Flux  (peak 1 second)
        Measured from: 4.73199999332428
                   to: 5.73199999332428     [s; relative to TRIGTIME]
     Total Fluence
        Measured from: -16.9120000004768
                   to: 86.3079999685287     [s; relative to TRIGTIME]

             Band 1     Band 2     Band 3     Band 4
              15-25      25-50     50-100    100-350     keV
 Total     2.406938   2.666229   1.243051   0.175174
           0.063754   0.065769   0.057413   0.049112 [error]
 Peak      0.053618   0.067981   0.040806  -0.000156
           0.006773   0.007182   0.006337   0.005123 [error]

     [ fluence units of on-axis counts / fully illuminated detector ]

======================================================================


====== Table of the duration information =============================

        Value   tstart    tstop
T100  103.220  -16.912   86.308
T90    79.400   -7.600   71.800
T50    51.548    4.796   56.344
Peak    1.000    4.732    5.732


====== Spectral Analysis Summary =====================================

Model      : spectral model: simple power-law (PL) and cutoff power-law (CPL)
Ph_index   : photon index: E^{Ph_index}
Ph_90err   : 90% error of the photon index
Epeak      : Epeak in keV
Epeak_90err: 90% error of Epeak
Norm       : normalization at 50 keV in both the PL model and CPL model
Nomr_90err : 90% error of the normalization
chi2       : Chi-Squared
dof        : degree of freedo

=== Time-averaged spectral analysis ===
(Best model with acceptable fit: CPL)

Model Ph_index Ph_90err_low Ph_90err_hi  Epeak  Epeak_90err_low  Epeak_90err_hi  Norm       Nomr_90err_low    Norm_90err_hi    chi2    dof
PL      -2.040    -0.071      0.070       -           -               -         3.65e-03     -1.45e-04          1.44e-04      57.300   57
CPL     -1.498    -0.302      0.326       41.916      -9.060         6.999      7.10e-03     -2.16e-03          3.45e-03      47.350   56


=== 1-s peak spectral analysis ===
(Best model with acceptable fit: PL)

Model Ph_index Ph_90err_low Ph_90err_hi  Epeak  Epeak_90err_low  Epeak_90err_hi  Norm       Nomr_90err_low    Norm_90err_hi    chi2    dof
PL      -1.732     -0.221     0.211       -           -               -         9.92e-03     -1.44e-03          1.41e-03      61.040   57
CPL     -0.790     -0.876     1.129       56.837     -13.859       121.510      3.32e-02     -3.32e-02          1.09e-01      57.600   56


=== Fluence/Peak Flux Summary ===

              Model    Band1     Band2     Band3     Band4     Band5     Total
                       15-25     25-50    50-100    100-350    15-150    15-350    keV
Fluence         PL   8.01e-07  1.06e-06  1.03e-06  1.79e-06  3.48e-06  4.68e-06   erg/cm2
      90%_error_low -4.65e-08 -3.71e-08 -5.74e-08 -2.02e-07 -1.30e-07 -2.54e-07   erg/cm2
      90%_error_hi   4.74e-08  3.71e-08  5.76e-08  2.19e-07  1.31e-07  2.66e-07   erg/cm2
Peak flux       PL   5.11e-01  4.48e-01  2.70e-01  2.45e-01  1.33e+00  1.47e+00   ph/cm2/s
      90%_error_low -9.26e-02 -5.64e-02 -5.01e-02 -7.78e-02 -1.68e-01 -1.89e-01   ph/cm2/s
      90%_error_hi   9.62e-02  5.64e-02  5.03e-02  9.68e-02  1.68e-01  1.91e-01   ph/cm2/s

Fluence        CPL   7.36e-07  1.11e-06  1.02e-06  7.93e-07  3.30e-06  3.66e-06   erg/cm2
      90%_error_low -5.71e-08 -4.56e-08 -6.30e-08 -2.65e-07 -1.62e-07 -3.20e-07   erg/cm2
      90%_error_hi   5.79e-08  4.62e-08  6.24e-08  4.21e-07  1.63e-07  4.56e-07   erg/cm2
Peak flux      CPL   4.58e-01  4.99e-01  2.75e-01  8.33e-02  1.29e+00  1.32e+00   ph/cm2/s
      90%_error_low -1.08e-01 -7.38e-02 -5.93e-02 -8.33e-02 -1.71e-01 -1.84e-01   ph/cm2/s
      90%_error_hi   1.09e-01  7.76e-02  5.77e-02  1.45e-01  1.71e-01  2.05e-01   ph/cm2/s

======================================================================
Image
Pre-slew 15.0-350.0 keV image (Event data)
#   RAcent    DECcent   POSerr    Theta     Phi              Peak Cts       SNR   Name
  291.4489    67.7042   0.0040    20.5684   -88.2754         6.2194634     47.831 TRIG_00451165

Foreground time interval of the image:
-16.912  71.613 (delta_t =  88.525 [sec])
Background time interval of the image:
-239.688 -16.912 (delta_t = 222.776 [sec])
Light Curves
Note: The mask-weighted lightcurves have units of either count/det or counts/sec/det, where a det is 0.4 x 0.4 = 0.16 sq cm.
Full-time range; 1 s binning
Other quick-look light curves:
- 64 ms binning (zoomed)
- 16 ms binning (zoomed)
- 8 ms binning (zoomed)
- 2 ms binning (zoomed)
- SN=5 or 10 s binning (full-time range)
- Raw light curve
Spectra
- 64 ms binning (zoomed)
- 16 ms binning (zoomed)
- 8 ms binning (zoomed)
- 2 ms binning (zoomed)
- SN=5 or 10 s binning (full-time range)
- Raw light curve
Spectra
Notes:
- 1) The fitting includes the systematic errors.
- 2) When the burst includes telescope slew time periods, the fitting uses an average response file made from multiple 5-s response files through out the slew time plus single time preiod for the non-slew times, and weighted by the total counts in the corresponding time period using addrmf. An average response file is needed becuase a spectral fit using the pre-slew DRM will introduce some errors in both a spectral shape and a normalization if the PHA file contains a lot of the slew/post-slew time interval.
- 3) For fits to more complicated models (e.g. a power-law over a cutoff power-law), the BAT team has decided to require a chi-square improvement of more than 6 for each extra dof.
Time averaged spectrum fit using the average DRM
Power-law model
Time interval is from  -16.912 sec. to   86.308 sec.

Spectral model in power-law:
------------------------------------------------------------
Parameters  : value       lower 90%   higher 90%
Photon index: -2.04046     ( -0.0709526   0.0699787 )
Norm@50keV  : 3.64844E-03    ( -0.00014537   0.000144445 )
------------------------------------------------------------
#Fit statistic : Chi-Squared =          57.30 using 59 PHA bins.
# Reduced chi-squared =          1.005 for     57 degrees of freedom
# Null hypothesis probability =   4.639713e-01

Photon flux (15-150 keV)    in 103.2 sec: 0.557744 ( -0.020754  0.020825 ) ph/cm2/s
Energy fluence (15-150 keV)             : 3.48152e-06 ( -1.30329e-07  1.30908e-07 ) ergs/cm2
Cutoff power-law model
Time interval is from  -16.912 sec. to   86.308 sec.
Spectral model in the cutoff power-law:
------------------------------------------------------------
Parameters  : value       lower 90%   higher 90%
Photon index: -1.49753     ( -0.302029   0.326247 )
Epeak [keV] : 41.9165      ( -9.06014 6.99931 )
Norm@50keV  : 7.09708E-03    ( -0.00215705   0.00344701 )
------------------------------------------------------------
#Fit statistic : Chi-Squared =          47.35 using 59 PHA bins.
# Reduced chi-squared =         0.8455 for     56 degrees of freedom
# Null hypothesis probability =   7.881714e-01

Photon flux (15-150 keV)    in 103.2 sec: 0.536018 ( -0.023611  0.023727 ) ph/cm2/s
Energy fluence (15-150 keV)             : 3.29541e-06 ( -1.61625e-07  1.62942e-07 ) ergs/cm2
1-s peak spectrum fit
Power-law model
Time interval is from    4.732 sec. to    5.732 sec.

Spectral model in power-law:
------------------------------------------------------------
Parameters  : value       lower 90%   higher 90%
Photon index: -1.73248     ( -0.220727   0.210717 )
Norm@50keV  : 9.91937E-03    ( -0.00144132   0.00141378 )
------------------------------------------------------------
#Fit statistic : Chi-Squared =          61.04 using 59 PHA bins.
# Reduced chi-squared =          1.071 for     57 degrees of freedom
# Null hypothesis probability =   3.329382e-01

Photon flux (15-150 keV)    in 1 sec: 1.33277 ( -0.16752  0.16754 ) ph/cm2/s
Energy fluence (15-150 keV)             : 9.1641e-08 ( -1.36813e-08  1.39629e-08 ) ergs/cm2
Cutoff power-law model
Time interval is from    4.732 sec. to    5.732 sec.
Spectral model in the cutoff power-law:
------------------------------------------------------------
Parameters  : value       lower 90%   higher 90%
Photon index: -0.789972     ( -0.876066   1.12907 )
Epeak [keV] : 56.8369      ( -13.8586 121.51 )
Norm@50keV  : 3.31853E-02    ( -0.0331853   0.109089 )
------------------------------------------------------------
#Fit statistic : Chi-Squared =          57.60 using 59 PHA bins.
# Reduced chi-squared =          1.029 for     56 degrees of freedom
# Null hypothesis probability =   4.159315e-01

Photon flux (15-150 keV)    in 1 sec: 1.29381 ( -0.17137  0.17136 ) ph/cm2/s
Energy fluence (15-150 keV)             : 8.44559e-08 ( -1.46005e-08  1.53256e-08 ) ergs/cm2
Time-resolved spectra
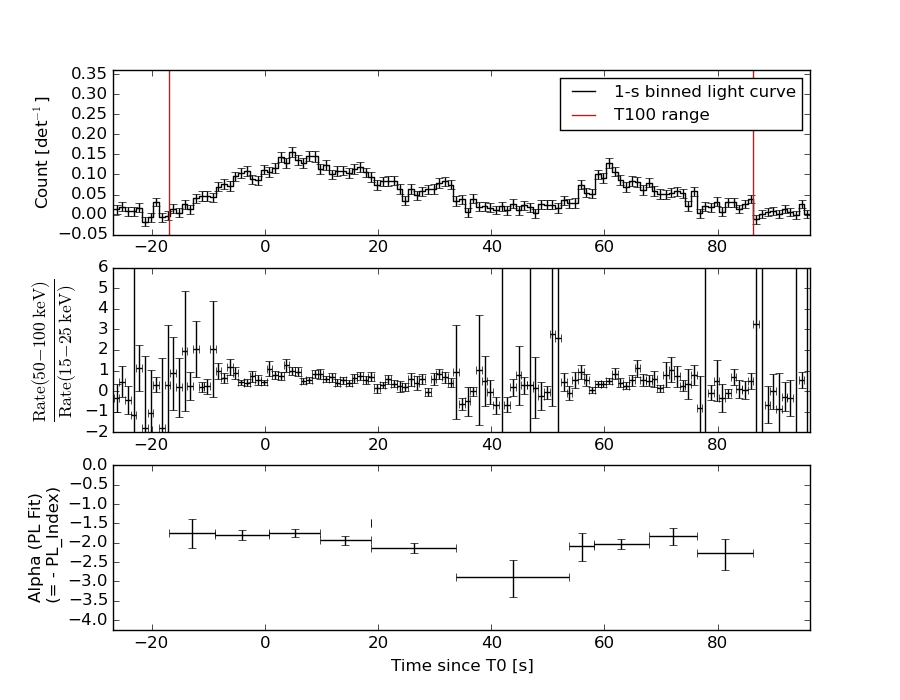
Distribution
T90 vs. Hardness ratio plot
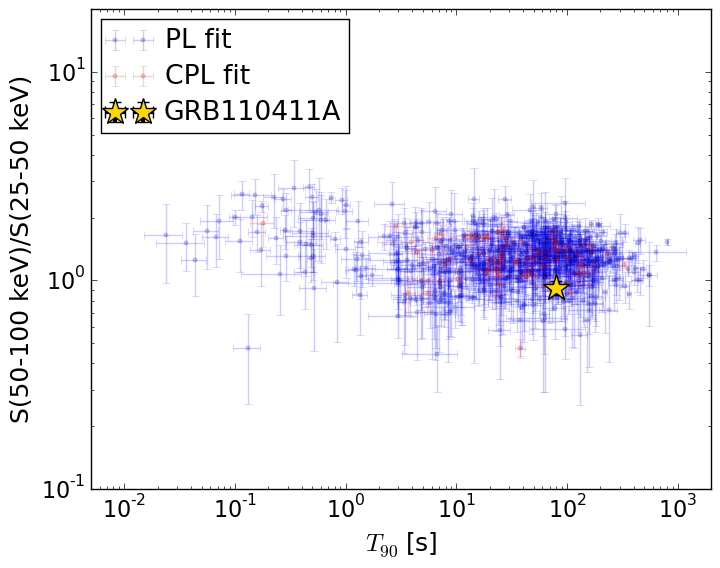
T90                                   = 79.4 sec.
Hardness ratio (energy fluence ratio) = 0.921679553985
S(15-50 keV) vs. S(50-150 keV) plot
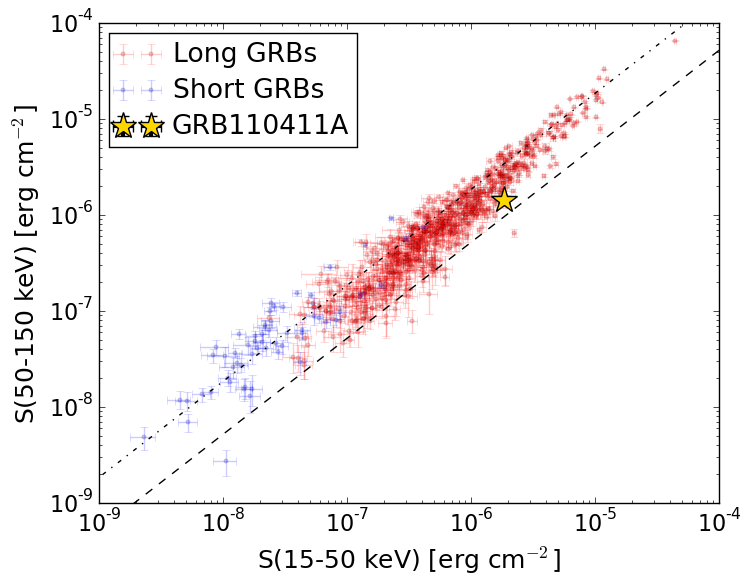
S(15-50 keV)  = 1.845252e-06
S(50-150 keV) = 1.4501901e-06
The dash-dotted line and the dashed line traces the fluences calculated from the Band function with Epeak = 15 and 150 keV, respectively. Both lines assume a canonical values of alpha = -1 and beta = -2.5.
Mask shadow pattern
IMX = 1.129350651745802E-02, IMY = 3.750767460257233E-01
Spacecraft aspect plot
Bright source in the pre-burst/pre-slew/post-slew images
Pre-burst image of 15-350 keV band
Time interval of the image:
-239.688000 -16.912000

# RAcent  DECcent POSerr Theta    Phi  PeakCts   SNR AngSep     Name
#  [deg]    [deg]    ['] [deg]  [deg]                   [']
254.4473  35.2616   14.8  22.4   40.6  -0.1594  -0.8    4.9	Her X-1
288.7683  10.9500    3.9  54.7    0.4   2.0101   2.9    1.8	GRS 1915+105
299.5295  35.1884    3.1  38.9  -28.7   0.9909   3.6    3.1	Cyg X-1
308.1612  40.9463    3.1  39.3  -42.8   1.0959   3.7    2.3	Cyg X-3
250.4528  47.2924    2.9  10.3   50.5   0.6499   4.0 ------	UNKNOWN
288.7285  13.9804    2.5  51.9   -1.1   2.0878   4.5 ------	UNKNOWN
143.5470  50.3880    2.4  56.9 -179.0   5.0512   4.8 ------	UNKNOWN
260.5675  57.0773    3.7   5.1  -41.0   0.5194   3.1 ------	UNKNOWN
 97.2209  65.6600    5.1  55.2 -145.2   3.0170   2.3 ------	UNKNOWN
Pre-slew background subtracted image of 15-350 keV band
Time interval of the image:
-16.912000 71.612620

# RAcent  DECcent POSerr Theta    Phi  PeakCts   SNR AngSep     Name
#  [deg]    [deg]    ['] [deg]  [deg]                   [']
254.4932  35.5111  154.0  22.2   40.5  -0.0102  -0.1   10.3	Her X-1
288.7329  10.8773   18.1  54.7    0.5   0.3267   0.6    5.6	GRS 1915+105
299.4263  35.3075    6.9  38.8  -28.7  -0.3038  -1.7   10.2	Cyg X-1
307.9224  40.8471   10.5  39.2  -42.5   0.2193   1.1   10.6	Cyg X-3
183.0235  36.5402    2.3  48.5  142.7   2.7107   5.1 ------	UNKNOWN
281.1123  23.9714    2.5  39.8    2.2   0.8449   4.5 ------	UNKNOWN
291.4488  67.7042    0.2  20.6  -88.3   6.2196  47.8 ------	UNKNOWN
320.5872  65.5945    2.1  32.1  -85.9   1.0554   5.5 ------	UNKNOWN
Post-slew image of 15-350 keV band
Time interval of the image:
115.612580 962.416100

# RAcent  DECcent POSerr Theta    Phi  PeakCts   SNR AngSep     Name
#  [deg]    [deg]    ['] [deg]  [deg]                   [']
254.4614  35.3097   20.6  38.5   54.0  -0.6251  -0.6    2.0	Her X-1
299.5658  35.2064    1.1  32.8  -10.3   5.3631  10.2    1.2	Cyg X-1
308.1146  40.9417    1.0  28.3  -25.2   5.1288  11.0    0.7	Cyg X-3
326.0633  38.4470    4.9  35.0  -49.0   1.5056   2.3    9.1	Cyg X-2
119.2565  57.9702    3.9  54.2  176.9   5.6574   2.9 ------	UNKNOWN
308.0714  37.5997    2.3  31.5  -23.7   2.4078   5.0 ------	UNKNOWN