Analysis Summary
Notes:
- 1) No attempt has been made to eliminate the non-significant decimal places.
- 2) This batgrbproduct analysis is done using the HEASARC data.
- 3) This batgrbproduct analysis is using the flight position for the mask-weighting calculation.
======================================================================
                  BAT GRB EVENT DATA PROCESSING REPORT
    Process Script Ver: batgrbproduct v2.46
    Process Start Time: Mon Jan 13 22:58:46 EST 2014
             Host Name: batevent1
   Current Working Dir: /local/data/batevent/batevent_reproc/trigger451343
======================================================================

  Trigger: 00451343      Segment: 000

  BAT Trigger Time: 324459741.376   [s; MET]
      Trigger Stop: 324459757.76   [s; MET]
               UTC: 2011-04-14T07:42:14.521920    [includes UTCF correction]
       Where From?: TDRSS position message

  BAT
    RA: 97.8758670233519   Dec: 24.3609952759365  [deg; J2000]

     Catalogged Source?: NO
     Point Source?:      YES
     GRB Indicated?:     YES    [ by BAT flight software ]
     Image S/N Ratio:    10
     Image Trigger?:     NO
     Rate S/N Ratio:     13.3790881602597  [ if not an image trigger ]
     Image S/N Ratio:    10

  Analysis Position:   [ source = BAT ]
    RA: 97.8758670233519   Dec: 24.3609952759365  [deg; J2000]

  Refined Position:   [ source = BAT pre-slew burst ]
    RA: 97.8780335995555   Dec: 24.3487336332375  [deg; J2000]
        { 06h 31m 30.7s , +24d 20' 55.4" }
         +/- 1.59633032780149 [arcmin] (estimated 90% radius based on SNR)
         +/- 0.686442713352744 [arcmin] (formal 1-sigma fit error)
    SNR: 15.5934783602918

  Angular difference between the analysis and refined position is 0.745169 arcmin

  Partial Coding Fraction: 0.3007812    [ including projection effects ]

  Duration
     T90: 153.115999937057 +/- 68.9857965812378
        Measured from: -34.3319999575615
                   to: 118.783999979496     [s; relative to TRIGTIME]
     T50: 31.135999917984 +/- 6.25309042539175
        Measured from: -6.51999998092651
                   to: 24.6159999370575     [s; relative to TRIGTIME]


  Fluence
     Peak Flux  (peak 1 second)
        Measured from: 8.7039999961853
                   to: 9.7039999961853     [s; relative to TRIGTIME]
     Total Fluence
        Measured from: -38
                   to: 133.296000003815     [s; relative to TRIGTIME]

             Band 1     Band 2     Band 3     Band 4
              15-25      25-50     50-100    100-350     keV
 Total     1.437459   2.023776   1.444820   0.354768
           0.132849   0.138971   0.127504   0.123849 [error]
 Peak      0.043686   0.049849   0.047754   0.006648
           0.012074   0.012489   0.011356   0.010919 [error]

     [ fluence units of on-axis counts / fully illuminated detector ]

======================================================================


====== Table of the duration information =============================

        Value   tstart    tstop
T100  171.296  -38.000  133.296
T90   153.116  -34.332  118.784
T50    31.136   -6.520   24.616
Peak    1.000    8.704    9.704


====== Spectral Analysis Summary =====================================

Model      : spectral model: simple power-law (PL) and cutoff power-law (CPL)
Ph_index   : photon index: E^{Ph_index}
Ph_90err   : 90% error of the photon index
Epeak      : Epeak in keV
Epeak_90err: 90% error of Epeak
Norm       : normalization at 50 keV in both the PL model and CPL model
Nomr_90err : 90% error of the normalization
chi2       : Chi-Squared
dof        : degree of freedo

=== Time-averaged spectral analysis ===
(Best model with acceptable fit: PL)

Model Ph_index Ph_90err_low Ph_90err_hi  Epeak  Epeak_90err_low  Epeak_90err_hi  Norm       Nomr_90err_low    Norm_90err_hi    chi2    dof
PL      -1.672    -0.145      0.143       -           -               -         2.19e-03     -1.79e-04          1.78e-04      63.090   57
CPL     -1.656    -0.824      0.452      956.417    -956.407      -956.417      2.23e-03     -2.19e-04          1.30e-04      63.120   56


=== 1-s peak spectral analysis ===
(Best model with acceptable fit: PL)

Model Ph_index Ph_90err_low Ph_90err_hi  Epeak  Epeak_90err_low  Epeak_90err_hi  Norm       Nomr_90err_low    Norm_90err_hi    chi2    dof
PL      -1.616     -0.432     0.418       -           -               -         1.03e-02     -2.64e-03          2.61e-03      57.580   57
CPL     -0.998     -1.285     2.223       82.779     -72.664       -82.779      2.10e-02     -1.31e-02          2.18e-01      57.170   56


=== Fluence/Peak Flux Summary ===

              Model    Band1     Band2     Band3     Band4     Band5     Total
                       15-25     25-50    50-100    100-350    15-150    15-350    keV
Fluence         PL   5.63e-07  9.32e-07  1.17e-06  2.92e-06  3.48e-06  5.59e-06   erg/cm2
      90%_error_low -7.37e-08 -7.48e-08 -1.28e-07 -6.32e-07 -2.99e-07 -7.45e-07   erg/cm2
      90%_error_hi   7.66e-08  7.45e-08  1.28e-07  7.41e-07  3.02e-07  8.28e-07   erg/cm2
Peak flux       PL   4.74e-01  4.45e-01  2.91e-01  2.93e-01  1.33e+00  1.50e+00   ph/cm2/s
      90%_error_low -1.86e-01 -1.19e-01 -9.18e-02 -1.51e-01 -3.41e-01 -3.72e-01   ph/cm2/s
      90%_error_hi   2.08e-01  1.17e-01  8.97e-02  2.18e-01  3.43e-01  3.73e-01   ph/cm2/s

Fluence        CPL   5.65e-07  9.25e-07  1.16e-06  3.15e-06  3.50e-06  5.61e-06   erg/cm2
      90%_error_low -8.48e-08 -7.81e-08 -1.56e-07 -1.74e-06 -3.78e-07 -1.54e-06   erg/cm2
      90%_error_hi   7.65e-08  1.01e-07  1.69e-07  1.09e-06  2.56e-07  3.92e-07   erg/cm2
Peak flux      CPL   4.23e-01  4.72e-01  3.09e-01  1.61e-01  1.30e+00  1.36e+00   ph/cm2/s
      90%_error_low -2.27e-01 -1.32e-01 -1.04e-01 -1.61e-01 -3.51e-01 -3.97e-01   ph/cm2/s
      90%_error_hi   2.41e-01  1.45e-01  1.11e-01  1.91e-01  3.53e-01  4.21e-01   ph/cm2/s

======================================================================
Image
Pre-slew 15.0-350.0 keV image (Event data)
#   RAcent    DECcent   POSerr    Theta     Phi              Peak Cts       SNR   Name
   97.8780    24.3487   0.0123    49.3476  -170.8726         4.4950832     15.593 TRIG_00451343

Foreground time interval of the image:
-38.000  67.325 (delta_t = 105.325 [sec])
Background time interval of the image:
-239.376 -38.000 (delta_t = 201.376 [sec])
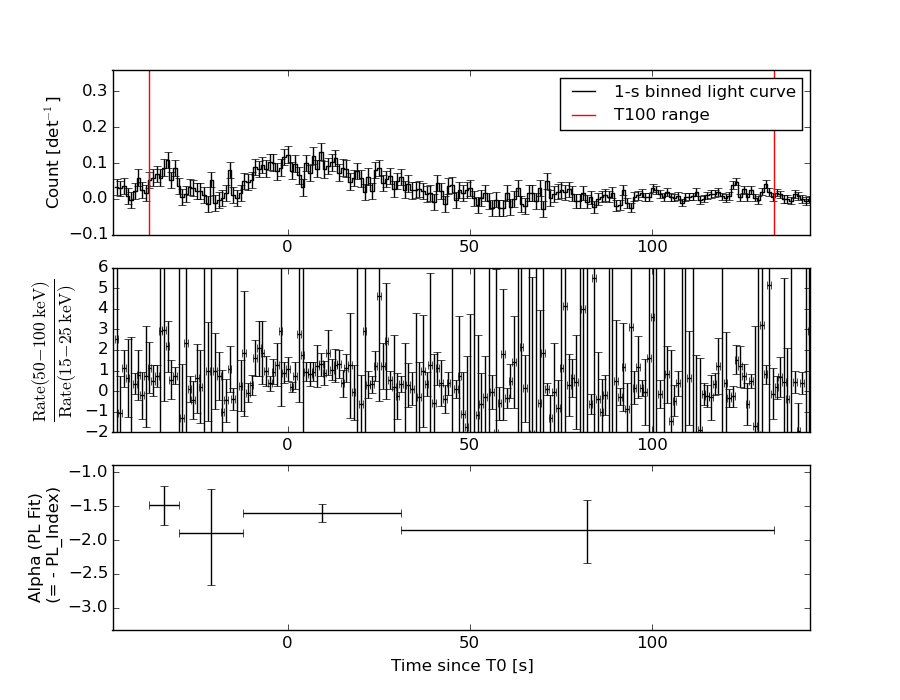
Light Curves
Note: The mask-weighted lightcurves have units of either count/det or counts/sec/det, where a det is 0.4 x 0.4 = 0.16 sq cm.
Full-time range; 1 s binning
Other quick-look light curves:
- 64 ms binning (zoomed)
- 16 ms binning (zoomed)
- 8 ms binning (zoomed)
- 2 ms binning (zoomed)
- SN=5 or 10 s binning (full-time range)
- Raw light curve
Spectra
- 64 ms binning (zoomed)
- 16 ms binning (zoomed)
- 8 ms binning (zoomed)
- 2 ms binning (zoomed)
- SN=5 or 10 s binning (full-time range)
- Raw light curve
Spectra
Notes:
- 1) The fitting includes the systematic errors.
- 2) When the burst includes telescope slew time periods, the fitting uses an average response file made from multiple 5-s response files through out the slew time plus single time preiod for the non-slew times, and weighted by the total counts in the corresponding time period using addrmf. An average response file is needed becuase a spectral fit using the pre-slew DRM will introduce some errors in both a spectral shape and a normalization if the PHA file contains a lot of the slew/post-slew time interval.
- 3) For fits to more complicated models (e.g. a power-law over a cutoff power-law), the BAT team has decided to require a chi-square improvement of more than 6 for each extra dof.
Time averaged spectrum fit using the average DRM
Power-law model
Time interval is from  -38.000 sec. to  133.296 sec.

Spectral model in power-law:
------------------------------------------------------------
Parameters  : value       lower 90%   higher 90%
Photon index: -1.67222     ( -0.145105   0.142771 )
Norm@50keV  : 2.18976E-03    ( -0.000179086   0.000177611 )
------------------------------------------------------------
#Fit statistic : Chi-Squared =          63.09 using 59 PHA bins.
# Reduced chi-squared =          1.107 for     57 degrees of freedom
# Null hypothesis probability =   2.699496e-01

Photon flux (15-150 keV)    in 171.3 sec: 0.288070 ( -0.023134  0.023207 ) ph/cm2/s
Energy fluence (15-150 keV)             : 3.48174e-06 ( -2.99468e-07  3.01877e-07 ) ergs/cm2
Cutoff power-law model

Time interval is from  -38.000 sec. to  133.296 sec.
Spectral model in the cutoff power-law:
------------------------------------------------------------
Parameters  : value       lower 90%   higher 90%
Photon index: -1.67063     ( -0.824444   0.452176 )
Epeak [keV] : 1.00000E+04      ( -9999.99 -10000 )
Norm@50keV  : 2.19408E-03    ( -0.000180094   0.000169277 )
------------------------------------------------------------
#Fit statistic : Chi-Squared =          63.09 using 59 PHA bins.
# Reduced chi-squared =          1.127 for     56 degrees of freedom
# Null hypothesis probability =   2.400858e-01

Photon flux (15-150 keV)    in 171.3 sec: 0.289135 ( -0.027936  0.025249 ) ph/cm2/s
Energy fluence (15-150 keV)             : 3.50031e-06 ( -3.78063e-07  2.55532e-07 ) ergs/cm2
1-s peak spectrum fit
Power-law model
Time interval is from    8.704 sec. to    9.704 sec.

Spectral model in power-law:
------------------------------------------------------------
Parameters  : value       lower 90%   higher 90%
Photon index: -1.61587     ( -0.432474   0.417824 )
Norm@50keV  : 1.03006E-02    ( -0.00263978   0.00260633 )
------------------------------------------------------------
#Fit statistic : Chi-Squared =          57.58 using 59 PHA bins.
# Reduced chi-squared =          1.010 for     57 degrees of freedom
# Null hypothesis probability =   4.536137e-01

Photon flux (15-150 keV)    in 1 sec: 1.33032 ( -0.341383  0.34336 ) ph/cm2/s
Energy fluence (15-150 keV)             : 9.61657e-08 ( -2.56558e-08  2.59946e-08 ) ergs/cm2
Cutoff power-law model
Time interval is from    8.704 sec. to    9.704 sec.
Spectral model in the cutoff power-law:
------------------------------------------------------------
Parameters  : value       lower 90%   higher 90%
Photon index: -0.997679     ( -1.28461   2.2229 )
Epeak [keV] : 82.7794      ( -72.6644 -82.7793 )
Norm@50keV  : 2.10043E-02    ( -0.01312   0.218166 )
------------------------------------------------------------
#Fit statistic : Chi-Squared =          57.17 using 59 PHA bins.
# Reduced chi-squared =          1.021 for     56 degrees of freedom
# Null hypothesis probability =   4.315087e-01

Photon flux (15-150 keV)    in 1 sec: 1.30030 ( -0.351026  0.35254 ) ph/cm2/s
Energy fluence (15-150 keV)             : 9.32975e-08 ( -2.67349e-08  2.71007e-08 ) ergs/cm2
Time-resolved spectra
Distribution
T90 vs. Hardness ratio plot
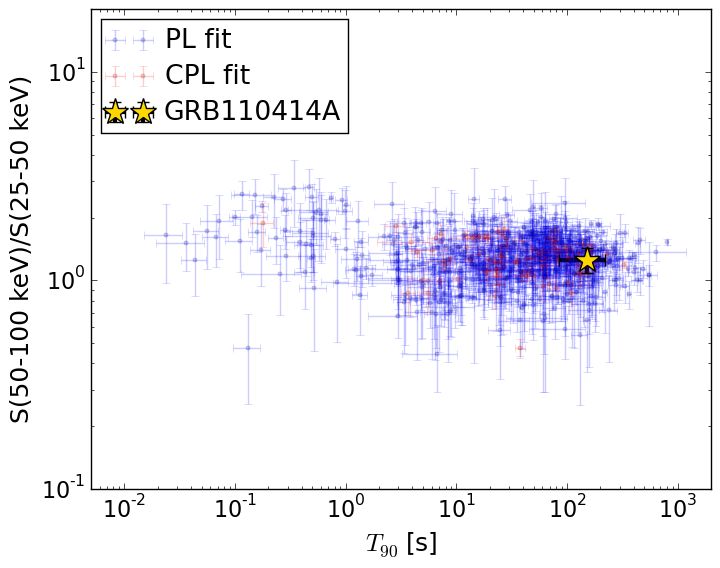
T90                                   = 153.116 sec.
Hardness ratio (energy fluence ratio) = 1.25510496858
S(15-50 keV) vs. S(50-150 keV) plot
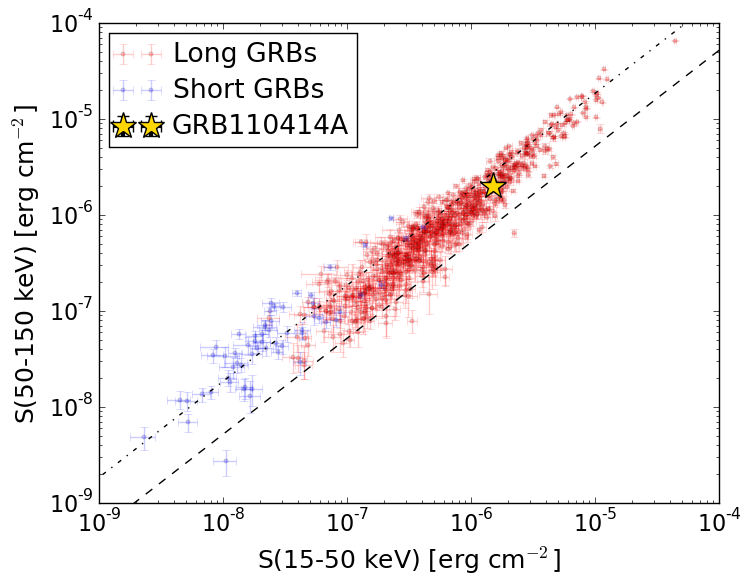
S(15-50 keV)  = 1.4947192e-06
S(50-150 keV) = 1.9870022e-06
The dash-dotted line and the dashed line traces the fluences calculated from the Band function with Epeak = 15 and 150 keV, respectively. Both lines assume a canonical values of alpha = -1 and beta = -2.5.
Mask shadow pattern
IMX = -1.149816202800094E+00, IMY = 1.847357461875183E-01
Spacecraft aspect plot
Bright source in the pre-burst/pre-slew/post-slew images
Pre-burst image of 15-350 keV band
Time interval of the image:
-239.376000 -38.000000

# RAcent  DECcent POSerr Theta    Phi  PeakCts   SNR AngSep     Name
#  [deg]    [deg]    ['] [deg]  [deg]                   [']
 83.6197  22.0097    0.9  54.8 -155.5   7.8492  12.6    0.8	Crab
217.1377  53.4216    3.3  40.7   39.3   1.4157   3.5 ------	UNKNOWN
173.2606  63.4178    2.6  18.9   62.9   0.8923   4.5 ------	UNKNOWN
117.3881  28.3447    2.7  42.8  165.9   1.5597   4.3 ------	UNKNOWN
 68.3340  30.6103    3.7  51.1 -135.8   2.8131   3.2 ------	UNKNOWN
Pre-slew background subtracted image of 15-350 keV band
Time interval of the image:
-38.000000 67.324600

# RAcent  DECcent POSerr Theta    Phi  PeakCts   SNR AngSep     Name
#  [deg]    [deg]    ['] [deg]  [deg]                   [']
 83.5362  21.9693   21.7  54.9 -155.4  -0.2802  -0.5    6.0	Crab
165.3894  39.4300    2.1  36.9  100.4   2.2079   5.4 ------	UNKNOWN
 97.8780  24.3487    0.7  49.3 -170.9   4.4937  15.6 ------	UNKNOWN
314.3012  78.5219    2.4  30.7  -29.5   0.7154   4.7 ------	UNKNOWN
 80.2211  54.2288    2.3  26.1 -131.2   0.7748   5.0 ------	UNKNOWN
Post-slew image of 15-350 keV band
Time interval of the image:
131.324590 962.727800

# RAcent  DECcent POSerr Theta    Phi  PeakCts   SNR AngSep     Name
#  [deg]    [deg]    ['] [deg]  [deg]                   [']
 83.6284  22.0244    0.2  13.3  -99.9  34.5353  62.6    0.7	Crab
139.2826  53.6837    2.6  42.5   32.8   5.3154   4.5 ------	UNKNOWN
111.8183  21.7282    2.8  13.1   96.3   2.2491   4.2 ------	UNKNOWN
105.5595 -13.7429    2.7  38.8  165.5   3.5839   4.3 ------	UNKNOWN
100.4772 -21.1956    2.5  45.6  174.0   5.1608   4.7 ------	UNKNOWN
105.3518  46.0454    2.2  22.5   11.0   2.7179   5.2 ------	UNKNOWN
 65.4605 -20.9065    4.7  55.2 -145.0   8.3668   2.5 ------	UNKNOWN