Analysis Summary
Notes:
- 1) No attempt has been made to eliminate the non-significant decimal places.
- 2) This batgrbproduct analysis is done using the HEASARC data.
- 3) This batgrbproduct analysis is using the flight position for the mask-weighting calculation.
======================================================================
BAT GRB EVENT DATA PROCESSING REPORT
Process Script Ver: batgrbproduct v2.46
Process Start Time: Mon Jan 13 22:54:14 EST 2014
Host Name: batevent1
Current Working Dir: /local/data/batevent/batevent_reproc/trigger451757
======================================================================
Trigger: 00451757 Segment: 000
BAT Trigger Time: 324990150.912 [s; MET]
Trigger Stop: 324990151.936 [s; MET]
UTC: 2011-04-20T11:02:24.037860 [includes UTCF correction]
Where From?: TDRSS position message
BAT
RA: 2.16510709260475 Dec: -37.8550292612526 [deg; J2000]
Catalogged Source?: NO
Point Source?: YES
GRB Indicated?: YES [ by BAT flight software ]
Image S/N Ratio: 7.93
Image Trigger?: NO
Rate S/N Ratio: 12.6491106406735 [ if not an image trigger ]
Image S/N Ratio: 7.93
Analysis Position: [ source = BAT ]
RA: 2.16510709260475 Dec: -37.8550292612526 [deg; J2000]
Refined Position: [ source = BAT pre-slew burst ]
RA: 2.16392106610135 Dec: -37.8770094287737 [deg; J2000]
{ 00h 08m 39.3s , -37d 52' 37.2" }
+/- 0.84520773199824 [arcmin] (estimated 90% radius based on SNR)
+/- 0.317731189257129 [arcmin] (formal 1-sigma fit error)
SNR: 38.6773127603391
Angular difference between the analysis and refined position is 1.320006 arcmin
Partial Coding Fraction: 0.1503906 [ including projection effects ]
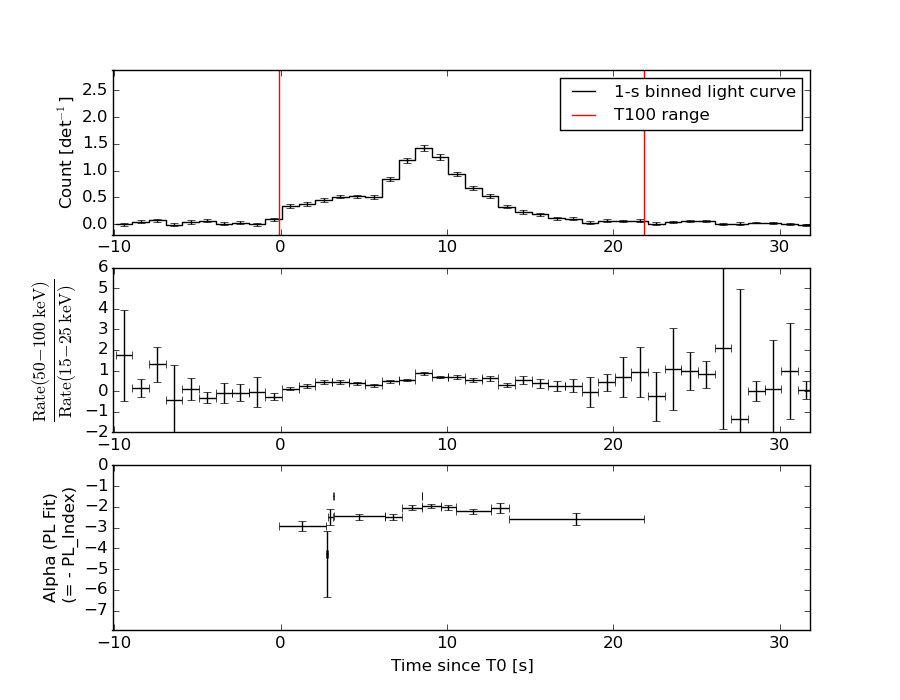
Duration
T90: 13.8679999709129 +/- 1.30256362054126
Measured from: 1.42799997329712
to: 15.2959999442101 [s; relative to TRIGTIME]
T50: 4.72799998521805 +/- 0.404850582176752
Measured from: 5.92799997329712
to: 10.6559999585152 [s; relative to TRIGTIME]
Fluence
Peak Flux (peak 1 second)
Measured from: 8.04399996995926
to: 9.04399996995926 [s; relative to TRIGTIME]
Total Fluence
Measured from: -0.103999972343445
to: 21.8159999847412 [s; relative to TRIGTIME]
Band 1 Band 2 Band 3 Band 4
15-25 25-50 50-100 100-350 keV
Total 4.135931 4.135400 2.100571 0.341742
0.095461 0.096117 0.078715 0.057984 [error]
Peak 0.441170 0.519792 0.393224 0.091834
0.026448 0.029003 0.024733 0.015954 [error]
[ fluence units of on-axis counts / fully illuminated detector ]
======================================================================
====== Table of the duration information =============================
Value tstart tstop
T100 21.920 -0.104 21.816
T90 13.868 1.428 15.296
T50 4.728 5.928 10.656
Peak 1.000 8.044 9.044
====== Spectral Analysis Summary =====================================
Model : spectral model: simple power-law (PL) and cutoff power-law (CPL)
Ph_index : photon index: E^{Ph_index}
Ph_90err : 90% error of the photon index
Epeak : Epeak in keV
Epeak_90err: 90% error of Epeak
Norm : normalization at 50 keV in both the PL model and CPL model
Nomr_90err : 90% error of the normalization
chi2 : Chi-Squared
dof : degree of freedo
=== Time-averaged spectral analysis ===
(Best model with acceptable fit: PL)
Model Ph_index Ph_90err_low Ph_90err_hi Epeak Epeak_90err_low Epeak_90err_hi Norm Nomr_90err_low Norm_90err_hi chi2 dof
PL -2.270 -0.066 0.065 - - - 3.09e-02 -1.09e-03 1.09e-03 42.920 57
CPL -1.986 -0.011 0.159 2.434 -1.901 -1.537 4.27e-02 -3.38e-03 2.49e-03 42.420 56
=== 1-s peak spectral analysis ===
(Best model with acceptable fit: PL)
Model Ph_index Ph_90err_low Ph_90err_hi Epeak Epeak_90err_low Epeak_90err_hi Norm Nomr_90err_low Norm_90err_hi chi2 dof
PL -1.797 -0.107 0.105 - - - 1.03e-01 -6.26e-03 6.23e-03 37.250 57
CPL -1.796 -0.107 0.149 9999.350 -9999.340 -9999.350 1.03e-01 -6.83e-02 -2.33e-02 37.250 56
=== Fluence/Peak Flux Summary ===
Model Band1 Band2 Band3 Band4 Band5 Total
15-25 25-50 50-100 100-350 15-150 15-350 keV
Fluence PL 1.79e-06 2.07e-06 1.71e-06 2.39e-06 6.43e-06 7.96e-06 erg/cm2
90%_error_low -1.00e-07 -6.76e-08 -8.40e-08 -2.41e-07 -2.06e-07 -3.19e-07 erg/cm2
90%_error_hi 1.02e-07 6.74e-08 8.40e-08 2.58e-07 2.06e-07 3.27e-07 erg/cm2
Peak flux PL 5.66e+00 4.78e+00 2.75e+00 2.35e+00 1.42e+01 1.55e+01 ph/cm2/s
90%_error_low -5.85e-01 -3.06e-01 -2.10e-01 -3.49e-01 -9.11e-01 -9.23e-01 ph/cm2/s
90%_error_hi 6.06e-01 3.04e-01 2.07e-01 3.80e-01 9.15e-01 9.24e-01 ph/cm2/s
Fluence CPL 1.68e-06 2.06e-06 1.73e-06 1.60e-06 6.40e-06 7.19e-06 erg/cm2
90%_error_low -1.07e-07 -2.73e-08 -7.40e-08 -2.00e-07 N/A -4.11e-07 erg/cm2
90%_error_hi 1.27e-07 1.08e-07 9.53e-08 3.01e-07 N/A 3.81e-07 erg/cm2
Peak flux CPL 5.57e+00 4.19e+00 2.18e+00 1.91e+00 1.27e+01 1.38e+01 ph/cm2/s
90%_error_low -6.65e-01 -3.74e-01 -2.86e-01 -2.09e-01 -1.02e+00 -1.84e+00 ph/cm2/s
90%_error_hi 5.26e-01 3.16e-01 2.57e-01 1.62e-01 9.02e-01 1.70e+00 ph/cm2/s
======================================================================
Image
Pre-slew 15.0-350.0 keV image (Event data)
#   RAcent    DECcent   POSerr    Theta     Phi              Peak Cts       SNR   Name
    2.1639   -37.8770   0.0050    50.1980   -34.0831         8.9135016     38.677 TRIG_00451757

Foreground time interval of the image:
 -0.104  10.989 (delta_t =  11.093 [sec])
Background time interval of the image:
-239.912  -0.104 (delta_t = 239.808 [sec])
Light Curves
Note: The mask-weighted lightcurves have units of either count/det or counts/sec/det, where a det is 0.4 x 0.4 = 0.16 sq cm.
Full-time range; 1 s binning
Other quick-look light curves:
- 64 ms binning (zoomed)
- 16 ms binning (zoomed)
- 8 ms binning (zoomed)
- 2 ms binning (zoomed)
- SN=5 or 10 s binning (full-time range)
- Raw light curve
Spectra
- 64 ms binning (zoomed)
- 16 ms binning (zoomed)
- 8 ms binning (zoomed)
- 2 ms binning (zoomed)
- SN=5 or 10 s binning (full-time range)
- Raw light curve
Spectra
Notes:
- 1) The fitting includes the systematic errors.
- 2) When the burst includes telescope slew time periods, the fitting uses an average response file made from multiple 5-s response files through out the slew time plus single time preiod for the non-slew times, and weighted by the total counts in the corresponding time period using addrmf. An average response file is needed becuase a spectral fit using the pre-slew DRM will introduce some errors in both a spectral shape and a normalization if the PHA file contains a lot of the slew/post-slew time interval.
- 3) For fits to more complicated models (e.g. a power-law over a cutoff power-law), the BAT team has decided to require a chi-square improvement of more than 6 for each extra dof.
Time averaged spectrum fit using the average DRM
Power-law model
Time interval is from   -0.104 sec. to   21.816 sec.

Spectral model in power-law:
------------------------------------------------------------
Parameters  : value       lower 90%   higher 90%
Photon index: -2.27024     ( -0.0658492   0.0648655 )
Norm@50keV  : 3.08648E-02    ( -0.00109266   0.0010864 )
------------------------------------------------------------
#Fit statistic : Chi-Squared =          42.92 using 59 PHA bins.
# Reduced chi-squared =         0.7530 for     57 degrees of freedom
# Null hypothesis probability =   9.165109e-01

Photon flux (15-150 keV)    in 21.92 sec: 5.30663 ( -0.19898  0.20041 ) ph/cm2/s
Energy fluence (15-150 keV)             : 6.43251e-06 ( -2.05774e-07  2.05845e-07 ) ergs/cm2
Cutoff power-law model
Time interval is from   -0.104 sec. to   21.816 sec.
Spectral model in the cutoff power-law:
------------------------------------------------------------
Parameters  : value       lower 90%   higher 90%
Photon index: -1.99632     ( -0.00088396   0.169291 )
Epeak [keV] : 0.674262      ( -0.140623 0.223427 )
Norm@50keV  : 4.20776E-02    ( -0.00281458   0.00305841 )
------------------------------------------------------------
#Fit statistic : Chi-Squared =          42.31 using 59 PHA bins.
# Reduced chi-squared =         0.7556 for     56 degrees of freedom
# Null hypothesis probability =   9.118960e-01

Photon flux (15-150 keV)    in 21.92 sec: 5.14952 ( -0.15959  0.18094 ) ph/cm2/s
Energy fluence (15-150 keV)             : 6.39957e-06 ( 0  0 ) ergs/cm2
1-s peak spectrum fit
Power-law model
Time interval is from    8.044 sec. to    9.044 sec.

Spectral model in power-law:
------------------------------------------------------------
Parameters  : value       lower 90%   higher 90%
Photon index: -1.7972     ( -0.106893   0.105164 )
Norm@50keV  : 0.103216    ( -0.00625877   0.00623383 )
------------------------------------------------------------
#Fit statistic : Chi-Squared =          37.25 using 59 PHA bins.
# Reduced chi-squared =         0.6534 for     57 degrees of freedom
# Null hypothesis probability =   9.801441e-01

Photon flux (15-150 keV)    in 1 sec: 14.2082 ( -0.9114  0.9146 ) ph/cm2/s
Energy fluence (15-150 keV)             : 9.50452e-07 ( -5.84209e-08  5.85453e-08 ) ergs/cm2
Cutoff power-law model
Time interval is from    8.044 sec. to    9.044 sec.
Spectral model in the cutoff power-law:
------------------------------------------------------------
Parameters  : value       lower 90%   higher 90%
Photon index: -2.29932     ( -0.107408   0.149155 )
Epeak [keV] : 116.169      ( -9999.35 -9999.36 )
Norm@50keV  : 5.77570E-02    ( -0.0226602   0.0223046 )
------------------------------------------------------------
#Fit statistic : Chi-Squared =          36.69 using 59 PHA bins.
# Reduced chi-squared =         0.6552 for     56 degrees of freedom
# Null hypothesis probability =   9.785692e-01

Photon flux (15-150 keV)    in 1 sec: 12.7287 ( -1.0218  0.9025 ) ph/cm2/s
Energy fluence (15-150 keV)             : 9.52752e-07 ( -7.44174e-08  6.98344e-08 ) ergs/cm2
Time-resolved spectra
Distribution
T90 vs. Hardness ratio plot
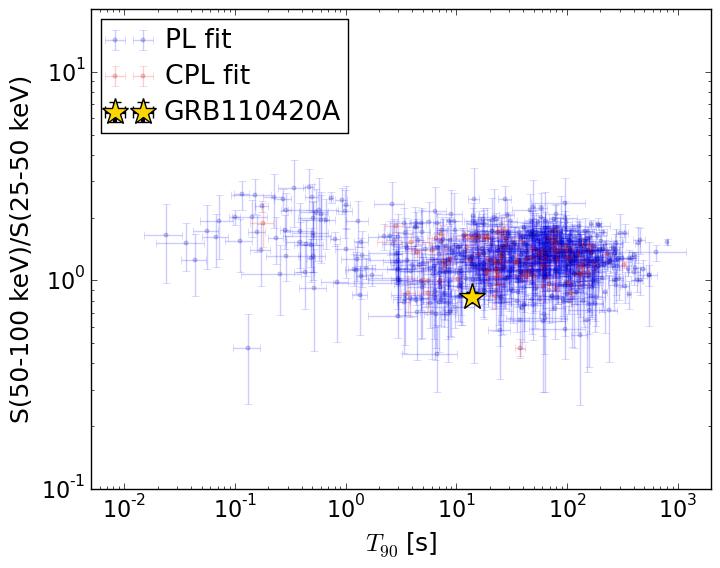
T90                                   = 13.868 sec.
Hardness ratio (energy fluence ratio) = 0.829200940582
S(15-50 keV) vs. S(50-150 keV) plot
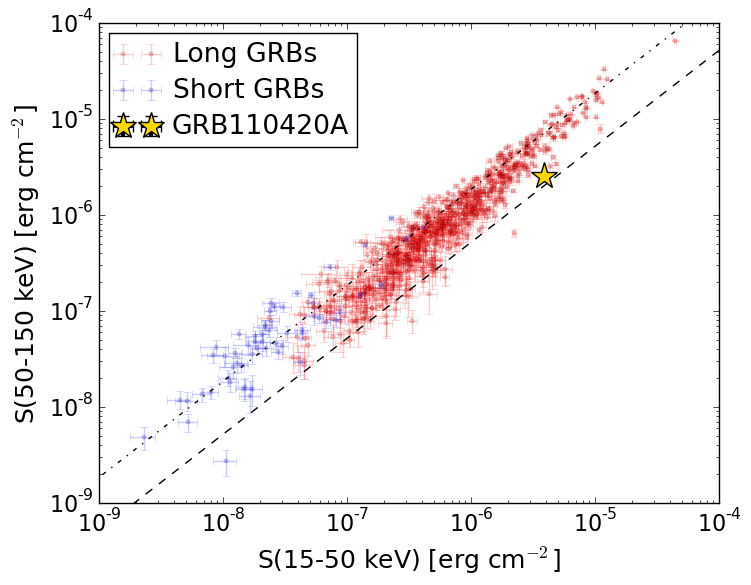
S(15-50 keV)  = 3.856438e-06
S(50-150 keV) = 2.5760906e-06
The dash-dotted line and the dashed line traces the fluences calculated from the Band function with Epeak = 15 and 150 keV, respectively. Both lines assume a canonical values of alpha = -1 and beta = -2.5.
Mask shadow pattern
IMX = 9.939953859145266E-01, IMY = 6.725578022923394E-01
Spacecraft aspect plot
Bright source in the pre-burst/pre-slew/post-slew images
Pre-burst image of 15-350 keV band
Time interval of the image:
-239.912000 -0.104000

# RAcent  DECcent POSerr Theta    Phi  PeakCts   SNR AngSep     Name
#  [deg]    [deg]    ['] [deg]  [deg]                   [']
268.3554  -1.4339    3.5  43.2  129.1   2.7231   3.3    1.4	SW J1753.5-0127
270.2372 -25.0575    8.8  36.6   93.2   0.7962   1.3    2.9	GX 5-1
270.3738 -25.8568   12.0  36.6   91.9   0.5926   1.0    7.8	GRS 1758-258
274.0373 -13.9885    2.0  33.8  112.8   2.2181   5.8    3.4	GX 17+2
276.1194 -30.4774    0.0  32.3   82.3   0.6564   1.6   12.0	H1820-303
285.0231 -24.8921    3.5  23.3   89.9   0.8799   3.3    1.8	HT1900.1-2455
288.8054  10.9494    1.3  35.2  165.1   2.5155   8.9    0.5	GRS 1915+105
299.6070  35.1648    2.1  53.9 -168.3   3.2537   5.6    2.4	Cyg X-1
308.2266  40.8413   13.3  58.9 -159.5   1.4504   0.9    8.5	Cyg X-3
316.6725   5.7813    3.2  25.0 -140.5   0.7255   3.6 ------	UNKNOWN
339.5783  12.6187    3.3  43.0 -112.1   3.5345   3.5 ------	UNKNOWN
Pre-slew background subtracted image of 15-350 keV band
Time interval of the image:
-0.104000 10.988590

# RAcent  DECcent POSerr Theta    Phi  PeakCts   SNR AngSep     Name
#  [deg]    [deg]    ['] [deg]  [deg]                   [']
268.2247  -1.3754    0.0  43.4  129.1  -0.3188  -2.1    9.8	SW J1753.5-0127
270.1594 -25.2147    6.0  36.7   92.9  -0.2157  -1.9   10.6	GX 5-1
270.4015 -25.8395   18.2  36.5   91.9   0.0709   0.6    7.9	GRS 1758-258
273.9532 -14.1836   13.4  33.9  112.5   0.0732   0.9    9.3	GX 17+2
275.9504 -30.3519   59.8  32.4   82.6  -0.0148  -0.2    1.6	H1820-303
285.1589 -25.0372    6.0  23.2   89.5  -0.1096  -1.9    9.7	HT1900.1-2455
288.8043  10.7873    4.3  35.0  165.0   0.1598   2.7    9.5	GRS 1915+105
299.6196  35.3416    3.3  54.1 -168.3   0.3940   3.5    8.5	Cyg X-1
308.0616  40.9435   12.7  59.0 -159.6  -0.2166  -0.9    2.3	Cyg X-3
292.6422 -36.1985    2.7  23.2   56.4   0.2168   4.3 ------	UNKNOWN
306.7288  -0.1912    2.1  18.0 -166.3   0.2779   5.6 ------	UNKNOWN
314.4515   5.8463    2.7  24.5 -145.7   0.2386   4.3 ------	UNKNOWN
352.4674 -34.4243    2.7  41.9  -36.9   0.4733   4.3 ------	UNKNOWN
324.9207  14.9785    2.6  36.5 -132.4   0.4296   4.5 ------	UNKNOWN
  2.1639 -37.8770    0.3  50.2  -34.1   8.9136  38.7 ------	UNKNOWN
Post-slew image of 15-350 keV band
Time interval of the image:
76.788600 962.158300

# RAcent  DECcent POSerr Theta    Phi  PeakCts   SNR AngSep     Name
#  [deg]    [deg]    ['] [deg]  [deg]                   [']
306.4456 -49.4310    2.2  40.9  113.9   9.8157   5.3 ------	UNKNOWN
 68.4914 -43.3005    3.9  49.3   -2.7   2.9751   3.0 ------	UNKNOWN
 50.1896 -13.2184    4.1  49.1  -48.0   7.1081   2.8 ------	UNKNOWN