Analysis Summary
Notes:
- 1) No attempt has been made to eliminate the non-significant decimal places.
- 2) This batgrbproduct analysis is done using the HEASARC data.
- 3) This batgrbproduct analysis is using the flight position for the mask-weighting calculation.
======================================================================
                  BAT GRB EVENT DATA PROCESSING REPORT
    Process Script Ver: batgrbproduct v2.46
    Process Start Time: Mon Jan 13 22:41:51 EST 2014
             Host Name: batevent1
   Current Working Dir: /local/data/batevent/batevent_reproc/trigger451794
======================================================================

  Trigger: 00451794      Segment: 000

  BAT Trigger Time: 325032138.592   [s; MET]
      Trigger Stop: 325032138.624   [s; MET]
               UTC: 2011-04-20T22:42:11.716260    [includes UTCF correction]
       Where From?: (*SHORT BURST*) TDRSS scaled map message

  BAT
    RA: 320.049201406344   Dec: -41.2645076280927  [deg; J2000]

     Catalogged Source?: NO
     Point Source?:      YES
     GRB Indicated?:     YES    [ by BAT flight software ]
     Image S/N Ratio:    8.11
     Image Trigger?:     NO
     Rate S/N Ratio:     34.1906419945575  [ if not an image trigger ]
     Image S/N Ratio:    8.11

  Analysis Position:   [ source = BAT ]
    RA: 320.049201406344   Dec: -41.2645076280927  [deg; J2000]

  Refined Position:   [ source = BAT pre-slew burst ]
    RA: 320.045312656643   Dec: -41.2768481831182  [deg; J2000]
        { 21h 20m 10.9s , -41d 16' 36.7" }
         +/- 2.1759011187064 [arcmin] (estimated 90% radius based on SNR)
         +/- 0.963001866154427 [arcmin] (formal 1-sigma fit error)
    SNR: 10.0179008564505

  Angular difference between the analysis and refined position is 0.760917 arcmin

  Partial Coding Fraction: 0.359375    [ including projection effects ]

  Duration
     T90: 0.0839999318122864 +/- 0.0215406475404197
        Measured from: 0
                   to: 0.0839999318122864     [s; relative to TRIGTIME]
     T50: 0.0399999022483826 +/- 0.0164924559253201
        Measured from: 0.00800001621246338
                   to: 0.0479999184608459     [s; relative to TRIGTIME]


  Fluence
     Peak Flux  (peak 1 second)
        Measured from: -0.449999988079071
                   to: 0.550000011920929     [s; relative to TRIGTIME]
     Total Fluence
        Measured from: -0.00400000810623169
                   to: 0.0999999642372131     [s; relative to TRIGTIME]

             Band 1     Band 2     Band 3     Band 4
              15-25      25-50     50-100    100-350     keV
 Total     0.013226   0.024934   0.045513   0.009519
           0.004074   0.004631   0.005596   0.003927 [error]
 Peak      0.022554   0.014398   0.048743  -0.007308
           0.009217   0.009760   0.009733   0.008372 [error]

     [ fluence units of on-axis counts / fully illuminated detector ]

======================================================================


====== Table of the duration information =============================

        Value   tstart    tstop
T100    0.104   -0.004    0.100
T90     0.084    0.000    0.084
T50     0.040    0.008    0.048
Peak    1.000   -0.450    0.550


====== Spectral Analysis Summary =====================================

Model      : spectral model: simple power-law (PL) and cutoff power-law (CPL)
Ph_index   : photon index: E^{Ph_index}
Ph_90err   : 90% error of the photon index
Epeak      : Epeak in keV
Epeak_90err: 90% error of Epeak
Norm       : normalization at 50 keV in both the PL model and CPL model
Nomr_90err : 90% error of the normalization
chi2       : Chi-Squared
dof        : degree of freedo

=== Time-averaged spectral analysis ===
(Best model with acceptable fit: N/A)

Model Ph_index Ph_90err_low Ph_90err_hi  Epeak  Epeak_90err_low  Epeak_90err_hi  Norm       Nomr_90err_low    Norm_90err_hi    chi2    dof
PL      -1.122    -0.272      0.271       -           -               -         5.09e-02     -9.02e-03          9.01e-03      74.540   57
CPL      1.642    -1.910      3.361       78.296     -12.636        41.024      7.55e-01     -7.55e-01          1.10e+01      67.510   56


=== 1-s peak spectral analysis ===
(Best model with acceptable fit: PL)

Model Ph_index Ph_90err_low Ph_90err_hi  Epeak  Epeak_90err_low  Epeak_90err_hi  Norm       Nomr_90err_low    Norm_90err_hi    chi2    dof
PL      -1.037     -0.598     0.607       -           -               -         5.69e-03     -2.01e-03          2.00e-03      61.490   57
CPL      6.100     -4.857    -6.100       79.986     -13.293        18.552      1.06e+00     -1.06e+00          5.78e+01      57.050   56


=== Fluence/Peak Flux Summary ===

              Model    Band1     Band2     Band3     Band4     Band5     Total
                       15-25     25-50    50-100    100-350    15-150    15-350    keV
Fluence         PL   4.75e-09  1.10e-08  2.02e-08  8.90e-08  5.50e-08  1.25e-07   erg/cm2
      90%_error_low -1.40e-09 -2.20e-09 -4.11e-09 -3.27e-08 -1.06e-08 -3.64e-08   erg/cm2
      90%_error_hi   1.53e-09  2.16e-09  4.05e-09  4.21e-08  1.07e-08  4.42e-08   erg/cm2
Peak flux       PL   1.51e-01  2.00e-01  1.95e-01  3.39e-01  6.56e-01  8.84e-01   ph/cm2/s
      90%_error_low -8.74e-02 -8.51e-02 -7.52e-02 -2.10e-01 -2.34e-01 -1.61e-01   ph/cm2/s
      90%_error_hi   1.15e-01  8.43e-02  7.36e-02  3.41e-01  2.37e-01  3.54e-01   ph/cm2/s

Fluence        CPL   2.20e-09  1.24e-08  2.70e-08  1.44e-08  5.27e-08  5.60e-08   erg/cm2
      90%_error_low -1.64e-09 -3.20e-09 -6.40e-09 -9.03e-09 -1.07e-08 -1.33e-08   erg/cm2
      90%_error_hi   2.18e-09  2.83e-09  7.19e-09  2.51e-08  1.10e-08  2.41e-08   erg/cm2
Peak flux      CPL   1.29e-03  6.68e-02  3.42e-01  4.35e-02  4.50e-01  4.48e-01   ph/cm2/s
      90%_error_low -1.29e-03 -3.22e-02 -1.14e-01 -4.35e-02 -1.35e-01 -1.33e-01   ph/cm2/s
      90%_error_hi   7.16e-02  1.53e-01  1.01e-01  1.07e-01  2.08e-01  2.34e-01   ph/cm2/s

======================================================================
Image
Pre-slew 15.0-350.0 keV image (Event data)
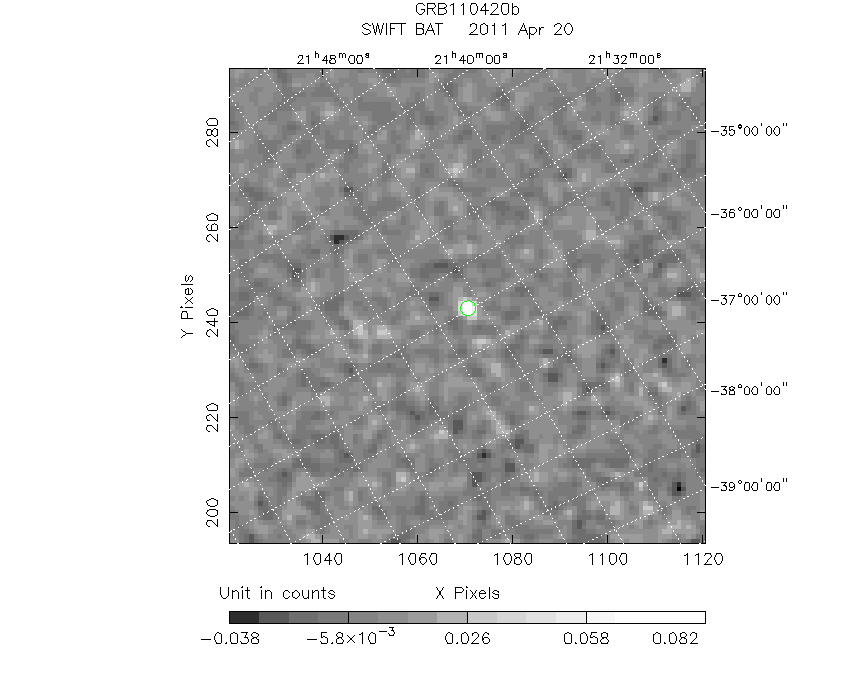
#   RAcent    DECcent   POSerr    Theta     Phi              Peak Cts       SNR   Name
  320.0453   -41.2768   0.0192    32.3729   129.2634         0.0909915     10.018 TRIG_00451794

Foreground time interval of the image:
 -0.004   0.100 (delta_t =   0.104 [sec])
Background time interval of the image:
-239.592  -0.004 (delta_t = 239.588 [sec])
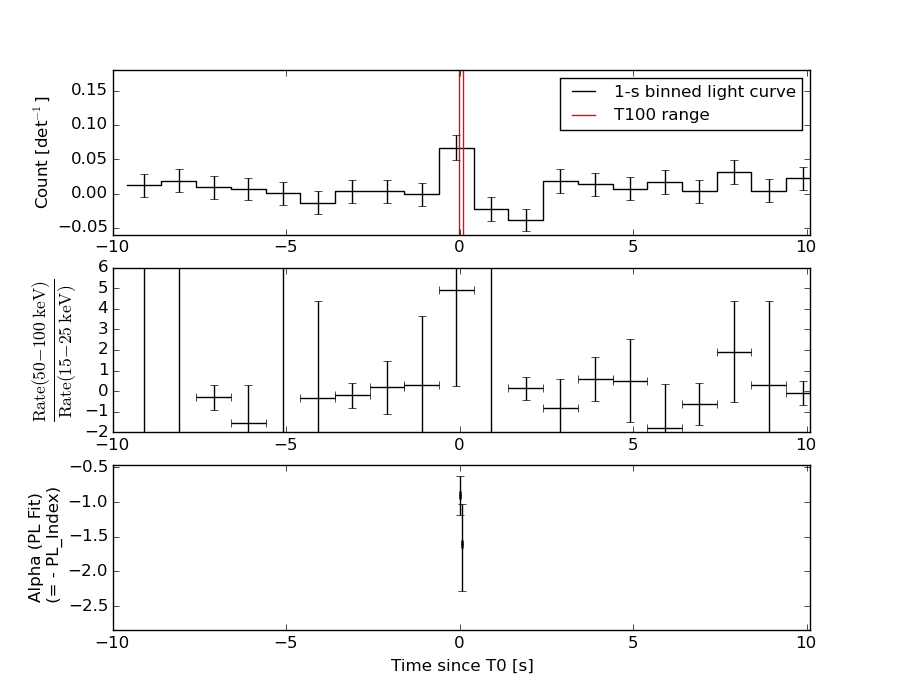
Light Curves
Note: The mask-weighted lightcurves have units of either count/det or counts/sec/det, where a det is 0.4 x 0.4 = 0.16 sq cm.
Full-time range; 1 s binning
Other quick-look light curves:
- 64 ms binning (zoomed)
- 16 ms binning (zoomed)
- 8 ms binning (zoomed)
- 2 ms binning (zoomed)
- SN=5 or 10 s binning (full-time range)
- Raw light curve
Spectra
- 64 ms binning (zoomed)
- 16 ms binning (zoomed)
- 8 ms binning (zoomed)
- 2 ms binning (zoomed)
- SN=5 or 10 s binning (full-time range)
- Raw light curve
Spectra
Notes:
- 1) The fitting includes the systematic errors.
- 2) When the burst includes telescope slew time periods, the fitting uses an average response file made from multiple 5-s response files through out the slew time plus single time preiod for the non-slew times, and weighted by the total counts in the corresponding time period using addrmf. An average response file is needed becuase a spectral fit using the pre-slew DRM will introduce some errors in both a spectral shape and a normalization if the PHA file contains a lot of the slew/post-slew time interval.
- 3) For fits to more complicated models (e.g. a power-law over a cutoff power-law), the BAT team has decided to require a chi-square improvement of more than 6 for each extra dof.
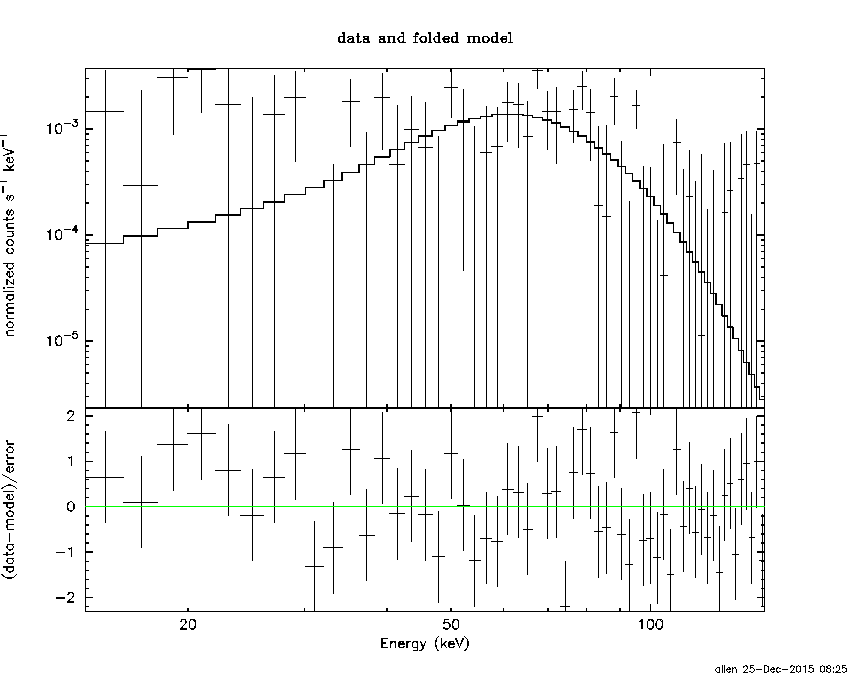
Time averaged spectrum fit using the average DRM
Power-law model
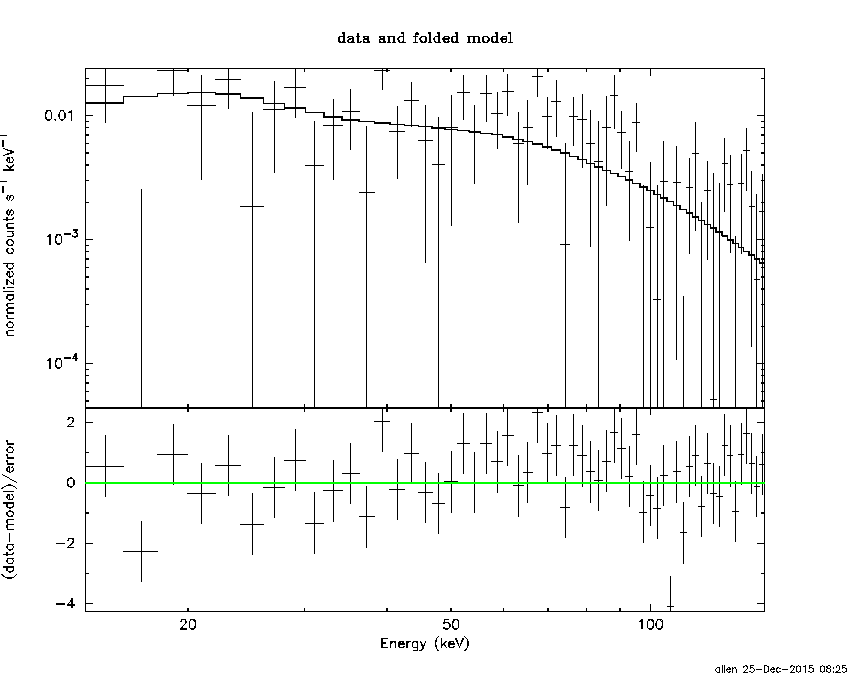
Time interval is from   -0.004 sec. to    0.100 sec.

Spectral model in power-law:
------------------------------------------------------------
Parameters  : value       lower 90%   higher 90%
Photon index: -1.12172     ( -0.271729   0.271481 )
Norm@50keV  : 5.09355E-02    ( -0.00901583   0.00901223 )
------------------------------------------------------------
#Fit statistic : Chi-Squared =          74.54 using 59 PHA bins.
# Reduced chi-squared =          1.308 for     57 degrees of freedom
# Null hypothesis probability =   5.932664e-02

Photon flux (15-150 keV)    in 0.104 sec: 0.185362 0.282082 0.181558 4.16980E-02 (    ) ph/cm2/s
Energy fluence (15-150 keV)             : 5.50102e-08 ( -1.05887e-08  1.06547e-08 ) ergs/cm2
Cutoff power-law model
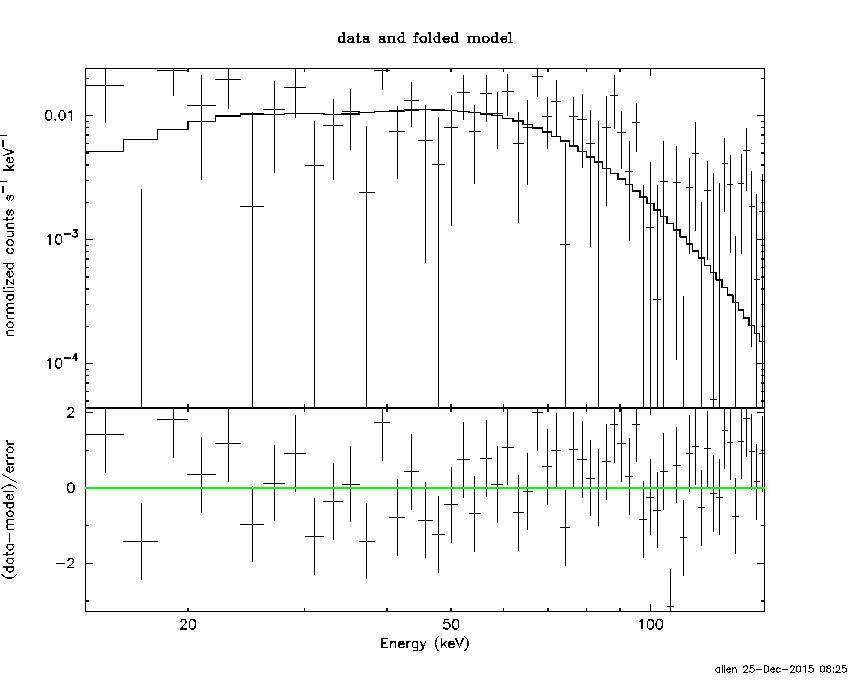
Time interval is from   -0.004 sec. to    0.100 sec.
Spectral model in the cutoff power-law:
------------------------------------------------------------
Parameters  : value       lower 90%   higher 90%
Photon index: 1.64229     ( -1.91988   3.35127 )
Epeak [keV] : 78.2964      ( -12.5723 41.0874 )
Norm@50keV  : 0.755123    ( -0.76608   11.032 )
------------------------------------------------------------
#Fit statistic : Chi-Squared =          67.51 using 59 PHA bins.
# Reduced chi-squared =          1.206 for     56 degrees of freedom
# Null hypothesis probability =   1.394258e-01

Photon flux (15-150 keV)    in 0.104 sec: 5.50945 ( -1.12171  1.12355 ) ph/cm2/s
Energy fluence (15-150 keV)             : 5.267e-08 ( -1.07439e-08  1.10013e-08 ) ergs/cm2
1-s peak spectrum fit
Power-law model
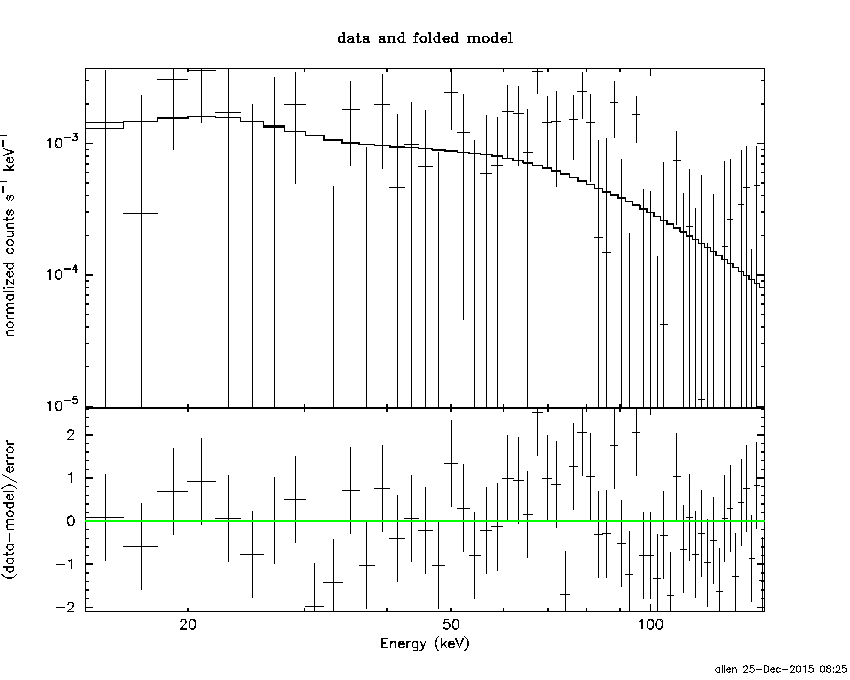
Time interval is from   -0.450 sec. to    0.550 sec.

Spectral model in power-law:
------------------------------------------------------------
Parameters  : value       lower 90%   higher 90%
Photon index: -1.03707     ( -0.597945   0.607128 )
Norm@50keV  : 5.68852E-03    ( -0.00201087   0.00200069 )
------------------------------------------------------------
#Fit statistic : Chi-Squared =          61.49 using 59 PHA bins.
# Reduced chi-squared =          1.079 for     57 degrees of freedom
# Null hypothesis probability =   3.185353e-01

Photon flux (15-150 keV)    in 1 sec: 0.656421 ( -0.234463  0.236882 ) ph/cm2/s
Energy fluence (15-150 keV)             : 6.07267e-08 ( -2.2776e-08  2.32792e-08 ) ergs/cm2
Cutoff power-law model
Time interval is from   -0.450 sec. to    0.550 sec.
Spectral model in the cutoff power-law:
------------------------------------------------------------
Parameters  : value       lower 90%   higher 90%
Photon index: 9.99564     ( -8.75692   -9.99988 )
Epeak [keV] : 78.1791      ( -11.4832 20.361 )
Norm@50keV  : 13.6082    ( -13.7034   45.1607 )
------------------------------------------------------------
#Fit statistic : Chi-Squared =          56.12 using 59 PHA bins.
# Reduced chi-squared =          1.002 for     56 degrees of freedom
# Null hypothesis probability =   4.703094e-01

Photon flux (15-150 keV)    in 1 sec: 0.449918 ( -0.135169  0.208405 ) ph/cm2/s
Energy fluence (15-150 keV)             : 5.09612e-08 ( -1.64762e-08  2.14557e-08 ) ergs/cm2
Time-resolved spectra
Distribution
T90 vs. Hardness ratio plot
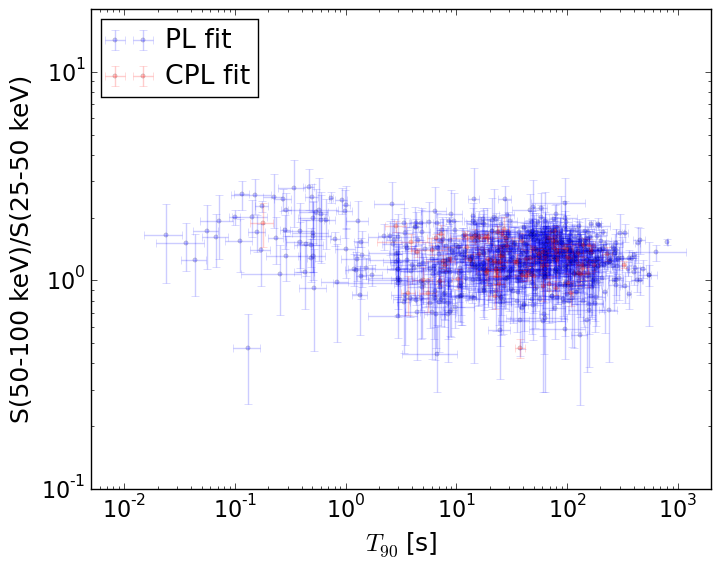
T90                                   = N/A sec.
Hardness ratio (energy fluence ratio) = N/A
S(15-50 keV) vs. S(50-150 keV) plot
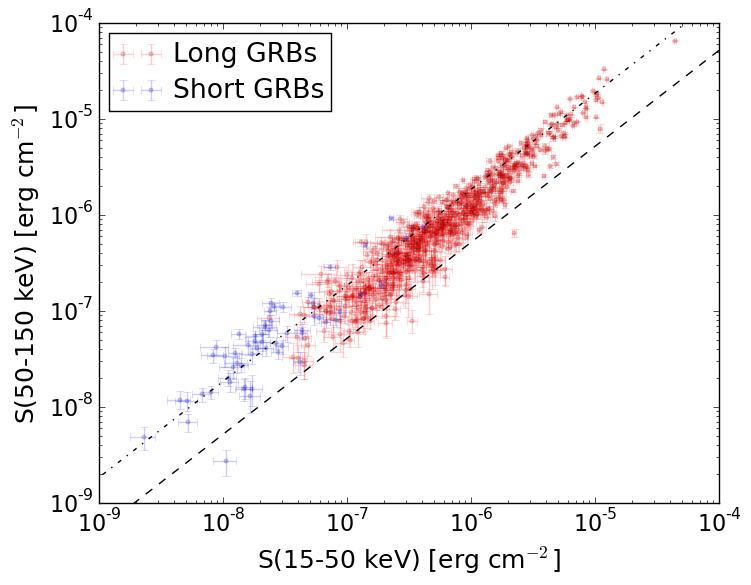
S(15-50 keV)  = N/A
S(50-150 keV) = N/A
The dash-dotted line and the dashed line traces the fluences calculated from the Band function with Epeak = 15 and 150 keV, respectively. Both lines assume a canonical values of alpha = -1 and beta = -2.5.
Mask shadow pattern
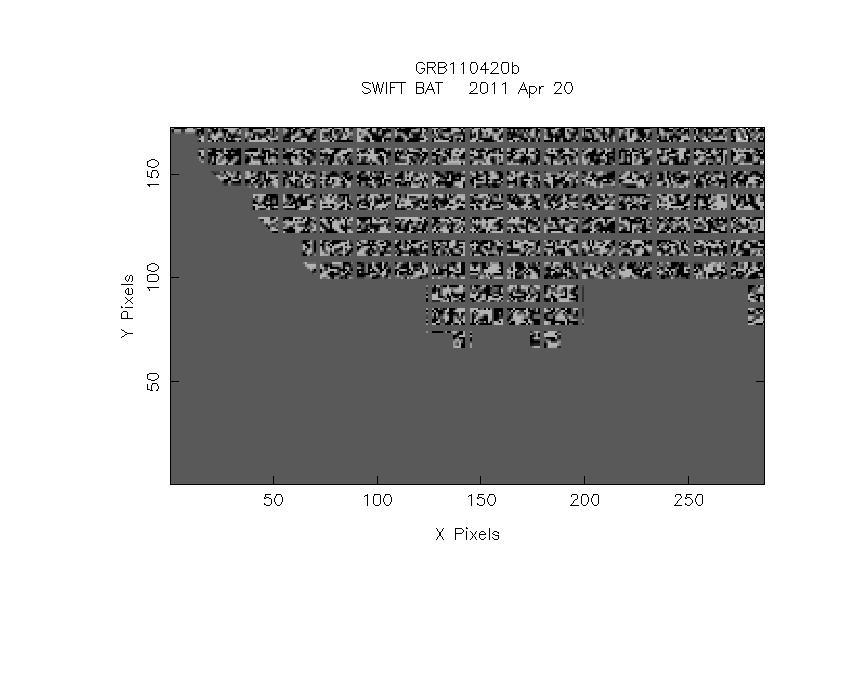
IMX = -4.012213397512188E-01, IMY = -4.908367669712406E-01
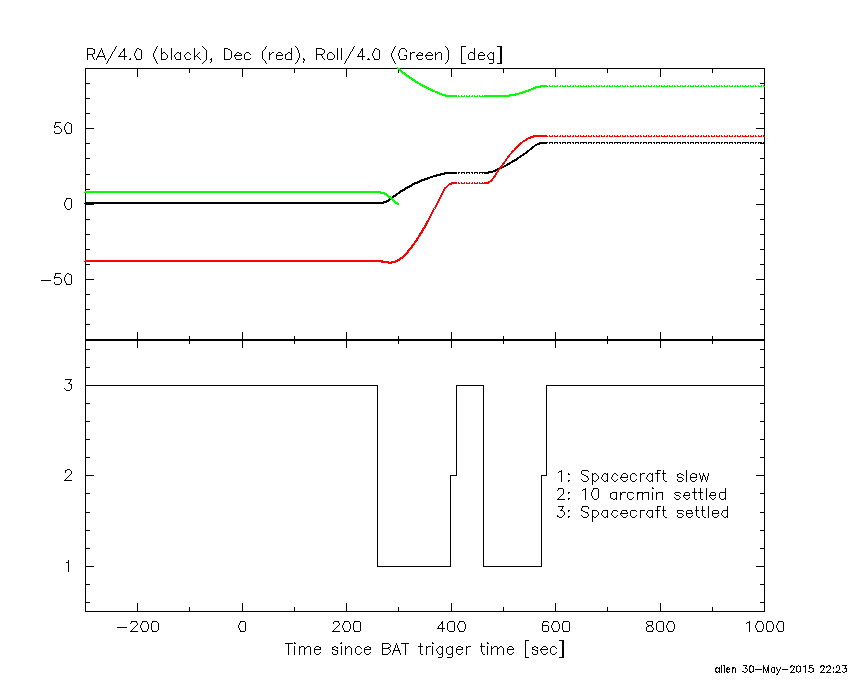
Spacecraft aspect plot
Bright source in the pre-burst/pre-slew/post-slew images
Pre-burst image of 15-350 keV band
Time interval of the image:
-239.592000 -0.004000

# RAcent  DECcent POSerr Theta    Phi  PeakCts   SNR AngSep     Name
#  [deg]    [deg]    ['] [deg]  [deg]                   [']
359.6338 -72.2001    3.2  34.4   60.2   1.3653   3.6 ------	UNKNOWN
337.0268 -29.2739    3.2  22.6  163.6   0.6193   3.6 ------	UNKNOWN
 50.2469 -13.1572    2.8  49.2  -48.1   3.8876   4.2 ------	UNKNOWN
  8.3908   4.6759    2.9  42.9 -112.1   3.5167   4.0  575.8	UNKNOWN
Pre-slew background subtracted image of 15-350 keV band
Time interval of the image:
-0.004000 0.100000

# RAcent  DECcent POSerr Theta    Phi  PeakCts   SNR AngSep     Name
#  [deg]    [deg]    ['] [deg]  [deg]                   [']
320.0457 -41.2760    1.1  32.4  129.3   0.0913  10.0 ------	UNKNOWN
 67.9286 -45.3253    2.7  48.3   -0.3   0.0443   4.3 ------	UNKNOWN
344.4629  -9.8770    1.9  32.2 -155.5   0.0320   6.0 ------	UNKNOWN
Post-slew image of 15-350 keV band
Time interval of the image:
399.408600 461.708650

# RAcent  DECcent POSerr Theta    Phi  PeakCts   SNR AngSep     Name
#  [deg]    [deg]    ['] [deg]  [deg]                   [']
 83.6473  22.0103    0.4   8.2  -12.7   2.7030  29.4    0.8	Crab
 81.5900 -31.8583    2.5  45.7  166.0   0.9888   4.6 ------	UNKNOWN
106.4846  41.6450    2.5  34.4   15.7   0.6056   4.6 ------	UNKNOWN
 94.8797  39.3038    2.6  27.5    4.0   0.4491   4.4 ------	UNKNOWN
 90.6437  46.9013    3.4  33.7   -6.6   0.4022   3.4 ------	UNKNOWN
 70.2058  16.2287    2.8  12.7  -93.4   0.3779   4.1 ------	UNKNOWN