Analysis Summary
Notes:
- 1) No attempt has been made to eliminate the non-significant decimal places.
- 2) This batgrbproduct analysis is done using the HEASARC data.
- 3) This batgrbproduct analysis is using the flight position for the mask-weighting calculation.
======================================================================
BAT GRB EVENT DATA PROCESSING REPORT
Process Script Ver: batgrbproduct v2.46
Process Start Time: Mon Jan 13 22:36:57 EST 2014
Host Name: batevent1
Current Working Dir: /local/data/batevent/batevent_reproc/trigger451901
======================================================================
Trigger: 00451901 Segment: 000
BAT Trigger Time: 325179722.752 [s; MET]
Trigger Stop: 325179722.88 [s; MET]
UTC: 2011-04-22T15:41:55.870640 [includes UTCF correction]
Where From?: TDRSS position message
BAT
RA: 111.994986280231 Dec: 75.1057497440089 [deg; J2000]
Catalogged Source?: NO
Point Source?: YES
GRB Indicated?: YES [ by BAT flight software ]
Image S/N Ratio: 7.19
Image Trigger?: NO
Rate S/N Ratio: 27.9463772249642 [ if not an image trigger ]
Image S/N Ratio: 7.19
Analysis Position: [ source = BAT ]
RA: 111.994986280231 Dec: 75.1057497440089 [deg; J2000]
Refined Position: [ source = BAT pre-slew burst ]
RA: 112.054744672371 Dec: 75.1000434192061 [deg; J2000]
{ 07h 28m 13.1s , +75d 06' 00.2" }
+/- 0.651622034702634 [arcmin] (estimated 90% radius based on SNR)
+/- 0.284183816267759 [arcmin] (formal 1-sigma fit error)
SNR: 56.083966410047
Angular difference between the analysis and refined position is 0.983307 arcmin
Partial Coding Fraction: 0.2265625 [ including projection effects ]
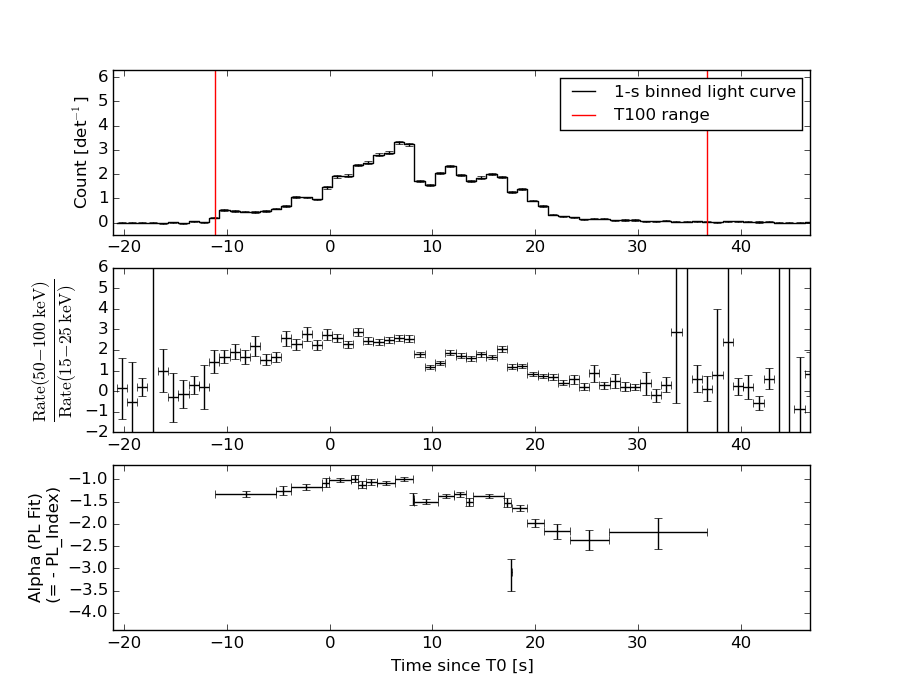
Duration
T90: 25.7839999198914 +/- 0.595449441244896
Measured from: -5.60399997234344
to: 20.1799999475479 [s; relative to TRIGTIME]
T50: 10.9319999217987 +/- 0.199719778713348
Measured from: 2.58000004291534
to: 13.5119999647141 [s; relative to TRIGTIME]
Fluence
Peak Flux (peak 1 second)
Measured from: 6.90400004386902
to: 7.90400004386902 [s; relative to TRIGTIME]
Total Fluence
Measured from: -11.1559999585152
to: 36.7600000500679 [s; relative to TRIGTIME]
Band 1 Band 2 Band 3 Band 4
15-25 25-50 50-100 100-350 keV
Total 9.998205 18.631905 18.505677 5.281088
0.122846 0.151919 0.149099 0.100399 [error]
Peak 0.499016 1.116053 1.337021 0.518001
0.024935 0.033911 0.038030 0.027883 [error]
[ fluence units of on-axis counts / fully illuminated detector ]
======================================================================
====== Table of the duration information =============================
Value tstart tstop
T100 47.916 -11.156 36.760
T90 25.784 -5.604 20.180
T50 10.932 2.580 13.512
Peak 1.000 6.904 7.904
====== Spectral Analysis Summary =====================================
Model : spectral model: simple power-law (PL) and cutoff power-law (CPL)
Ph_index : photon index: E^{Ph_index}
Ph_90err : 90% error of the photon index
Epeak : Epeak in keV
Epeak_90err: 90% error of Epeak
Norm : normalization at 50 keV in both the PL model and CPL model
Nomr_90err : 90% error of the normalization
chi2 : Chi-Squared
dof : degree of freedo
=== Time-averaged spectral analysis ===
(Best model with acceptable fit: CPL)
Model Ph_index Ph_90err_low Ph_90err_hi Epeak Epeak_90err_low Epeak_90err_hi Norm Nomr_90err_low Norm_90err_hi chi2 dof
PL -1.340 N/A N/A - - - 8.24e-02 N/A N/A 117.750 57
CPL -0.831 -0.105 0.107 147.995 -14.673 21.463 1.31e-01 -1.16e-02 1.29e-02 44.670 56
=== 1-s peak spectral analysis ===
(Best model with acceptable fit: PL)
Model Ph_index Ph_90err_low Ph_90err_hi Epeak Epeak_90err_low Epeak_90err_hi Norm Nomr_90err_low Norm_90err_hi chi2 dof
PL -0.969 -0.056 0.056 - - - 2.51e-01 -8.35e-03 8.33e-03 61.350 57
CPL -0.680 -0.223 0.234 276.948 -96.515 638.087 3.34e-01 -6.42e-02 8.32e-02 56.400 56
=== Fluence/Peak Flux Summary ===
Model Band1 Band2 Band3 Band4 Band5 Total
15-25 25-50 50-100 100-350 15-150 15-350 keV
Fluence PL 4.34e-06 8.80e-06 1.39e-05 4.87e-05 3.87e-05 7.58e-05 erg/cm2
90%_error_low N/A N/A N/A N/A N/A N/A erg/cm2
90%_error_hi N/A N/A N/A N/A N/A N/A erg/cm2
Peak flux PL 6.23e+00 8.61e+00 8.80e+00 1.64e+01 2.89e+01 4.00e+01 ph/cm2/s
90%_error_low -4.23e-01 -3.64e-01 -3.01e-01 -1.17e+00 -9.75e-01 -1.40e+00 ph/cm2/s
90%_error_hi 4.34e-01 3.62e-01 3.01e-01 1.23e+00 9.76e-01 1.42e+00 ph/cm2/s
Fluence CPL 3.66e-06 8.86e-06 1.49e-05 3.07e-05 3.83e-05 5.81e-05 erg/cm2
90%_error_low -1.75e-07 -1.71e-07 -2.69e-07 -2.56e-06 -5.26e-07 -2.56e-06 erg/cm2
90%_error_hi 1.78e-07 1.72e-07 2.70e-07 2.86e-06 5.25e-07 2.84e-06 erg/cm2
Peak flux CPL 5.73e+00 8.72e+00 9.16e+00 1.26e+01 2.86e+01 3.62e+01 ph/cm2/s
90%_error_low -5.47e-01 -3.81e-01 -4.03e-01 -2.25e+00 -9.93e-01 -2.46e+00 ph/cm2/s
90%_error_hi 5.63e-01 3.83e-01 4.06e-01 2.87e+00 9.94e-01 2.98e+00 ph/cm2/s
======================================================================
Image
Pre-slew 15.0-350.0 keV image (Event data)
#   RAcent    DECcent   POSerr    Theta     Phi              Peak Cts       SNR   Name
  112.0547    75.1000   0.0034    44.6590  -135.7440        58.9031983     56.084 TRIG_00451901

Foreground time interval of the image:
-11.156  36.760 (delta_t =  47.916 [sec])
Background time interval of the image:
-357.051 -289.696 (delta_t =  67.356 [sec])
-239.752 -11.156 (delta_t = 228.596 [sec])
Light Curves
Note: The mask-weighted lightcurves have units of either count/det or counts/sec/det, where a det is 0.4 x 0.4 = 0.16 sq cm.
Full-time range; 1 s binning
Other quick-look light curves:
- 64 ms binning (zoomed)
- 16 ms binning (zoomed)
- 8 ms binning (zoomed)
- 2 ms binning (zoomed)
- SN=5 or 10 s binning (full-time range)
- Raw light curve
Spectra
- 64 ms binning (zoomed)
- 16 ms binning (zoomed)
- 8 ms binning (zoomed)
- 2 ms binning (zoomed)
- SN=5 or 10 s binning (full-time range)
- Raw light curve
Spectra
Notes:
- 1) The fitting includes the systematic errors.
- 2) When the burst includes telescope slew time periods, the fitting uses an average response file made from multiple 5-s response files through out the slew time plus single time preiod for the non-slew times, and weighted by the total counts in the corresponding time period using addrmf. An average response file is needed becuase a spectral fit using the pre-slew DRM will introduce some errors in both a spectral shape and a normalization if the PHA file contains a lot of the slew/post-slew time interval.
- 3) For fits to more complicated models (e.g. a power-law over a cutoff power-law), the BAT team has decided to require a chi-square improvement of more than 6 for each extra dof.
Time averaged spectrum fit using the average DRM
Power-law model
Time interval is from  -11.156 sec. to   36.760 sec.

Spectral model in power-law:
------------------------------------------------------------
Parameters  : value       lower 90%   higher 90%
Photon index: -1.34     (       )
Norm@50keV  : 8.24251E-02    (     )
------------------------------------------------------------
#Fit statistic : Chi-Squared =         117.75 using 59 PHA bins.
# Reduced chi-squared =         2.0659 for     57 degrees of freedom
# Null hypothesis probability =   4.050404e-06

Photon flux (15-150 keV)    in 47.92 sec: 9.90980 (    ) ph/cm2/s
Energy fluence (15-150 keV)             : 3.86685e-05 ( 0  0 ) ergs/cm2
Cutoff power-law model
Time interval is from  -11.156 sec. to   36.760 sec.
Spectral model in the cutoff power-law:
------------------------------------------------------------
Parameters  : value       lower 90%   higher 90%
Photon index: -0.830896     ( -0.104973   0.107116 )
Epeak [keV] : 147.995      ( -14.6724 21.4632 )
Norm@50keV  : 0.130678    ( -0.0115538   0.0128828 )
------------------------------------------------------------
#Fit statistic : Chi-Squared =          44.67 using 59 PHA bins.
# Reduced chi-squared =         0.7977 for     56 degrees of freedom
# Null hypothesis probability =   8.618086e-01

Photon flux (15-150 keV)    in 47.92 sec: 9.54206 ( -0.17602  0.17705 ) ph/cm2/s
Energy fluence (15-150 keV)             : 3.83166e-05 ( -5.2573e-07  5.24983e-07 ) ergs/cm2
1-s peak spectrum fit
Power-law model
Time interval is from    6.904 sec. to    7.904 sec.

Spectral model in power-law:
------------------------------------------------------------
Parameters  : value       lower 90%   higher 90%
Photon index: -0.969015     ( -0.0555546   0.0559474 )
Norm@50keV  : 0.251201    ( -0.00834604   0.00833068 )
------------------------------------------------------------
#Fit statistic : Chi-Squared =          61.35 using 59 PHA bins.
# Reduced chi-squared =          1.076 for     57 degrees of freedom
# Null hypothesis probability =   3.227738e-01

Photon flux (15-150 keV)    in 1 sec: 28.8794 ( -0.9751  0.9759 ) ph/cm2/s
Energy fluence (15-150 keV)             : 2.74707e-06 ( -9.47862e-08  9.49688e-08 ) ergs/cm2
Cutoff power-law model
Time interval is from    6.904 sec. to    7.904 sec.
Spectral model in the cutoff power-law:
------------------------------------------------------------
Parameters  : value       lower 90%   higher 90%
Photon index: -0.680223     ( -0.222637   0.234004 )
Epeak [keV] : 276.948      ( -96.5161 638.085 )
Norm@50keV  : 0.333578    ( -0.0641857   0.0832246 )
------------------------------------------------------------
#Fit statistic : Chi-Squared =          56.40 using 59 PHA bins.
# Reduced chi-squared =          1.007 for     56 degrees of freedom
# Null hypothesis probability =   4.599092e-01

Photon flux (15-150 keV)    in 1 sec: 28.6159 ( -0.9927  0.994 ) ph/cm2/s
Energy fluence (15-150 keV)             : 2.73036e-06 ( -9.70014e-08  9.67975e-08 ) ergs/cm2
Time-resolved spectra
Distribution
T90 vs. Hardness ratio plot
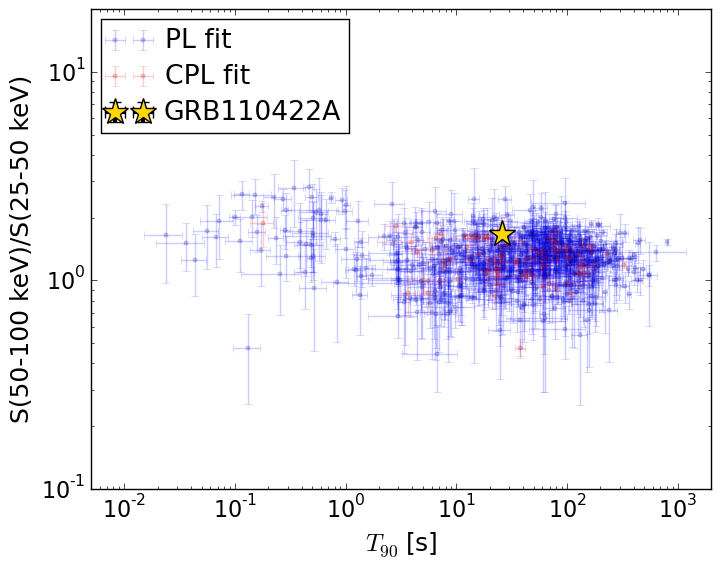
T90                                   = 25.784 sec.
Hardness ratio (energy fluence ratio) = 1.67718135098
S(15-50 keV) vs. S(50-150 keV) plot
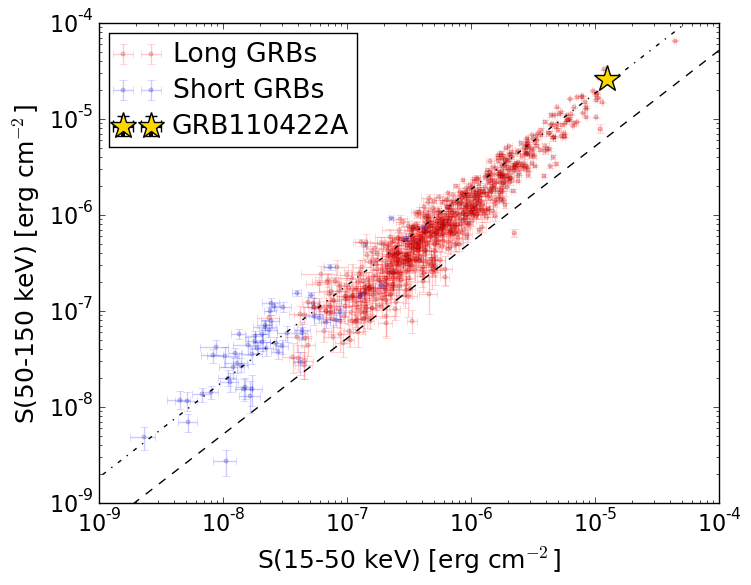
S(15-50 keV)  = 1.2518173e-05
S(50-150 keV) = 2.57982e-05
The dash-dotted line and the dashed line traces the fluences calculated from the Band function with Epeak = 15 and 150 keV, respectively. Both lines assume a canonical values of alpha = -1 and beta = -2.5.
Mask shadow pattern
IMX = -7.077538567061747E-01, IMY = 6.896085308524967E-01
Spacecraft aspect plot
Bright source in the pre-burst/pre-slew/post-slew images
Pre-burst image of 15-350 keV band
Time interval of the image:
-357.051400 -289.695600
-239.752000 -11.156000

# RAcent  DECcent POSerr Theta    Phi  PeakCts   SNR AngSep     Name
#  [deg]    [deg]    ['] [deg]  [deg]                   [']
254.4365  35.3552    1.3  22.3   51.2   2.0883   8.6    1.3	Her X-1
288.8255  10.8677    7.1  54.8   10.9   1.5926   1.6    4.9	GRS 1915+105
299.5980  35.1912    0.8  39.0  -18.2   3.8512  13.7    0.7	Cyg X-1
308.1062  41.0022    2.0  39.2  -32.3   1.8130   5.8    3.0	Cyg X-3
318.8288  26.1378    3.2  56.3  -28.3   3.8259   3.6 ------	UNKNOWN
327.7452  41.7092    2.8  49.1  -48.0   4.2081   4.1 ------	UNKNOWN
Pre-slew background subtracted image of 15-350 keV band
Time interval of the image:
-11.156000 36.760000

# RAcent  DECcent POSerr Theta    Phi  PeakCts   SNR AngSep     Name
#  [deg]    [deg]    ['] [deg]  [deg]                   [']
254.7002  35.3686   19.7  22.3   50.6   0.1497   0.6   12.0	Her X-1
288.7957  10.9447   36.3  54.7   10.9   0.2920   0.3    0.2	GRS 1915+105
299.6107  35.2057  183.8  39.0  -18.2  -0.0276  -0.1    1.0	Cyg X-1
308.1204  40.8057    5.9  39.3  -32.0   1.1211   2.0    8.8	Cyg X-3
233.3945  46.5055    3.4  15.5  110.2   0.9929   3.4 ------	UNKNOWN
146.7516  55.8934    3.1  51.4 -165.9   3.1038   3.8 ------	UNKNOWN
152.6195  74.4479    3.1  37.7 -147.6   1.8446   3.8 ------	UNKNOWN
319.5743  73.6370    2.8  30.0  -90.4   2.5615   4.2 ------	UNKNOWN
112.0548  75.1000    0.2  44.7 -135.7  58.9019  56.1 ------	UNKNOWN
Post-slew image of 15-350 keV band
Time interval of the image:
803.048600 962.306400

# RAcent  DECcent POSerr Theta    Phi  PeakCts   SNR AngSep     Name
#  [deg]    [deg]    ['] [deg]  [deg]                   [']
229.4232  54.9050    2.6  43.7   52.3   2.5913   4.4 ------	UNKNOWN
190.5380  66.8996    2.2  24.6   72.0   1.0326   5.3 ------	UNKNOWN
266.9600  65.8066    2.3  38.2   21.0   1.1384   5.1 ------	UNKNOWN
286.8404  52.9584    3.1  51.9    8.7   1.6036   3.7 ------	UNKNOWN
121.4171  34.7680    3.5  40.6  172.8   0.7992   3.3 ------	UNKNOWN
112.3095  17.1233    2.4  58.0 -175.6   3.7773   4.7 ------	UNKNOWN