Analysis Summary
Notes:
- 1) No attempt has been made to eliminate the non-significant decimal places.
- 2) This batgrbproduct analysis is done using the HEASARC data.
- 3) This batgrbproduct analysis is using the flight position for the mask-weighting calculation.
======================================================================
BAT GRB EVENT DATA PROCESSING REPORT
Process Script Ver: batgrbproduct v2.46
Process Start Time: Mon Jan 13 22:23:22 EST 2014
Host Name: batevent1
Current Working Dir: /local/data/batevent/batevent_reproc/trigger453628
======================================================================
Trigger: 00453628 Segment: 000
BAT Trigger Time: 327463943.68 [s; MET]
Trigger Stop: 327463944.704 [s; MET]
UTC: 2011-05-19T02:12:16.711700 [includes UTCF correction]
Where From?: TDRSS position message
BAT
RA: 261.628977846193 Dec: -23.4083422668494 [deg; J2000]
Catalogged Source?: NO
Point Source?: YES
GRB Indicated?: YES [ by BAT flight software ]
Image S/N Ratio: 21.44
Image Trigger?: NO
Rate S/N Ratio: 40.8778668719394 [ if not an image trigger ]
Image S/N Ratio: 21.44
Analysis Position: [ source = BAT ]
RA: 261.628977846193 Dec: -23.4083422668494 [deg; J2000]
Refined Position: [ source = BAT pre-slew burst ]
RA: 261.636957603195 Dec: -23.4262458176008 [deg; J2000]
{ 17h 26m 32.9s , -23d 25' 34.5" }
+/- 0.692641884703782 [arcmin] (estimated 90% radius based on SNR)
+/- 0.182376804195443 [arcmin] (formal 1-sigma fit error)
SNR: 51.3999885860812
Angular difference between the analysis and refined position is 1.160587 arcmin
Partial Coding Fraction: 0.5078125 [ including projection effects ]
Duration
T90: 27.1839999556541 +/- 2.98085629047885
Measured from: -2.61599999666214
to: 24.567999958992 [s; relative to TRIGTIME]
T50: 10.135999917984 +/- 0.637695861456503
Measured from: 0.76800000667572
to: 10.9039999246597 [s; relative to TRIGTIME]
Fluence
Peak Flux (peak 1 second)
Measured from: 2.34799998998642
to: 3.34799998998642 [s; relative to TRIGTIME]
Total Fluence
Measured from: -4.14800000190735
to: 37.7599999904633 [s; relative to TRIGTIME]
Band 1 Band 2 Band 3 Band 4
15-25 25-50 50-100 100-350 keV
Total 2.776179 3.022404 1.423837 0.266645
0.065012 0.063215 0.052845 0.043201 [error]
Peak 0.188319 0.228446 0.110192 0.018894
0.011848 0.012010 0.009883 0.006925 [error]
[ fluence units of on-axis counts / fully illuminated detector ]
======================================================================
====== Table of the duration information =============================
Value tstart tstop
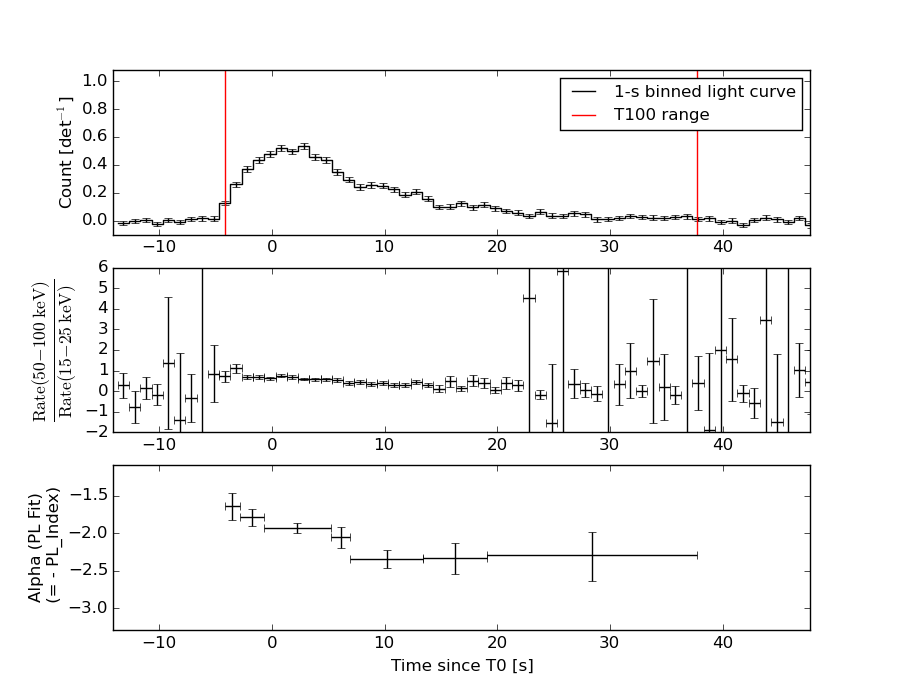
T100 41.908 -4.148 37.760
T90 27.184 -2.616 24.568
T50 10.136 0.768 10.904
Peak 1.000 2.348 3.348
====== Spectral Analysis Summary =====================================
Model : spectral model: simple power-law (PL) and cutoff power-law (CPL)
Ph_index : photon index: E^{Ph_index}
Ph_90err : 90% error of the photon index
Epeak : Epeak in keV
Epeak_90err: 90% error of Epeak
Norm : normalization at 50 keV in both the PL model and CPL model
Nomr_90err : 90% error of the normalization
chi2 : Chi-Squared
dof : degree of freedo
=== Time-averaged spectral analysis ===
(Best model with acceptable fit: PL)
Model Ph_index Ph_90err_low Ph_90err_hi Epeak Epeak_90err_low Epeak_90err_hi Norm Nomr_90err_low Norm_90err_hi chi2 dof
PL -2.088 -0.063 0.062 - - - 1.02e-02 -3.45e-04 3.43e-04 49.690 57
CPL -2.085 -0.150 0.059 9999.360 N/A N/A 1.02e-02 N/A N/A 49.720 56
=== 1-s peak spectral analysis ===
(Best model with acceptable fit: N/A)
Model Ph_index Ph_90err_low Ph_90err_hi Epeak Epeak_90err_low Epeak_90err_hi Norm Nomr_90err_low Norm_90err_hi chi2 dof
PL -1.931 -0.117 0.114 - - - 3.16e-02 -2.41e-03 2.38e-03 74.820 57
CPL -1.171 -0.482 0.551 48.389 -8.274 14.398 8.33e-02 -3.77e-02 8.46e-02 67.070 56
=== Fluence/Peak Flux Summary ===
Model Band1 Band2 Band3 Band4 Band5 Total
15-25 25-50 50-100 100-350 15-150 15-350 keV
Fluence PL 9.52e-07 1.22e-06 1.15e-06 1.91e-06 3.97e-06 5.24e-06 erg/cm2
90%_error_low -5.08e-08 -3.80e-08 -5.44e-08 -1.87e-07 -1.25e-07 -2.32e-07 erg/cm2
90%_error_hi 5.18e-08 3.80e-08 5.45e-08 2.01e-07 1.26e-07 2.41e-07 erg/cm2
Peak flux PL 1.97e+00 1.54e+00 8.07e-01 6.13e-01 4.59e+00 4.93e+00 ph/cm2/s
90%_error_low -1.93e-01 -1.02e-01 -7.95e-02 -1.09e-01 -3.07e-01 -3.24e-01 ph/cm2/s
90%_error_hi 1.97e-01 1.02e-01 7.96e-02 1.22e-01 3.07e-01 3.24e-01 ph/cm2/s
Fluence CPL N/A N/A N/A N/A N/A N/A erg/cm2
90%_error_low -5.08e-08 -3.80e-08 -5.44e-08 -1.87e-07 -1.25e-07 -2.32e-07 erg/cm2
90%_error_hi 5.18e-08 3.80e-08 5.45e-08 2.01e-07 1.26e-07 2.41e-07 erg/cm2
Peak flux CPL 1.79e+00 1.67e+00 8.22e-01 2.56e-01 4.47e+00 4.54e+00 ph/cm2/s
90%_error_low -2.23e-01 -1.32e-01 -9.08e-02 -1.12e-01 -3.17e-01 -3.42e-01 ph/cm2/s
90%_error_hi 2.25e-01 1.35e-01 8.99e-02 1.84e-01 3.17e-01 3.56e-01 ph/cm2/s
======================================================================
Image
Pre-slew 15.0-350.0 keV image (Event data)
#   RAcent    DECcent   POSerr    Theta     Phi              Peak Cts       SNR   Name
  261.6370   -23.4262   0.0037    24.0818    98.6174         7.6999045     51.400 TRIG_00453628

Foreground time interval of the image:
 -4.148  37.760 (delta_t =  41.908 [sec])
Background time interval of the image:
-239.680  -4.148 (delta_t = 235.532 [sec])
Light Curves
Note: The mask-weighted lightcurves have units of either count/det or counts/sec/det, where a det is 0.4 x 0.4 = 0.16 sq cm.
Full-time range; 1 s binning
Other quick-look light curves:
- 64 ms binning (zoomed)
- 16 ms binning (zoomed)
- 8 ms binning (zoomed)
- 2 ms binning (zoomed)
- SN=5 or 10 s binning (full-time range)
- Raw light curve
Spectra
- 64 ms binning (zoomed)
- 16 ms binning (zoomed)
- 8 ms binning (zoomed)
- 2 ms binning (zoomed)
- SN=5 or 10 s binning (full-time range)
- Raw light curve
Spectra
Notes:
- 1) The fitting includes the systematic errors.
- 2) When the burst includes telescope slew time periods, the fitting uses an average response file made from multiple 5-s response files through out the slew time plus single time preiod for the non-slew times, and weighted by the total counts in the corresponding time period using addrmf. An average response file is needed becuase a spectral fit using the pre-slew DRM will introduce some errors in both a spectral shape and a normalization if the PHA file contains a lot of the slew/post-slew time interval.
- 3) For fits to more complicated models (e.g. a power-law over a cutoff power-law), the BAT team has decided to require a chi-square improvement of more than 6 for each extra dof.
Time averaged spectrum fit using the average DRM
Power-law model
Time interval is from   -4.148 sec. to   37.760 sec.

Spectral model in power-law:
------------------------------------------------------------
Parameters  : value       lower 90%   higher 90%
Photon index: -2.08813     ( -0.0629512   0.0623051 )
Norm@50keV  : 1.02074E-02    ( -0.000344844   0.000343109 )
------------------------------------------------------------
#Fit statistic : Chi-Squared =          49.69 using 59 PHA bins.
# Reduced chi-squared =         0.8718 for     57 degrees of freedom
# Null hypothesis probability =   7.430047e-01

Photon flux (15-150 keV)    in 41.91 sec: 1.59667 ( -0.0543  0.05457 ) ph/cm2/s
Energy fluence (15-150 keV)             : 3.97089e-06 ( -1.25257e-07  1.25562e-07 ) ergs/cm2
Cutoff power-law model
Time interval is from   -4.148 sec. to   37.760 sec.
Spectral model in the cutoff power-law:
------------------------------------------------------------
Parameters  : value       lower 90%   higher 90%
Photon index: -2.08489     ( -0.149269   0.0595235 )
Epeak [keV] : 9999.36      (   )
Norm@50keV  : 1.02298E-02    (     )
------------------------------------------------------------
#Fit statistic : Chi-Squared =          49.71 using 59 PHA bins.
# Reduced chi-squared =         0.8878 for     56 degrees of freedom
# Null hypothesis probability =   7.102294e-01

Photon flux (15-150 keV)    in 41.91 sec: 1.55929 ( -0.06229  0.0626 ) ph/cm2/s
Energy fluence (15-150 keV)             : 0 ( 0  0 ) ergs/cm2
1-s peak spectrum fit
Power-law model
Time interval is from    2.348 sec. to    3.348 sec.

Spectral model in power-law:
------------------------------------------------------------
Parameters  : value       lower 90%   higher 90%
Photon index: -1.93051     ( -0.117274   0.114063 )
Norm@50keV  : 3.15897E-02    ( -0.00240885   0.00238251 )
------------------------------------------------------------
#Fit statistic : Chi-Squared =          74.82 using 59 PHA bins.
# Reduced chi-squared =          1.313 for     57 degrees of freedom
# Null hypothesis probability =   5.678196e-02

Photon flux (15-150 keV)    in 1 sec: 4.59361 ( -0.30726  0.30749 ) ph/cm2/s
Energy fluence (15-150 keV)             : 2.9061e-07 ( -2.15681e-08  2.17461e-08 ) ergs/cm2
Cutoff power-law model
Time interval is from    2.348 sec. to    3.348 sec.
Spectral model in the cutoff power-law:
------------------------------------------------------------
Parameters  : value       lower 90%   higher 90%
Photon index: -1.17117     ( -0.48208   0.551012 )
Epeak [keV] : 48.3888      ( -8.27418 14.3984 )
Norm@50keV  : 8.33099E-02    ( -0.0376907   0.0845842 )
------------------------------------------------------------
#Fit statistic : Chi-Squared =          67.07 using 59 PHA bins.
# Reduced chi-squared =          1.198 for     56 degrees of freedom
# Null hypothesis probability =   1.478306e-01

Photon flux (15-150 keV)    in 1 sec: 4.47004 ( -0.31708  0.31702 ) ph/cm2/s
Energy fluence (15-150 keV)             : 0 ( 0  0 ) ergs/cm2
Time-resolved spectra
Distribution
T90 vs. Hardness ratio plot
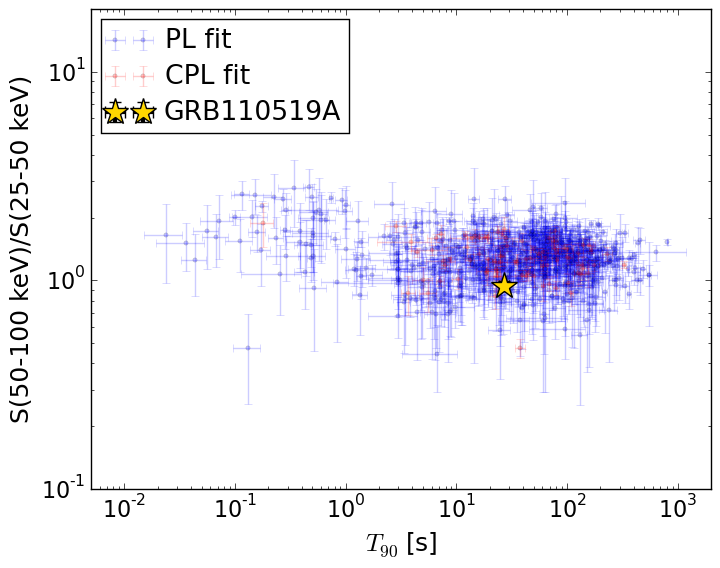
T90                                   = 27.184 sec.
Hardness ratio (energy fluence ratio) = 0.940784419067
S(15-50 keV) vs. S(50-150 keV) plot
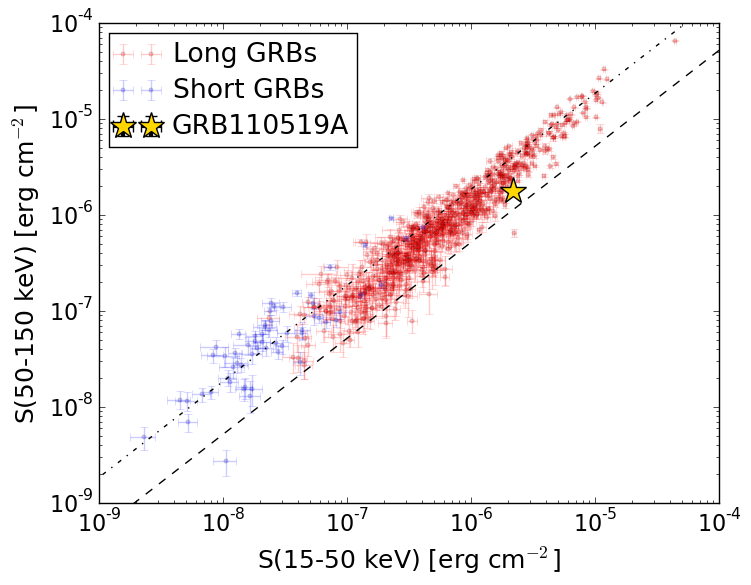
S(15-50 keV)  = 2.1766054e-06
S(50-150 keV) = 1.794331e-06
The dash-dotted line and the dashed line traces the fluences calculated from the Band function with Epeak = 15 and 150 keV, respectively. Both lines assume a canonical values of alpha = -1 and beta = -2.5.
Mask shadow pattern
IMX = -6.696747458899358E-02, IMY = -4.418953155461618E-01
Spacecraft aspect plot
Bright source in the pre-burst/pre-slew/post-slew images
Pre-burst image of 15-350 keV band
Time interval of the image:
-239.680000 -4.148000

# RAcent  DECcent POSerr Theta    Phi  PeakCts   SNR AngSep     Name
#  [deg]    [deg]    ['] [deg]  [deg]                   [']
255.7369 -37.8593    0.0  22.4   59.4  -0.3459  -1.3   11.9	4U 1700-377
256.4161 -36.4693    3.4  22.1   63.3   0.9056   3.4    2.9	GX 349+2
262.9761 -24.5623   19.7  22.4   98.5   0.1776   0.6   11.1	GX 1+4
264.9476 -44.4238    7.7  15.8   37.7   0.3328   1.5    8.9	4U 1735-44
268.3674  -1.4542   23.2  39.2  132.7   0.3110   0.5    0.1	SW J1753.5-0127
270.2682 -25.0668    3.9  17.4  111.5   0.7380   3.0    1.1	GX 5-1
270.1250 -25.7214    7.3  17.0  109.8   0.4065   1.6    9.7	GRS 1758-258
274.0063 -14.0343   39.5  25.5  134.7   0.0790   0.3    0.1	GX 17+2
276.0105 -30.3571    4.9  10.1  113.9   0.5178   2.4    4.5	H1820-303
285.1118 -24.7866    8.1  13.1  161.9   0.3339   1.4    9.0	HT1900.1-2455
288.6712  10.9311    3.8  49.0  164.0   1.9959   3.0    7.5	GRS 1915+105
262.8539 -33.9311   65.2  17.7   74.6  -0.0469  -0.2    8.9	GX 354-0
241.2671 -59.0157    3.3  34.5   16.4   1.0342   3.5 ------	UNKNOWN
161.5882 -88.7304    2.7  52.8  -20.5   2.7155   4.2 ------	UNKNOWN
346.2484 -83.3922    2.2  49.3  -29.5   2.6051   5.3 ------	UNKNOWN
339.0685 -45.0037    2.6  41.0  -83.8   6.1994   4.5 ------	UNKNOWN
333.7732 -26.4437    4.2  43.0 -112.2   3.6249   2.7 ------	UNKNOWN
330.1352  -8.2026    3.0  50.9 -135.4   5.8785   3.9 ------	UNKNOWN
Pre-slew background subtracted image of 15-350 keV band
Time interval of the image:
-4.148000 37.760000

# RAcent  DECcent POSerr Theta    Phi  PeakCts   SNR AngSep     Name
#  [deg]    [deg]    ['] [deg]  [deg]                   [']
256.0732 -37.7156    4.2  22.1   59.9  -0.3696  -2.7    8.7	4U 1700-377
256.6766 -36.4029   10.6  21.9   63.6   0.1527   1.1   11.7	GX 349+2
263.0295 -24.6090   13.5  22.3   98.5  -0.1211  -0.9    8.3	GX 1+4
265.0240 -44.4121    0.0  15.8   37.7  -0.2627  -2.4   12.3	4U 1735-44
268.3965  -1.4784    5.1  39.2  132.7   0.5975   2.3    2.3	SW J1753.5-0127
270.1971 -25.1294   14.3  17.4  111.2  -0.0961  -0.8    5.6	GX 5-1
270.3244 -25.8612    4.9  16.8  109.9  -0.2751  -2.4    7.2	GRS 1758-258
274.1575 -13.9515    3.7  25.5  135.1   0.4433   3.1   10.2	GX 17+2
276.1578 -30.3005    0.0  10.1  114.6   0.0175   0.2   12.7	H1820-303
285.0449 -24.9215   31.5  13.0  161.7  -0.0368  -0.4    0.5	HT1900.1-2455
288.9096  11.0679   23.0  49.2  164.3   0.1637   0.5    9.8	GRS 1915+105
263.0445 -33.9162   31.8  17.5   74.9  -0.0476  -0.4    5.6	GX 354-0
255.4561  -8.9650    1.7  38.8  108.9   2.4865   6.7 ------	UNKNOWN
261.6370 -23.4262    0.2  24.1   98.6   7.6992  51.1 ------	UNKNOWN
197.0454 -75.2655    2.2  52.8   -3.2   1.5754   5.1 ------	UNKNOWN
  2.5407 -72.1826    2.5  50.7  -44.6   1.9961   4.6 ------	UNKNOWN
351.8269 -65.7016    2.4  46.9  -53.2   1.7160   4.8 ------	UNKNOWN
334.5148 -30.0963    2.4  41.9 -107.0   1.6699   4.8 ------	UNKNOWN
Post-slew image of 15-350 keV band
Time interval of the image:
224.820590 962.415100

# RAcent  DECcent POSerr Theta    Phi  PeakCts   SNR AngSep     Name
#  [deg]    [deg]    ['] [deg]  [deg]                   [']
 34.5808 -56.8957    3.4  45.8   38.1   4.5865   3.3 ------	UNKNOWN
 51.7303 -30.2509    3.1  34.9   -4.7   2.0104   3.7 ------	UNKNOWN
 73.7304 -25.9709    3.4  52.8  -17.1   3.5536   3.4 ------	UNKNOWN
 70.0275 -22.3136    3.3  49.3  -21.5   3.1829   3.5 ------	UNKNOWN
 78.7984 -18.4159    4.4  57.5  -26.3   7.3742   2.6 ------	UNKNOWN
  2.8954  40.5360    4.8  55.3 -145.2   8.3914   2.5 ------	UNKNOWN
 69.8453  -4.6791    3.9  50.7  -44.5   6.9282   3.0 ------	UNKNOWN
 33.0565  28.2731    3.2  43.1 -112.2   8.1569   3.6 ------	UNKNOWN