Analysis Summary
Notes:
- 1) No attempt has been made to eliminate the non-significant decimal places.
- 2) This batgrbproduct analysis is done using the HEASARC data.
- 3) This batgrbproduct analysis is using the flight position for the mask-weighting calculation.
======================================================================
                  BAT GRB EVENT DATA PROCESSING REPORT
    Process Script Ver: batgrbproduct v2.46
    Process Start Time: Mon Jan 13 22:19:45 EST 2014
             Host Name: batevent1
   Current Working Dir: /local/data/batevent/batevent_reproc/trigger453747
======================================================================

  Trigger: 00453747      Segment: 000

  BAT Trigger Time: 327616135.168   [s; MET]
      Trigger Stop: 327616137.216   [s; MET]
               UTC: 2011-05-20T20:28:48.193920    [includes UTCF correction]
       Where From?: TDRSS position message

  BAT
    RA: 134.375117604516   Dec: 56.401895388955  [deg; J2000]

     Catalogged Source?: NO
     Point Source?:      YES
     GRB Indicated?:     YES    [ by BAT flight software ]
     Image S/N Ratio:    7.87
     Image Trigger?:     NO
     Rate S/N Ratio:     15.9059737205869  [ if not an image trigger ]
     Image S/N Ratio:    7.87

  Analysis Position:   [ source = BAT ]
    RA: 134.375117604516   Dec: 56.401895388955  [deg; J2000]

  Refined Position:   [ source = BAT pre-slew burst ]
    RA: 134.359584878478   Dec: 56.4210944883302  [deg; J2000]
        { 08h 57m 26.3s , +56d 25' 15.9" }
         +/- 1.19479743924927 [arcmin] (estimated 90% radius based on SNR)
         +/- 0.359074980866218 [arcmin] (formal 1-sigma fit error)
    SNR: 23.5883723976126

  Angular difference between the analysis and refined position is 1.262065 arcmin

  Partial Coding Fraction: 0.6953125    [ including projection effects ]

  Duration
     T90: 20.8640000224113 +/- 5.36723098024146
        Measured from: -0.191999971866608
                   to: 20.6720000505447     [s; relative to TRIGTIME]
     T50: 8.95999997854233 +/- 1.51721854264313
        Measured from: 2.75200003385544
                   to: 11.7120000123978     [s; relative to TRIGTIME]


  Fluence
     Peak Flux  (peak 1 second)
        Measured from: 4.14000004529953
                   to: 5.14000004529953     [s; relative to TRIGTIME]
     Total Fluence
        Measured from: -1.15200001001358
                   to: 26.4959999918938     [s; relative to TRIGTIME]

             Band 1     Band 2     Band 3     Band 4
              15-25      25-50     50-100    100-350     keV
 Total     0.332642   0.625974   0.545709   0.165336
           0.036730   0.038611   0.034896   0.030042 [error]
 Peak      0.026936   0.043987   0.049045   0.013078
           0.006987   0.007632   0.007071   0.006036 [error]

     [ fluence units of on-axis counts / fully illuminated detector ]

======================================================================


====== Table of the duration information =============================

        Value   tstart    tstop
T100   27.648   -1.152   26.496
T90    20.864   -0.192   20.672
T50     8.960    2.752   11.712
Peak    1.000    4.140    5.140


====== Spectral Analysis Summary =====================================

Model      : spectral model: simple power-law (PL) and cutoff power-law (CPL)
Ph_index   : photon index: E^{Ph_index}
Ph_90err   : 90% error of the photon index
Epeak      : Epeak in keV
Epeak_90err: 90% error of Epeak
Norm       : normalization at 50 keV in both the PL model and CPL model
Nomr_90err : 90% error of the normalization
chi2       : Chi-Squared
dof        : degree of freedo

=== Time-averaged spectral analysis ===
(Best model with acceptable fit: PL)

Model Ph_index Ph_90err_low Ph_90err_hi  Epeak  Epeak_90err_low  Epeak_90err_hi  Norm       Nomr_90err_low    Norm_90err_hi    chi2    dof
PL      -1.209    -0.117      0.118       -           -               -         4.15e-03     -2.77e-04          2.77e-04      51.070   57
CPL     -0.883    -0.378      0.513      185.639     -82.172      -185.639      5.91e-03     -1.92e-03          4.23e-03      49.630   56


=== 1-s peak spectral analysis ===
(Best model with acceptable fit: PL)

Model Ph_index Ph_90err_low Ph_90err_hi  Epeak  Epeak_90err_low  Epeak_90err_hi  Norm       Nomr_90err_low    Norm_90err_hi    chi2    dof
PL      -1.073     -0.278     0.292       -           -               -         9.37e-03     -1.49e-03          1.49e-03      42.670   57
CPL     -1.079     -0.269     0.351     9999.360    -9999.360      -9999.360      9.42e-03     -1.48e-03          1.67e-02      42.680   56


=== Fluence/Peak Flux Summary ===

              Model    Band1     Band2     Band3     Band4     Band5     Total
                       15-25     25-50    50-100    100-350    15-150    15-350    keV
Fluence         PL   1.12e-07  2.45e-07  4.24e-07  1.70e-06  1.16e-06  2.48e-06   erg/cm2
      90%_error_low -1.43e-08 -1.92e-08 -3.32e-08 -2.82e-07 -8.42e-08 -3.04e-07   erg/cm2
      90%_error_hi   1.49e-08  1.90e-08  3.31e-08  3.20e-07  8.47e-08  3.36e-07   erg/cm2
Peak flux       PL   2.57e-01  3.33e-01  3.17e-01  5.33e-01  1.08e+00  1.44e+00   ph/cm2/s
      90%_error_low -7.98e-02 -6.70e-02 -5.57e-02 -1.79e-01 -1.77e-01 -2.41e-01   ph/cm2/s
      90%_error_hi   8.84e-02  6.50e-02  5.48e-02  2.32e-01  1.78e-01  2.50e-01   ph/cm2/s

Fluence        CPL   1.04e-07  2.52e-07  4.37e-07  1.08e-06  1.14e-06  1.87e-06   erg/cm2
      90%_error_low -1.76e-08 -2.16e-08 -3.79e-08 -4.86e-07 -9.22e-08 -4.86e-07   erg/cm2
      90%_error_hi   1.81e-08  2.21e-08  3.86e-08  7.19e-07  9.13e-08  7.23e-07   erg/cm2
Peak flux      CPL   2.63e-01  3.33e-01  3.16e-01  5.30e-01  1.09e+00  1.46e+00   ph/cm2/s
      90%_error_low -9.32e-02 -3.47e-02 -5.48e-02     N/A   -1.92e-01 -2.53e-01   ph/cm2/s
      90%_error_hi   7.52e-02  7.04e-02  6.43e-02     N/A    1.84e-01  2.17e-01   ph/cm2/s

======================================================================
Image
Pre-slew 15.0-350.0 keV image (Event data)
#   RAcent    DECcent   POSerr    Theta     Phi              Peak Cts       SNR   Name
  134.3596    56.4211   0.0082    30.1286    14.8159         1.7198390     23.588 TRIG_00453747

Foreground time interval of the image:
 -1.152  25.533 (delta_t =  26.685 [sec])
Background time interval of the image:
-239.168  -1.152 (delta_t = 238.016 [sec])
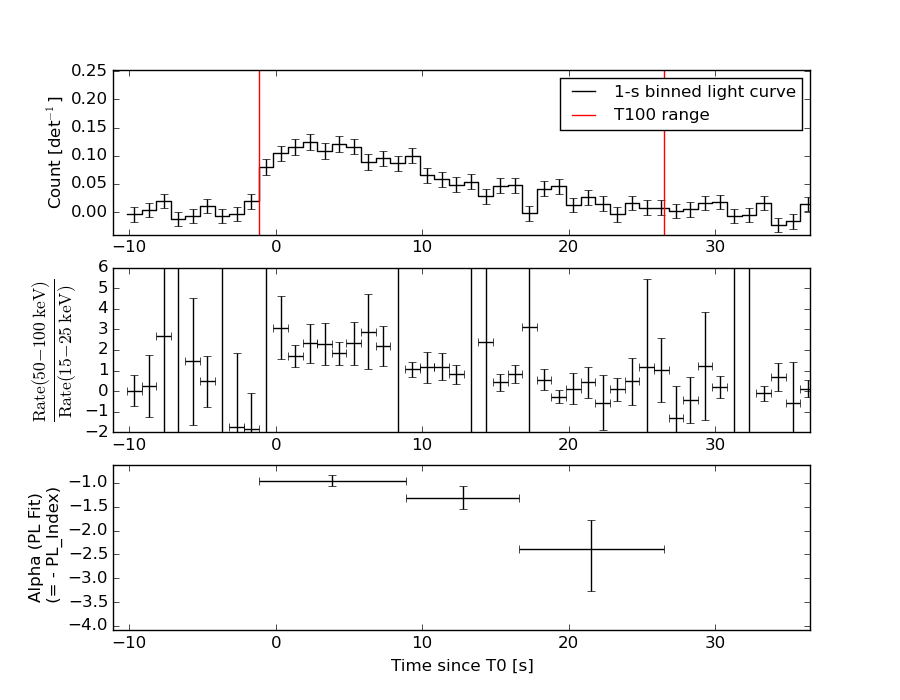
Light Curves
Note: The mask-weighted lightcurves have units of either count/det or counts/sec/det, where a det is 0.4 x 0.4 = 0.16 sq cm.
Full-time range; 1 s binning
Other quick-look light curves:
Spectra
Notes:
- 1) The fitting includes the systematic errors.
- 2) When the burst includes telescope slew time periods, the fitting uses an average response file made from multiple 5-s response files through out the slew time plus single time preiod for the non-slew times, and weighted by the total counts in the corresponding time period using addrmf. An average response file is needed becuase a spectral fit using the pre-slew DRM will introduce some errors in both a spectral shape and a normalization if the PHA file contains a lot of the slew/post-slew time interval.
- 3) For fits to more complicated models (e.g. a power-law over a cutoff power-law), the BAT team has decided to require a chi-square improvement of more than 6 for each extra dof.
Time averaged spectrum fit using the average DRM
Power-law model
Time interval is from   -1.152 sec. to   26.496 sec.

Spectral model in power-law:
------------------------------------------------------------
Parameters  : value       lower 90%   higher 90%
Photon index: -1.20924     ( -0.116885   0.118338 )
Norm@50keV  : 4.15141E-03    ( -0.000276928   0.00027683 )
------------------------------------------------------------
#Fit statistic : Chi-Squared =          51.07 using 59 PHA bins.
# Reduced chi-squared =         0.8959 for     57 degrees of freedom
# Null hypothesis probability =   6.960511e-01

Photon flux (15-150 keV)    in 27.65 sec: 0.487936 ( -0.033957  0.034028 ) ph/cm2/s
Energy fluence (15-150 keV)             : 1.16168e-06 ( -8.4231e-08  8.46599e-08 ) ergs/cm2
Cutoff power-law model
Time interval is from   -1.152 sec. to   26.496 sec.
Spectral model in the cutoff power-law:
------------------------------------------------------------
Parameters  : value       lower 90%   higher 90%
Photon index: -0.882772     ( -0.377945   0.513239 )
Epeak [keV] : 185.639      ( -82.1833 -185.65 )
Norm@50keV  : 5.91483E-03    ( -0.0019238   0.00422566 )
------------------------------------------------------------
#Fit statistic : Chi-Squared =          49.63 using 59 PHA bins.
# Reduced chi-squared =         0.8862 for     56 degrees of freedom
# Null hypothesis probability =   7.131925e-01

Photon flux (15-150 keV)    in 27.65 sec: 0.480747 ( -0.035487  0.035482 ) ph/cm2/s
Energy fluence (15-150 keV)             : 1.13803e-06 ( -9.21928e-08  9.13445e-08 ) ergs/cm2
1-s peak spectrum fit
Power-law model
Time interval is from    4.140 sec. to    5.140 sec.

Spectral model in power-law:
------------------------------------------------------------
Parameters  : value       lower 90%   higher 90%
Photon index: -1.07331     ( -0.278272   0.29191 )
Norm@50keV  : 9.37467E-03    ( -0.00149089   0.00148533 )
------------------------------------------------------------
#Fit statistic : Chi-Squared =          42.67 using 59 PHA bins.
# Reduced chi-squared =         0.7486 for     57 degrees of freedom
# Null hypothesis probability =   9.207944e-01

Photon flux (15-150 keV)    in 1 sec: 1.08476 ( -0.177196  0.17794 ) ph/cm2/s
Energy fluence (15-150 keV)             : 9.88758e-08 ( -1.69633e-08  1.70927e-08 ) ergs/cm2
Cutoff power-law model
Time interval is from    4.140 sec. to    5.140 sec.
Spectral model in the cutoff power-law:
------------------------------------------------------------
Parameters  : value       lower 90%   higher 90%
Photon index: -1.07927     ( -0.273612   0.346258 )
Epeak [keV] : 9999.36      ( -9999.36 -9999.36 )
Norm@50keV  : 9.42247E-03    ( -0.00147432   0.0166643 )
------------------------------------------------------------
#Fit statistic : Chi-Squared =          42.68 using 59 PHA bins.
# Reduced chi-squared =         0.7622 for     56 degrees of freedom
# Null hypothesis probability =   9.049928e-01

Photon flux (15-150 keV)    in 1 sec: 1.08818 ( -0.192089  0.18424 ) ph/cm2/s
Energy fluence (15-150 keV)             : 9.92796e-08 ( -1.88992e-08  1.79966e-08 ) ergs/cm2
Time-resolved spectra
Distribution
T90 vs. Hardness ratio plot
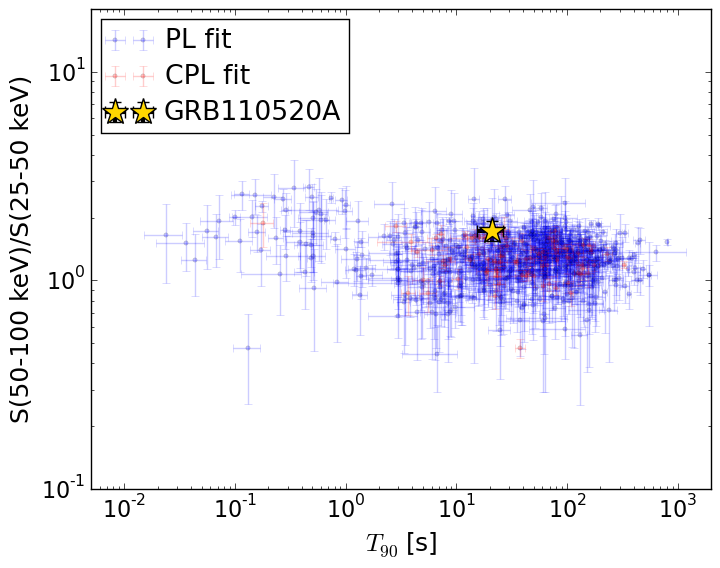
T90                                   = 20.864 sec.
Hardness ratio (energy fluence ratio) = 1.73001513829
S(15-50 keV) vs. S(50-150 keV) plot
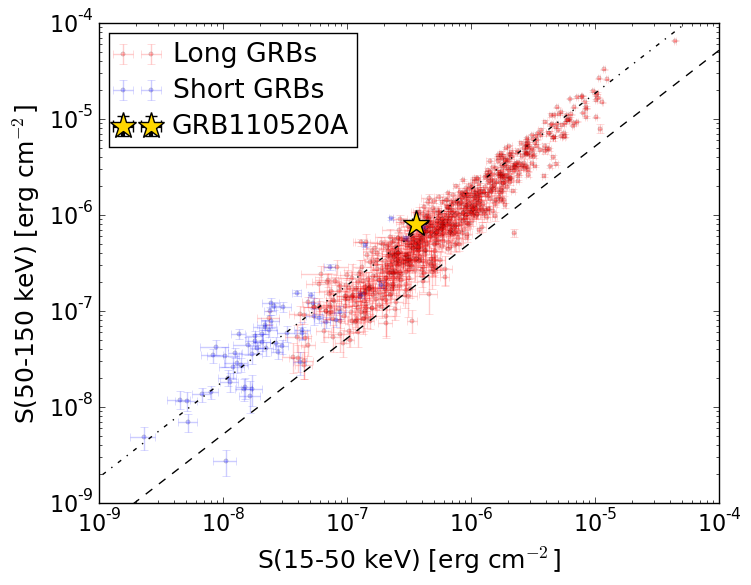
S(15-50 keV)  = 3.57031e-07
S(50-150 keV) = 8.046501e-07
The dash-dotted line and the dashed line traces the fluences calculated from the Band function with Epeak = 15 and 150 keV, respectively. Both lines assume a canonical values of alpha = -1 and beta = -2.5.
Mask shadow pattern
IMX = 5.610522469974785E-01, IMY = -1.484031830978243E-01
Spacecraft aspect plot

Bright source in the pre-burst/pre-slew/post-slew images
Pre-burst image of 15-350 keV band
Time interval of the image:
-239.168000 -1.152000

# RAcent  DECcent POSerr Theta    Phi  PeakCts   SNR AngSep     Name
#  [deg]    [deg]    ['] [deg]  [deg]                   [']
 83.6321  22.0205    0.3  26.8 -111.7   9.7701  36.1    0.4	Crab
151.6301  15.7103    3.0  39.0   93.5   3.2969   3.8 ------	UNKNOWN
136.2542  -4.7533    2.4  42.3  132.8   3.1514   4.7 ------	UNKNOWN
 63.0856  34.3183    2.9  41.1  -81.3   3.2513   4.0 ------	UNKNOWN
Pre-slew background subtracted image of 15-350 keV band
Time interval of the image:
-1.152000 25.532600

# RAcent  DECcent POSerr Theta    Phi  PeakCts   SNR AngSep     Name
#  [deg]    [deg]    ['] [deg]  [deg]                   [']
 83.4692  22.0534    5.0  27.0 -111.5   0.1726   2.3    9.4	Crab
165.2193  53.8765    2.8  44.3   32.6   0.6021   4.2 ------	UNKNOWN
186.5702  72.4871    2.5  56.3   10.5   1.7211   4.6 ------	UNKNOWN
134.3597  56.4213    0.5  30.1   14.8   1.7193  23.6 ------	UNKNOWN
 58.1437  47.2529    2.6  44.1  -61.9   1.0531   4.4 ------	UNKNOWN
 66.2024  23.6462    2.0  41.1  -98.1   1.4961   5.7 ------	UNKNOWN
Post-slew image of 15-350 keV band
Time interval of the image:
83.532600 962.878700

# RAcent  DECcent POSerr Theta    Phi  PeakCts   SNR AngSep     Name
#  [deg]    [deg]    ['] [deg]  [deg]                   [']
223.2269  62.4581    3.8  42.0   43.0   4.9931   3.5 ------	UNKNOWN
222.6601  62.5138    3.8  41.7   43.2   5.6642   4.0 ------	UNKNOWN
  1.5658  60.1642    3.3  57.6  -26.3  11.6113   3.5 ------	UNKNOWN
105.7168   6.0113    4.1  55.2 -145.3  10.9307   2.8 ------	UNKNOWN