Analysis Summary
Notes:
- 1) No attempt has been made to eliminate the non-significant decimal places.
- 2) This batgrbproduct analysis is done using the HEASARC data.
- 3) This batgrbproduct analysis is using the flight position for the mask-weighting calculation.
======================================================================
                  BAT GRB EVENT DATA PROCESSING REPORT
    Process Script Ver: batgrbproduct v2.46
    Process Start Time: Mon Jan 13 22:15:47 EST 2014
             Host Name: batevent1
   Current Working Dir: /local/data/batevent/batevent_reproc/trigger453788
======================================================================

  Trigger: 00453788      Segment: 000

  BAT Trigger Time: 327685898.432   [s; MET]
      Trigger Stop: 327685906.624   [s; MET]
               UTC: 2011-05-21T15:51:31.455260    [includes UTCF correction]
       Where From?: TDRSS position message

  BAT
    RA: 120.144250897113   Dec: 45.7980888226143  [deg; J2000]

     Catalogged Source?: NO
     Point Source?:      YES
     GRB Indicated?:     YES    [ by BAT flight software ]
     Image S/N Ratio:    7.26
     Image Trigger?:     NO
     Rate S/N Ratio:     17.8885438199983  [ if not an image trigger ]
     Image S/N Ratio:    7.26

  Analysis Position:   [ source = BAT ]
    RA: 120.144250897113   Dec: 45.7980888226143  [deg; J2000]

  Refined Position:   [ source = BAT pre-slew burst ]
    RA: 120.127823405101   Dec: 45.8080649994631  [deg; J2000]
        { 08h 00m 30.7s , +45d 48' 29.0" }
         +/- 2.21701869122503 [arcmin] (estimated 90% radius based on SNR)
         +/- 0.990251529649291 [arcmin] (formal 1-sigma fit error)
    SNR: 9.75353752460828

  Angular difference between the analysis and refined position is 0.911276 arcmin

  Partial Coding Fraction: 1.015625    [ including projection effects ]

  Duration
     T90: 96 +/- 49.0407993409569
        Measured from: 1.56800001859665
                   to: 97.5680000185966     [s; relative to TRIGTIME]
     T50: 35 +/- 43.1045241245046
        Measured from: 6.56800001859665
                   to: 41.5680000185966     [s; relative to TRIGTIME]


  Fluence
     Peak Flux  (peak 1 second)
        Measured from: 7.56800001859665
                   to: 8.56800001859665     [s; relative to TRIGTIME]
     Total Fluence
        Measured from: 0.568000018596649
                   to: 108.568000018597     [s; relative to TRIGTIME]

             Band 1     Band 2     Band 3     Band 4
              15-25      25-50     50-100    100-350     keV
 Total     0.117595   0.284623   0.304436   0.219400
           0.053945   0.055744   0.050220   0.045367 [error]
 Peak      0.007488   0.022584   0.016447   0.019645
           0.005262   0.005728   0.005210   0.004681 [error]

     [ fluence units of on-axis counts / fully illuminated detector ]

======================================================================


====== Table of the duration information =============================

        Value   tstart    tstop
T100  108.000    0.568  108.568
T90    96.000    1.568   97.568
T50    35.000    6.568   41.568
Peak    1.000    7.568    8.568


====== Spectral Analysis Summary =====================================

Model      : spectral model: simple power-law (PL) and cutoff power-law (CPL)
Ph_index   : photon index: E^{Ph_index}
Ph_90err   : 90% error of the photon index
Epeak      : Epeak in keV
Epeak_90err: 90% error of Epeak
Norm       : normalization at 50 keV in both the PL model and CPL model
Nomr_90err : 90% error of the normalization
chi2       : Chi-Squared
dof        : degree of freedo

=== Time-averaged spectral analysis ===
(Best model with acceptable fit: PL)

Model Ph_index Ph_90err_low Ph_90err_hi  Epeak  Epeak_90err_low  Epeak_90err_hi  Norm       Nomr_90err_low    Norm_90err_hi    chi2    dof
PL      -0.765    -0.335      0.375       -           -               -         5.24e-04     -1.04e-04          9.96e-05      52.260   57
CPL     -0.695    -0.407      1.088      999.880    -999.880      -999.880      5.66e-04     -1.43e-04          -5.66e-04      52.380   56


=== 1-s peak spectral analysis ===
(Best model with acceptable fit: PL)

Model Ph_index Ph_90err_low Ph_90err_hi  Epeak  Epeak_90err_low  Epeak_90err_hi  Norm       Nomr_90err_low    Norm_90err_hi    chi2    dof
PL      -0.737     -0.529     0.673       -           -               -         3.75e-03     -1.23e-03          1.10e-03      65.570   57
CPL     -0.758     -0.506     0.996     9999.360    -9999.360      -9999.360      3.80e-03     -1.08e-03          8.98e-03      65.590   56


=== Fluence/Peak Flux Summary ===

              Model    Band1     Band2     Band3     Band4     Band5     Total
                       15-25     25-50    50-100    100-350    15-150    15-350    keV
Fluence         PL   3.64e-08  1.05e-07  2.48e-07  1.60e-06  6.71e-07  1.99e-06   erg/cm2
      90%_error_low -1.46e-08 -2.74e-08 -4.60e-08 -6.20e-07 -1.26e-07 -6.44e-07   erg/cm2
      90%_error_hi   1.71e-08  2.63e-08  4.54e-08  9.18e-07  1.26e-07  9.14e-07   erg/cm2
Peak flux       PL   7.47e-02  1.19e-01  1.43e-01  3.34e-01  4.32e-01  6.70e-01   ph/cm2/s
      90%_error_low -4.65e-02 -5.25e-02 -4.01e-02 -1.76e-01 -1.23e-01 -2.04e-01   ph/cm2/s
      90%_error_hi   5.90e-02  4.80e-02  3.93e-02  3.24e-01  1.24e-01  2.69e-01   ph/cm2/s

Fluence        CPL   3.64e-08  1.05e-07  2.43e-07  1.73e-06  6.77e-07  2.00e-06   erg/cm2
      90%_error_low    N/A       N/A    -4.10e-08 -1.28e-06 -1.32e-07 -1.18e-06   erg/cm2
      90%_error_hi     N/A       N/A     5.50e-08  2.62e-07  1.27e-07  3.54e-07   erg/cm2
Peak flux      CPL   7.49e-02  1.20e-01  1.41e-01  3.76e-01  4.39e-01  6.70e-01   ph/cm2/s
      90%_error_low     N/A   -5.40e-02     N/A       N/A   -1.64e-01 -6.70e-01   ph/cm2/s
      90%_error_hi      N/A    4.75e-02     N/A       N/A    1.52e-01  5.19e+00   ph/cm2/s

======================================================================
Image
Pre-slew 15.0-350.0 keV image (Event data)
#   RAcent    DECcent   POSerr    Theta     Phi              Peak Cts       SNR   Name
  120.1278    45.8081   0.0197    13.8173  -144.1414         0.7262714      9.754 TRIG_00453788

Foreground time interval of the image:
  0.568  49.869 (delta_t =  49.301 [sec])
Background time interval of the image:
-239.432   0.568 (delta_t = 240.000 [sec])
Light Curves
Note: The mask-weighted lightcurves have units of either count/det or counts/sec/det, where a det is 0.4 x 0.4 = 0.16 sq cm.
Full-time range; 1 s binning
Other quick-look light curves:
- 64 ms binning (zoomed)
- 16 ms binning (zoomed)
- 8 ms binning (zoomed)
- 2 ms binning (zoomed)
- SN=5 or 10 s binning (full-time range)
- Raw light curve
Spectra
- 64 ms binning (zoomed)
- 16 ms binning (zoomed)
- 8 ms binning (zoomed)
- 2 ms binning (zoomed)
- SN=5 or 10 s binning (full-time range)
- Raw light curve
Spectra
Notes:
- 1) The fitting includes the systematic errors.
- 2) When the burst includes telescope slew time periods, the fitting uses an average response file made from multiple 5-s response files through out the slew time plus single time preiod for the non-slew times, and weighted by the total counts in the corresponding time period using addrmf. An average response file is needed becuase a spectral fit using the pre-slew DRM will introduce some errors in both a spectral shape and a normalization if the PHA file contains a lot of the slew/post-slew time interval.
- 3) For fits to more complicated models (e.g. a power-law over a cutoff power-law), the BAT team has decided to require a chi-square improvement of more than 6 for each extra dof.
Time averaged spectrum fit using the average DRM
Power-law model
Time interval is from    0.568 sec. to  108.568 sec.

Spectral model in power-law:
------------------------------------------------------------
Parameters  : value       lower 90%   higher 90%
Photon index: -0.764703     ( -0.335202   0.374755 )
Norm@50keV  : 5.23647E-04    ( -0.000103856   9.96412e-05 )
------------------------------------------------------------
#Fit statistic : Chi-Squared =          52.26 using 59 PHA bins.
# Reduced chi-squared =         0.9168 for     57 degrees of freedom
# Null hypothesis probability =   6.533286e-01

Photon flux (15-150 keV)    in 108 sec: 6.02747E-02 ( -0.011179  0.0112597 ) ph/cm2/s
Energy fluence (15-150 keV)             : 6.70955e-07 ( -1.25545e-07  1.26458e-07 ) ergs/cm2
Cutoff power-law model
Time interval is from    0.568 sec. to  108.568 sec.
Spectral model in the cutoff power-law:
------------------------------------------------------------
Parameters  : value       lower 90%   higher 90%
Photon index: -0.757519     ( -0.406674   1.08759 )
Epeak [keV] : 1.00000E+04      ( -10000 -10000 )
Norm@50keV  : 5.27466E-04    ( -0.000104003   -0.000527499 )
------------------------------------------------------------
#Fit statistic : Chi-Squared =          52.27 using 59 PHA bins.
# Reduced chi-squared =         0.9333 for     56 degrees of freedom
# Null hypothesis probability =   6.169408e-01

Photon flux (15-150 keV)    in 108 sec: 6.08720E-02 (    ) ph/cm2/s
Energy fluence (15-150 keV)             : 6.76976e-07 ( -1.32494e-07  1.27057e-07 ) ergs/cm2
1-s peak spectrum fit
Power-law model
Time interval is from    7.568 sec. to    8.568 sec.

Spectral model in power-law:
------------------------------------------------------------
Parameters  : value       lower 90%   higher 90%
Photon index: -0.737404     ( -0.529493   0.673377 )
Norm@50keV  : 3.75007E-03    ( -0.00122614   0.00109897 )
------------------------------------------------------------
#Fit statistic : Chi-Squared =          65.57 using 59 PHA bins.
# Reduced chi-squared =          1.150 for     57 degrees of freedom
# Null hypothesis probability =   2.040907e-01

Photon flux (15-150 keV)    in 1 sec: 0.432321 ( -0.123471  0.124203 ) ph/cm2/s
Energy fluence (15-150 keV)             : 4.50236e-08 ( -1.30494e-08  1.32149e-08 ) ergs/cm2
Cutoff power-law model
Time interval is from    7.568 sec. to    8.568 sec.
Spectral model in the cutoff power-law:
------------------------------------------------------------
Parameters  : value       lower 90%   higher 90%
Photon index: -0.758317     ( -0.507989   0.994819 )
Epeak [keV] : 9999.36      ( -9999.36 -9999.36 )
Norm@50keV  : 3.80164E-03    ( -0.00107698   0.00898292 )
------------------------------------------------------------
#Fit statistic : Chi-Squared =          65.59 using 59 PHA bins.
# Reduced chi-squared =          1.171 for     56 degrees of freedom
# Null hypothesis probability =   1.784643e-01

Photon flux (15-150 keV)    in 1 sec: 0.438677 ( -0.163896  0.152148 ) ph/cm2/s
Energy fluence (15-150 keV)             : 4.51606e-08 ( -1.67821e-08  7.50415e-09 ) ergs/cm2
Time-resolved spectra
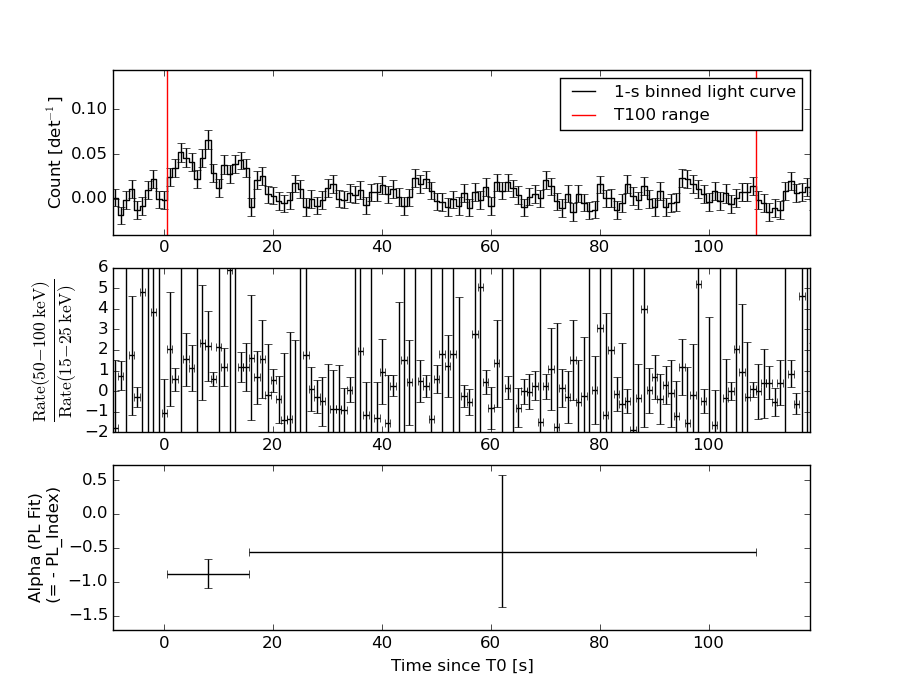
Distribution
T90 vs. Hardness ratio plot
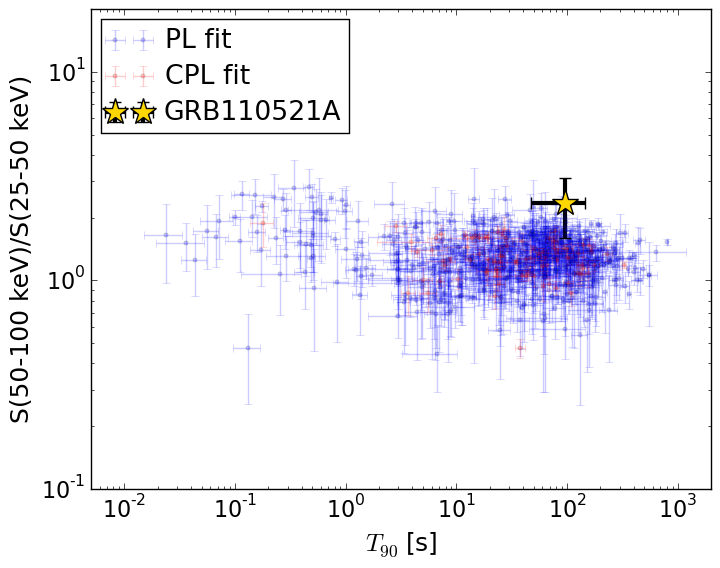
T90                                   = 96.0 sec.
Hardness ratio (energy fluence ratio) = 2.35434519019
S(15-50 keV) vs. S(50-150 keV) plot
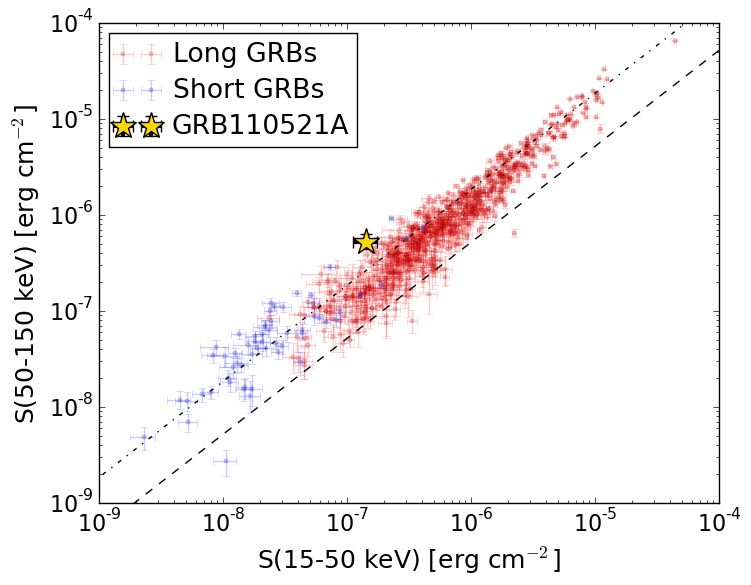
S(15-50 keV)  = 1.4193299e-07
S(50-150 keV) = 5.290256e-07
The dash-dotted line and the dashed line traces the fluences calculated from the Band function with Epeak = 15 and 150 keV, respectively. Both lines assume a canonical values of alpha = -1 and beta = -2.5.
Mask shadow pattern
IMX = -1.993289069839686E-01, IMY = 1.440704497886629E-01
Spacecraft aspect plot
Bright source in the pre-burst/pre-slew/post-slew images
Pre-burst image of 15-350 keV band
Time interval of the image:
-239.432000 0.568000

# RAcent  DECcent POSerr Theta    Phi  PeakCts   SNR AngSep     Name
#  [deg]    [deg]    ['] [deg]  [deg]                   [']
181.4505  58.9865    3.0  24.8   54.4   0.9758   3.8 ------	UNKNOWN
140.4938  44.8723    2.3  12.2  149.0   0.9095   5.1 ------	UNKNOWN
355.3487  83.5961    2.1  38.6  -16.6   1.3707   5.4 ------	UNKNOWN
117.3398  11.0190    2.2  47.3 -166.9   1.9142   5.3 ------	UNKNOWN
 93.2845  15.9832    2.1  50.9 -135.5   4.8742   5.4 ------	UNKNOWN
Pre-slew background subtracted image of 15-350 keV band
Time interval of the image:
0.568000 49.868590

# RAcent  DECcent POSerr Theta    Phi  PeakCts   SNR AngSep     Name
#  [deg]    [deg]    ['] [deg]  [deg]                   [']
246.8004  80.7881    2.2  37.9    4.0   0.5830   5.1 ------	UNKNOWN
126.7086  19.3764    2.3  37.5 -178.0   0.5302   5.0 ------	UNKNOWN
124.7346  12.7020    2.3  44.4 -176.4   0.6993   5.0 ------	UNKNOWN
120.1282  45.8082    1.2  13.8 -144.1   0.7223   9.7 ------	UNKNOWN
115.0129  19.1274    2.6  40.0 -160.8   0.5259   4.5 ------	UNKNOWN
Post-slew image of 15-350 keV band
Time interval of the image:
84.668630 962.601200

# RAcent  DECcent POSerr Theta    Phi  PeakCts   SNR AngSep     Name
#  [deg]    [deg]    ['] [deg]  [deg]                   [']
 83.6352  22.0096    0.4  38.0 -111.0  35.7939  31.0    0.3	Crab
166.2062  33.8733    3.1  36.7   97.7   4.9511   3.7 ------	UNKNOWN
107.6355  -6.0997    2.6  53.1 -159.1   5.8764   4.5 ------	UNKNOWN
  6.9135  67.3928    3.1  56.2  -19.9   7.0864   3.7 ------	UNKNOWN