Analysis Summary
Notes:
- 1) No attempt has been made to eliminate the non-significant decimal places.
- 2) This batgrbproduct analysis is done using the HEASARC data.
- 3) This batgrbproduct analysis is using the flight position for the mask-weighting calculation.
Special note: Due to the low partial coding fraction, the refined position is found using the DETECTION mask. Therefore, the refined position and the mask shadow pattern shown here are from analyses with DETECTION mask, everything else uses the FLUX mask.
======================================================================
                  BAT GRB EVENT DATA PROCESSING REPORT
    Process Script Ver: batgrbproduct v2.46
    Process Start Time: Sat May  9 18:44:18 EDT 2015
             Host Name: bat1
   Current Working Dir: /local/data/bat1/alien/Swift_3rdBATcatalog/event/batevent_reproc/trigger456073
======================================================================

  Trigger: 00456073      Segment: 000

  BAT Trigger Time: 330728915.52   [s; MET]
      Trigger Stop: 330728916.544   [s; MET]
               UTC: 2011-06-25T21:08:28.426680    [includes UTCF correction]
       Where From?: TDRSS position message

  BAT
    RA: 286.750429390696   Dec: 6.75284305356182  [deg; J2000]

     Catalogged Source?: NO
     Point Source?:      YES
     GRB Indicated?:     YES    [ by BAT flight software ]
     Image S/N Ratio:    10.3
     Image Trigger?:     NO
     Rate S/N Ratio:     144.274044789768  [ if not an image trigger ]
     Image S/N Ratio:    10.3

  Analysis Position:   [ source = BAT ]
    RA: 286.750429390696   Dec: 6.75284305356182  [deg; J2000]

  Refined Position:   [ source = BAT pre-slew burst ]
    RA:    Dec:   [deg; J2000]
        { 00h 00m 00.0s , +00d 00' 00.0" }
         +/- -inf [arcmin] (estimated 90% radius based on SNR)
         +/- 0 [arcmin] (formal 1-sigma fit error)
    SNR:

  Angular difference between the analysis and refined position is 4402.149900 arcmin

  Partial Coding Fraction: 0.05566406    [ including projection effects ]

  Duration
     T90: 42.4999999403954 +/- 8.88972668448127
        Measured from: -2.99199998378754
                   to: 39.5079999566078     [s; relative to TRIGTIME]
     T50: 12.907999932766 +/- 1.25634387471193
        Measured from: 4.01600003242493
                   to: 16.9239999651909     [s; relative to TRIGTIME]


  Fluence
     Peak Flux  (peak 1 second)
        Measured from: 13.7400000095367
                   to: 14.7400000095367     [s; relative to TRIGTIME]
     Total Fluence
        Measured from: -6.18799996376038
                   to: 140.344000041485     [s; relative to TRIGTIME]

             Band 1     Band 2     Band 3     Band 4
              15-25      25-50     50-100    100-350     keV
 Total     9.752557  14.552656  12.728200   3.850147
           0.261820   0.278943   0.262663   0.189523 [error]
 Peak      1.055315   2.030570   2.197565   0.615871
           0.070223   0.089850   0.095606   0.060650 [error]

     [ fluence units of on-axis counts / fully illuminated detector ]

======================================================================


====== Table of the duration information =============================

        Value   tstart    tstop
T100  146.532   -6.188  140.344
T90    42.500   -2.992   39.508
T50    12.908    4.016   16.924
Peak    1.000   13.740   14.740


====== Spectral Analysis Summary =====================================

Model      : spectral model: simple power-law (PL) and cutoff power-law (CPL)
Ph_index   : photon index: E^{Ph_index}
Ph_90err   : 90% error of the photon index
Epeak      : Epeak in keV
Epeak_90err: 90% error of Epeak
Norm       : normalization at 50 keV in both the PL model and CPL model
Nomr_90err : 90% error of the normalization
chi2       : Chi-Squared
dof        : degree of freedo

=== Time-averaged spectral analysis ===
(Best model with acceptable fit: PL)

Model Ph_index Ph_90err_low Ph_90err_hi  Epeak  Epeak_90err_low  Epeak_90err_hi  Norm       Nomr_90err_low    Norm_90err_hi    chi2    dof
PL      -1.432    -0.044      0.044       -           -               -         2.00e-02     -4.74e-04          4.73e-04      47.480   57
CPL     -1.269    -0.082      0.179      260.481    -105.279      -260.481      2.36e-02     -3.15e-03          4.49e-03      44.860   56


=== 1-s peak spectral analysis ===
(Best model with acceptable fit: CPL)

Model Ph_index Ph_90err_low Ph_90err_hi  Epeak  Epeak_90err_low  Epeak_90err_hi  Norm       Nomr_90err_low    Norm_90err_hi    chi2    dof
PL      -1.209     -0.077     0.077       -           -               -         4.21e-01     -2.00e-02          2.00e-02      59.330   57
CPL     -0.540     -0.330     0.355      124.207     -24.778        63.959      8.50e-01     -2.43e-01          3.69e-01      46.520   56


=== Fluence/Peak Flux Summary ===

              Model    Band1     Band2     Band3     Band4     Band5     Total
                       15-25     25-50    50-100    100-350    15-150    15-350    keV
Fluence         PL   3.51e-06  6.72e-06  9.97e-06  3.17e-05  2.81e-05  5.19e-05   erg/cm2
      90%_error_low -1.71e-07 -1.93e-07 -2.73e-07 -1.97e-06 -6.85e-07 -2.10e-06   erg/cm2
      90%_error_hi   1.74e-07  1.93e-07  2.72e-07  2.05e-06  6.85e-07  2.16e-06   erg/cm2
Peak flux       PL   1.31e+01  1.57e+01  1.36e+01  2.01e+01  4.95e+01  6.25e+01   ph/cm2/s
      90%_error_low -1.13e+00 -8.64e-01 -7.34e-01 -2.13e+00 -2.41e+00 -3.10e+00   ph/cm2/s
      90%_error_hi   1.16e+00  8.60e-01  7.30e-01  2.26e+00  2.42e+00  3.11e+00   ph/cm2/s

Fluence        CPL   3.36e-06  6.77e-06  1.01e-05  2.60e-05  2.79e-05  4.63e-05   erg/cm2
      90%_error_low -2.28e-07 -2.02e-07 -3.27e-07 -4.82e-06 -7.23e-07 -4.82e-06   erg/cm2
      90%_error_hi   2.33e-07  2.03e-07  3.30e-07  6.00e-06  7.21e-07  5.18e-06   erg/cm2
Peak flux      CPL   1.12e+01  1.64e+01  1.48e+01  1.14e+01  4.86e+01  5.38e+01   ph/cm2/s
      90%_error_low -1.41e+00 -9.71e-01 -9.56e-01 -2.63e+00 -2.45e+00 -3.63e+00   ph/cm2/s
      90%_error_hi   1.45e+00  9.80e-01  9.69e-01  3.55e+00  2.45e+00  4.17e+00   ph/cm2/s

======================================================================
Image
Pre-slew 15.0-350.0 keV image (Event data; DETECTION mask)
#   RAcent    DECcent   POSerr    Theta     Phi              Peak Cts       SNR   Name
  286.7457     6.7574   0.0083    41.8603    60.1205        13.2926606     23.198 TRIG_00456073

Foreground time interval of the image:
 -6.384  12.181 (delta_t =  18.565 [sec])
Background time interval of the image:
-239.520  -6.384 (delta_t = 233.136 [sec])
Light Curves
Note: The mask-weighted lightcurves have units of either count/det or counts/sec/det, where a det is 0.4 x 0.4 = 0.16 sq cm.
Full-time range; 1 s binning
Other quick-look light curves:
- 64 ms binning (zoomed)
- 16 ms binning (zoomed)
- 8 ms binning (zoomed)
- 2 ms binning (zoomed)
- SN=5 or 10 s binning (full-time range)
- Raw light curve
Spectra
- 64 ms binning (zoomed)
- 16 ms binning (zoomed)
- 8 ms binning (zoomed)
- 2 ms binning (zoomed)
- SN=5 or 10 s binning (full-time range)
- Raw light curve
Spectra
Notes:
- 1) The fitting includes the systematic errors.
- 2) When the burst includes telescope slew time periods, the fitting uses an average response file made from multiple 5-s response files through out the slew time plus single time preiod for the non-slew times, and weighted by the total counts in the corresponding time period using addrmf. An average response file is needed becuase a spectral fit using the pre-slew DRM will introduce some errors in both a spectral shape and a normalization if the PHA file contains a lot of the slew/post-slew time interval.
- 3) For fits to more complicated models (e.g. a power-law over a cutoff power-law), the BAT team has decided to require a chi-square improvement of more than 6 for each extra dof.
Time averaged spectrum fit using the average DRM
Power-law model
Time interval is from   -6.188 sec. to  140.344 sec.

Spectral model in power-law:
------------------------------------------------------------
Parameters  : value       lower 90%   higher 90%
Photon index: -1.43236     ( -0.0437445   0.0437598 )
Norm@50keV  : 1.99948E-02    ( -0.000473491   0.000473325 )
------------------------------------------------------------
#Fit statistic : Chi-Squared =          47.48 using 59 PHA bins.
# Reduced chi-squared =         0.8330 for     57 degrees of freedom
# Null hypothesis probability =   8.114154e-01

Photon flux (15-150 keV)    in 146.5 sec: 2.45354 ( -0.06566  0.06586 ) ph/cm2/s
Energy fluence (15-150 keV)             : 2.81273e-05 ( -6.84518e-07  6.85012e-07 ) ergs/cm2
Cutoff power-law model
Time interval is from   -6.188 sec. to  140.344 sec.
Spectral model in the cutoff power-law:
------------------------------------------------------------
Parameters  : value       lower 90%   higher 90%
Photon index: -1.26851     ( -0.0819677   0.178912 )
Epeak [keV] : 260.481      ( -105.284 -260.486 )
Norm@50keV  : 2.35610E-02    ( -0.00315347   0.00449237 )
------------------------------------------------------------
#Fit statistic : Chi-Squared =          44.86 using 59 PHA bins.
# Reduced chi-squared =         0.8011 for     56 degrees of freedom
# Null hypothesis probability =   8.570990e-01

Photon flux (15-150 keV)    in 146.5 sec: 2.42418 ( -0.0718  0.07206 ) ph/cm2/s
Energy fluence (15-150 keV)             : 2.79137e-05 ( -7.23143e-07  7.21359e-07 ) ergs/cm2
1-s peak spectrum fit
Power-law model
Time interval is from   13.740 sec. to   14.740 sec.

Spectral model in power-law:
------------------------------------------------------------
Parameters  : value       lower 90%   higher 90%
Photon index: -1.20922     ( -0.0767445   0.0766503 )
Norm@50keV  : 0.421255    ( -0.0199733   0.0199733 )
------------------------------------------------------------
#Fit statistic : Chi-Squared =          59.33 using 59 PHA bins.
# Reduced chi-squared =          1.041 for     57 degrees of freedom
# Null hypothesis probability =   3.907679e-01

Photon flux (15-150 keV)    in 1 sec: 49.5120 ( -2.4146  2.4165 ) ph/cm2/s
Energy fluence (15-150 keV)             : 4.26324e-06 ( -2.20647e-07  2.21115e-07 ) ergs/cm2
Cutoff power-law model
Time interval is from   13.740 sec. to   14.740 sec.
Spectral model in the cutoff power-law:
------------------------------------------------------------
Parameters  : value       lower 90%   higher 90%
Photon index: -0.540157     ( -0.32962   0.354567 )
Epeak [keV] : 124.207      ( -24.7781 63.9589 )
Norm@50keV  : 0.850392    ( -0.243235   0.368535 )
------------------------------------------------------------
#Fit statistic : Chi-Squared =          46.52 using 59 PHA bins.
# Reduced chi-squared =         0.8307 for     56 degrees of freedom
# Null hypothesis probability =   8.127402e-01

Photon flux (15-150 keV)    in 1 sec: 48.6082 ( -2.4502  2.4537 ) ph/cm2/s
Energy fluence (15-150 keV)             : 4.19257e-06 ( -2.29698e-07  2.29036e-07 ) ergs/cm2
Time-resolved spectra
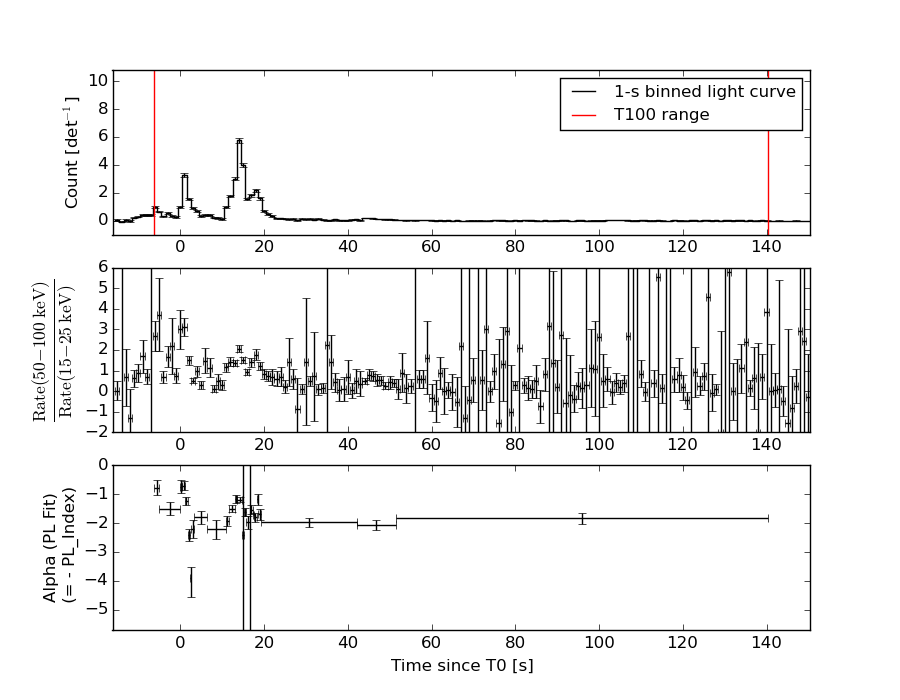
Distribution
T90 vs. Hardness ratio plot
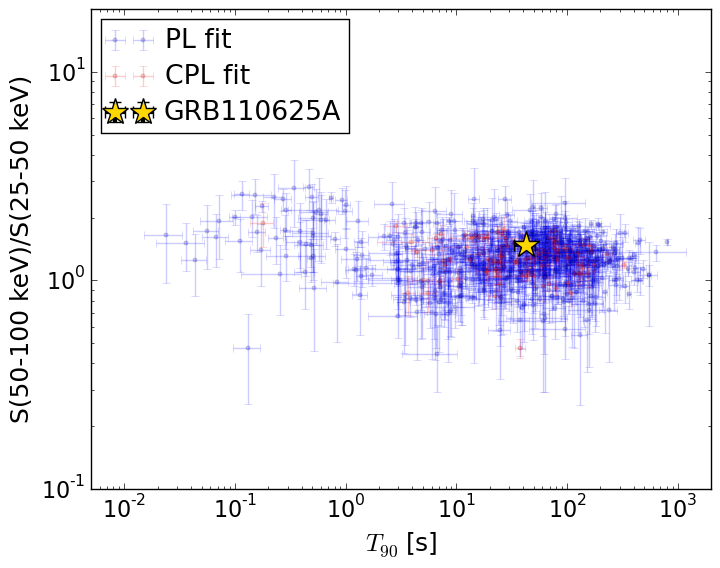
T90                                   = 42.5 sec.
Hardness ratio (energy fluence ratio) = 1.48214261279
S(15-50 keV) vs. S(50-150 keV) plot
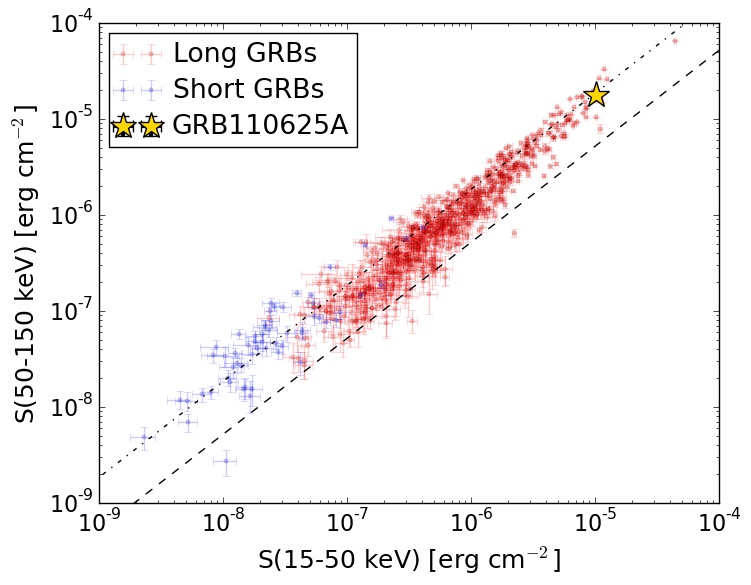
S(15-50 keV)  = 1.0234031e-05
S(50-150 keV) = 1.7893081e-05
The dash-dotted line and the dashed line traces the fluences calculated from the Band function with Epeak = 15 and 150 keV, respectively. Both lines assume a canonical values of alpha = -1 and beta = -2.5.
Mask shadow pattern (with DETECTION mask)
IMX = 4.463664410743676E-01, IMY = -7.768972282570237E-01
Spacecraft aspect plot
Bright source in the pre-burst/pre-slew/post-slew images
Pre-burst image of 15-350 keV band
Time interval of the image:
-239.520000 -6.188000

# RAcent  DECcent POSerr Theta    Phi  PeakCts   SNR AngSep     Name
#  [deg]    [deg]    ['] [deg]  [deg]                   [']
244.9805 -15.6395    0.2   7.3  -72.6  11.7962  52.0    0.1	Sco X-1
254.4540  35.1928    4.8  52.8    5.0   1.9724   2.4    9.0	Her X-1
256.0279 -37.8845    3.1  20.5  174.3   0.8953   3.8    3.1	4U 1700-377
256.3941 -36.4333    2.8  19.2  172.6   0.9335   4.0    2.1	GX 349+2
263.0389 -24.7565    0.8  12.3  130.1   3.1821  13.7    1.8	GX 1+4
264.7964 -44.4464    6.9  28.8  164.0   0.4875   1.7    2.3	4U 1735-44
268.2819  -1.6012    3.8  22.4   49.0   0.9035   3.1   10.3	SW J1753.5-0127
270.2765 -25.0672    2.7  18.3  119.9   1.0442   4.2    0.8	GX 5-1
270.1577 -25.8766  104.4  18.5  122.4   0.0279   0.1   11.2	GRS 1758-258
274.0121 -13.9476    8.1  21.2   85.9   0.4544   1.4    5.3	GX 17+2
275.8047 -30.3438    4.7  24.9  127.9   0.7921   2.5    6.4	H1820-303
285.0184 -24.9310  470.2  31.3  112.0   0.0112   0.0    1.1	HT1900.1-2455
262.9865 -33.8807   41.1  18.9  154.3  -0.0707  -0.3    2.8	GX 354-0
239.4090  24.8920    2.8  44.3  -14.1   1.7415   4.2 ------	UNKNOWN
233.0255  38.6342    3.0  59.1  -14.7   6.3375   3.9 ------	UNKNOWN
223.7233 -38.1876    3.1  32.3 -132.6   1.1779   3.8 ------	UNKNOWN
223.0705  32.7307    4.6  57.6  -26.4   4.1475   2.5 ------	UNKNOWN
199.6315 -56.7778    4.0  55.3 -145.3   5.1508   3.0 ------	UNKNOWN
206.8042 -29.7510    3.3  43.1 -112.3   4.7098   3.5 ------	UNKNOWN
Pre-slew background subtracted image of 15-350 keV band
Time interval of the image:
-6.188000 12.180600

# RAcent  DECcent POSerr Theta    Phi  PeakCts   SNR AngSep     Name
#  [deg]    [deg]    ['] [deg]  [deg]                   [']
244.8321 -15.7131    5.7   7.4  -73.5   0.1450   2.0    9.6	Sco X-1
254.4430  35.2747    3.8  52.9    5.0  -1.1421  -3.0    4.1	Her X-1
256.1681 -37.8765    4.4  20.6  174.0  -0.2204  -2.6    8.8	4U 1700-377
256.6095 -36.3945    7.2  19.2  172.1   0.1383   1.6    8.6	GX 349+2
263.0216 -24.7234   13.0  12.3  130.0  -0.0804  -0.9    1.5	GX 1+4
264.6679 -44.3114   28.2  28.7  164.1  -0.0417  -0.4    8.9	4U 1735-44
268.4940  -1.3020    0.0  22.8   48.8  -0.0144  -0.1   11.8	SW J1753.5-0127
270.4258 -24.9296   25.7  18.4  119.3  -0.0423  -0.4   11.8	GX 5-1
270.2380 -25.9012   12.6  18.6  122.3  -0.0815  -0.9   10.1	GRS 1758-258
274.0114 -14.0283   51.4  21.2   86.2  -0.0278  -0.2    0.6	GX 17+2
275.9499 -30.3378    8.0  25.0  127.7  -0.1789  -1.4    2.2	H1820-303
285.0610 -25.0514    9.9  31.3  112.2  -0.2602  -1.2    8.0	HT1900.1-2455
263.1406 -33.6652    0.0  18.8  153.6   0.0396   0.4   12.7	GX 354-0
286.7512   6.7540    0.5  41.9   60.1  14.7449  21.2 ------	UNKNOWN
295.3049 -37.4913    2.7  42.5  129.5   1.7505   4.3 ------	UNKNOWN
251.2791  18.3781    2.9  36.0    1.1   0.4306   4.0 ------	UNKNOWN
Post-slew image of 15-350 keV band
Time interval of the image:
126.980600 962.560000

# RAcent  DECcent POSerr Theta    Phi  PeakCts   SNR AngSep     Name
#  [deg]    [deg]    ['] [deg]  [deg]                   [']
254.5166  35.2190   39.0  41.1 -152.9  -0.2403  -0.3    7.9	Her X-1
262.9541 -24.6342    3.5  39.0  104.3   6.5685   3.3    7.3	GX 1+4
268.3521  -1.3984    2.6  20.1  135.5   2.3465   4.4    3.4	SW J1753.5-0127
270.1617 -25.0278    3.7  35.6   95.0   4.6829   3.1    7.3	GX 5-1
270.2539 -25.6430   11.0  36.1   94.4   1.6917   1.1    6.6	GRS 1758-258
274.0038 -13.9818    3.2  24.3  100.1   2.7144   3.6    3.3	GX 17+2
275.7432 -30.4365    5.0  38.6   84.0   5.9570   2.3   10.3	H1820-303
285.0021 -25.0240    5.6  31.8   71.7   2.0473   2.1    6.5	HT1900.1-2455
288.7990  10.9440    0.5   4.7  -86.2  12.2535  22.5    0.1	GRS 1915+105
299.5999  35.1905    0.6  30.8  -90.6  16.7610  19.4    0.8	Cyg X-1
308.0817  41.0074    3.2  39.2  -85.7   9.2535   3.6    3.5	Cyg X-3
298.2752  -6.9729    3.3  17.9   28.4   1.6462   3.5 ------	UNKNOWN
295.3488  19.7561    2.7  15.5  -79.6   2.1164   4.3 ------	UNKNOWN
334.8487   7.8646    2.5  47.7  -25.9   4.8290   4.6 ------	UNKNOWN
342.2828   3.0334    4.5  55.4  -20.4   4.7726   2.5 ------	UNKNOWN
244.7149  42.6001    3.1  51.6 -150.4   5.7366   3.7 ------	UNKNOWN
275.5938  51.0875    3.6  45.3 -121.2   7.1125   3.2 ------	UNKNOWN